Scored using Cameras Methodology v3.0
Cameras Methodology v3.0
Mathematical & Unbiased Scoring
Products in this category are scored under Frontum Cameras Methodology v3.0: the technical score from the specifications is the base, and independent expert and video reviews (up to ±0.5 points), owner opinions (up to ±0.3) and best-of lists (up to +0.3) move it up or down.
Explore Cameras Methodology v3.0

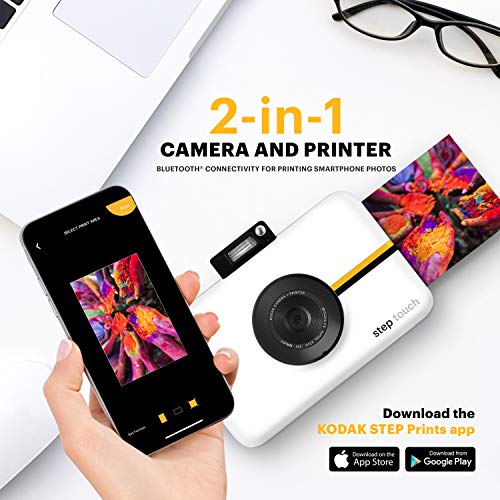
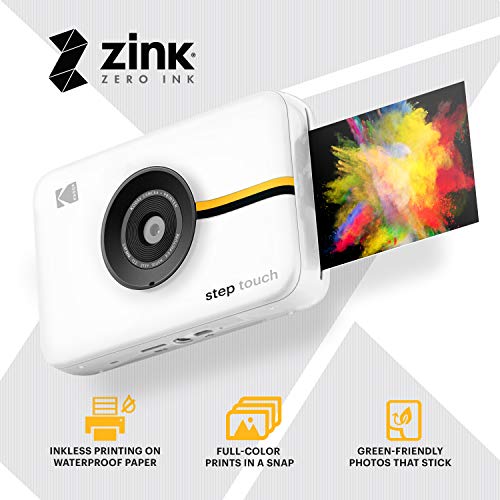
Kodak Step Touch review: 112 specs compared

Avg. price:~£140Sensor size:1/2.3"Weight:100 gBattery life (CIPA):?

Kodak Step Touch Review: Compare 112 technical specifications and 1 expert reviews to see how this product ranks in the Cameras category and whether it is worth buying.
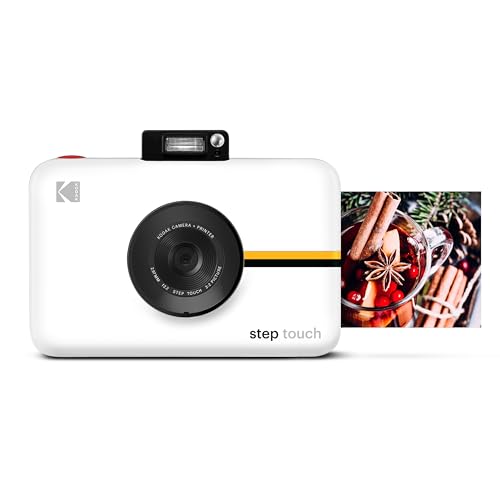
Kodak Step Touch
5.9/10

Overall score

Score
5.9/ 10
✕
What it is
Our main score for this model, 1–10. It combines specs, best-of lists, expert reviews and owners.
How we count it
Parts: Technical score 35%, List score 30%, Reviews score 25%, Sentiment score 10%
Marks: Each part gets a mark out of 10. For reviews, lists and owners, a typical model in this category gets about 8 and the best one gets 10.
No data yet: A part with no data shows "?". It counts as the mark of a weaker model in this category (4 in 5 models with data score higher). This way, models with reviews, lists and owners usually come out ahead.
Score distribution
â–¼
<55-66-77-88-99-10
Score components

35%

4.8

Technical score

30%

?

List scoreNot enough data yet, so we use 7.5, the mark of a weaker model in this category

25%

4.8

Reviews score

10%

?

Sentiment scoreNot enough data yet, so we use 7.1, the mark of a weaker model in this category

â–¼Worse than 67% of cameras
7.0

Value for money

Value for money
7.0/ 10
✕
What it is
An indicator that combines the camera's overall rating with its cost.
When it matters
When you want to know how much overall quality you get for the price.
Score distribution
â–¼
<55-66-77-88-99-10
Score components

70%

5.9

Overall score

30%

9.8

Price

â–²Better than 54%
4.8

Technical score

Technical score
4.8/ 10
✕
What it is
How good the specs are compared with the other models in this category, 1–10.
How we count it
Areas: We rate the specs in each area against the other models in this category.
Weighting: The areas that matter most to buyers count more. The shares are shown under Score components.
Share: The technical score is 35% of the overall score.
Score distribution
â–¼
<55-66-77-88-99-10
Score components

28%

4.7

Sensor & Image

25%

4.4

Photo Features

18%

3.8

Video & Audio

14%

6.4

Display & Design

8%

6.0

Battery & Power

7%

5.2

Connectivity & Storage

â–¼Worse than 53%
4.8

Reviews score

Reviews score
4.8/ 10
✕
What it is
Average grade from independent test sites, magazines and video reviewers, 1–10.
How we count it
Grades: Each review's own score is converted to 1–10; without one, we grade the review ourselves. Big test sites count more, short reviews half as much as full tests. A video review counts half.
Score: The average grade is 80% of the review mark; the number of reviews is the other 20% (1 review = 5, the typical number in this category = 8, the most-reviewed model = 10).
Enough data: With few reviews, the average grade is pulled toward the typical grade of this category. No reviews yet: 7.5 for now.
Share: Reviews count 25% of the overall score.
Score distribution
â–¼
<55-66-77-88-99-10

4.8

Mark 7.2 is below the typical mark 7.9 of this category, so it cannot lift the score above the technical score

80%

7.7

Average grade

20%

5.0

Popularity

Grades by review (1)
1 review, with a printed score. Reviews count 25% of the overall score.
User ratings collected online are not part of this score.
â–¼Worse than 69%
?

List score

List score
7.5/ 10
✕
What it is
How often independent test sites, magazines and video reviewers put this model in their best-of lists for this category.
How we count it
Points: The model in the most lists of this category gets 10; the others get 8 to 10 in proportion. In no list yet: 7.5. Lists count 30% of the overall score.
Enough data: Every list counts, even a single one. With fewer than 5 best-of lists in the category, this part is left out.
Lists with this model (0)
Not in any best-of list yet, so this part counts as 7.5. Models in a list get 8 to 10.
Not in any best-of list yet
  • kodak-step-touch
  • kodak-step-touch
  • kodak-step-touch
  • kodak-step-touch
  • kodak-step-touch
  • kodak-step-touch
kodak-step-touch
kodak-step-touch
kodak-step-touch
kodak-step-touch
kodak-step-touch
kodak-step-touch
Where to buy
*As an Amazon Associate, we earn from qualifying purchases.
Loading...
Loading category ranking...

Technical Specifications of camera Kodak Step Touch

Technical score
Technical score
4.8/ 10
✕
What it is
How good the specs are compared with the other models in this category, 1–10.
How we count it
Areas: We rate the specs in each area against the other models in this category.
Weighting: The areas that matter most to buyers count more. The shares are shown under Score components.
Share: The technical score is 35% of the overall score.
Score distribution
â–¼
<55-66-77-88-99-10
Score components:

28%

4.7

Sensor & Image

25%

4.4

Photo Features

18%

3.8

Video & Audio

14%

6.4

Display & Design

8%

6.0

Battery & Power

7%

5.2

Connectivity & Storage

4.8
Reviews score
4.8
List score
?
Value for money
Value for money
7.0/ 10
✕
What it is
An indicator that combines the camera's overall rating with its cost.
When it matters
When you want to know how much overall quality you get for the price.
Score distribution
â–¼
<55-66-77-88-99-10
Score components:

70%

5.9

Overall score

30%

9.8

Price

7.0
Sensor size
1/2.3"
This camera has a sensor size of 1/2.3", which is smaller than 59.1% of cameras and the same as 39.1% of cameras.
Sensor resolution
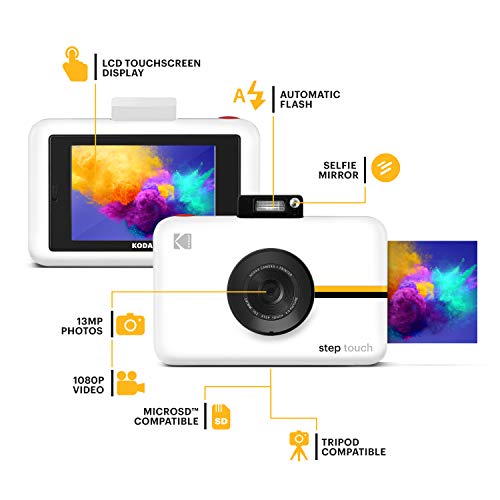
13 MP
This camera captures images at 13 MP, which is lower than 82.5% of cameras and equal to 0.1% of cameras.
Sensor pixel size
1.47 µm
This camera has sensor pixels measuring 1.47 µm, which are smaller than those in 65.2% of cameras.
Base ISO
100
This camera has a base ISO of 100, which is lower than 26.7% of cameras and equal to 53.4% of cameras.
Max ISO
ISO 25600 ISO
This camera reaches ISO 25,600, which is higher than 75.3% of cameras and equal to 12.3% of cameras.
Show more
Lens mount
N/A
Built-in focus motor
N/A
N. of focus points
?
Phase-detection autofocus (photos)
no
This camera does not support phase-detection autofocus for photos. 36.6% of cameras support phase-detection autofocus for photos.
AF tracking
?
Show more
Max video resolution
1920 px
This camera records at 1920 px, which is higher than the resolution in 28.7% of cameras and the same as in 46.7% of cameras.
Video bitrate
?
Video bit depth
8 bit
This camera records in 8 bit, which is higher than the colour depth in 8.2% of cameras and the same as in 79.8% of cameras.
Video chroma subsampling
4:2:0
This camera records with 4:2:0, which is better than the chroma sampling in 8.2% of cameras and the same as in 70% of cameras.
Video codecs
H.264
Show more
Type
instant
Weight
100 g
This camera weighs 100 g, which is lighter than 99.1% of cameras and equal to 0.2% of cameras.
Width
?
Height
?
Thickness
?
Show more
Battery life (CIPA)
?
Battery capacity
?
Removable battery
no
This camera lacks a removable battery, while 97.9% of cameras include one.
USB Power Delivery (PD)
no
This camera does not support USB Power Delivery. 10.6% of cameras support USB Power Delivery.
Wi-Fi connectivity
yes
This camera supports Wi-Fi. This feature is available on 48.1% of cameras.
Wi-Fi version
?
Bluetooth connectivity
yes
This camera has Bluetooth. 24% of cameras support Bluetooth.
Bluetooth version
N/A
USB Type-C
no
This camera does not include USB Type-C. 16.4% of cameras use USB-C.
Show more

Kodak Step Touch vs the average camera

246810TotalDisplay & DesignSensor & ImagePhoto FeaturesVideo & AudioBattery & PowerConnectivity & Storage
  • 19,200 ISO higher maximum sensitivity
    This camera reaches a higher maximum ISO than the average camera (25,600 ISO vs 6,400 ISO). The average camera's maximum ISO is 6,400 ISO.
    25,600 ISO vs 6,400 ISO
  • More advanced viewfinder
    This camera has a more advanced viewfinder than the average camera (electronic vs none).
    electronic vs none
  • 289.5 g lighter
    This camera is lighter than the average camera (100 g vs 389.5 g). The average camera weighs 389.5 g.
    100 g vs 389.5 g
  • 0.5 in larger screen
    This camera has a larger screen than the average camera (3.5 in vs 3 in). The average camera has a screen of 3 in.
    3.5 in vs 3 in
  • Has a touchscreen
    This camera has a touchscreen, the average camera does not. 36.7% of cameras support touchscreen input.
  • Has Bluetooth
    This camera supports Bluetooth, the average camera does not. 24.1% of cameras support Bluetooth.
  • Supports Wi-Fi connectivity
    This camera supports Wi-Fi, the average camera does not. 48.1% of cameras support Wi-Fi.
  • 6 years newer
    This camera was released more recently than the average camera (2020 vs 2014). The average camera was released in 2014.
    2,020 vs 2,014
  • More advanced viewfinder
    This camera has a more advanced viewfinder than the average camera (electronic vs none).
    electronic vs none
  • 289.5 g lighter
    This camera is lighter than the average camera (100 g vs 389.5 g). The average camera weighs 389.5 g.
    100 g vs 389.5 g
  • 0.5 in larger screen
    This camera has a larger screen than the average camera (3.5 in vs 3 in). The average camera has a screen of 3 in.
    3.5 in vs 3 in
  • Has a touchscreen
    This camera has a touchscreen, the average camera does not. 36.7% of cameras support touchscreen input.
  • 19,200 ISO higher maximum sensitivity
    This camera reaches a higher maximum ISO than the average camera (25,600 ISO vs 6,400 ISO). The average camera's maximum ISO is 6,400 ISO.
    25,600 ISO vs 6,400 ISO
  • 6 years newer
    This camera was released more recently than the average camera (2020 vs 2014). The average camera was released in 2014.
    2,020 vs 2,014
  • Supports touch autofocus
    This camera supports touch autofocus, the average camera does not. 34.6% of cameras support touch autofocus.
  • Has Bluetooth
    This camera supports Bluetooth, the average camera does not. 24.1% of cameras support Bluetooth.
  • Supports Wi-Fi connectivity
    This camera supports Wi-Fi, the average camera does not. 48.1% of cameras support Wi-Fi.
  • Smaller image sensor
    This camera has a smaller sensor than the average camera (1/2.3" vs 2/3"). The average camera's sensor size is 2/3".
    1/2.3" vs 2/3"
  • 26.2% lower review score
    Reviews score
    4.8/ 10
    ✕
    What it is
    Average grade from independent test sites, magazines and video reviewers, 1–10.
    How we count it
    Grades: Each review's own score is converted to 1–10; without one, we grade the review ourselves. Big test sites count more, short reviews half as much as full tests. A video review counts half.
    Score: The average grade is 80% of the review mark; the number of reviews is the other 20% (1 review = 5, the typical number in this category = 8, the most-reviewed model = 10).
    Enough data: With few reviews, the average grade is pulled toward the typical grade of this category. No reviews yet: 7.5 for now.
    Share: Reviews count 25% of the overall score.
    Score distribution
    â–¼
    <55-66-77-88-99-10

    4.8

    Mark 7.2 is below the typical mark 7.9 of this category, so it cannot lift the score above the technical score

    80%

    7.7

    Average grade

    20%

    5.0

    Popularity

    Grades by review (1)
    1 review, with a printed score. Reviews count 25% of the overall score.
    User ratings collected online are not part of this score.
    4.8 vs 6.5
  • Lacks HDR mode
    This camera does not support HDR mode, the average camera does. 55% of cameras include HDR mode.
  • Fewer megapixels
    This camera has fewer megapixels than the average camera (13 MP vs 16.2 MP). The average camera's sensor resolution is 16.2 MP.
    13 MP vs 16.2 MP
  • No hot shoe
    This camera does not have a hot shoe, the average camera does.
  • No continuous video AF
    This camera does not support continuous autofocus in video, the average camera does.
  • 1 fewer microphones
    This camera has fewer microphones than the average camera (1 vs 2). The average camera has a microphone count of 2.
    1 vs 2
  • 1.57 µm smaller sensor pixels
    This camera has smaller sensor pixels than the average camera (1.5 µm vs 3.04 µm). The average sensor pixel size is 3.04 µm.
    1.47 µm vs 3.04 µm
  • 26.2% lower review score
    Reviews score
    4.8/ 10
    ✕
    What it is
    Average grade from independent test sites, magazines and video reviewers, 1–10.
    How we count it
    Grades: Each review's own score is converted to 1–10; without one, we grade the review ourselves. Big test sites count more, short reviews half as much as full tests. A video review counts half.
    Score: The average grade is 80% of the review mark; the number of reviews is the other 20% (1 review = 5, the typical number in this category = 8, the most-reviewed model = 10).
    Enough data: With few reviews, the average grade is pulled toward the typical grade of this category. No reviews yet: 7.5 for now.
    Share: Reviews count 25% of the overall score.
    Score distribution
    â–¼
    <55-66-77-88-99-10

    4.8

    Mark 7.2 is below the typical mark 7.9 of this category, so it cannot lift the score above the technical score

    80%

    7.7

    Average grade

    20%

    5.0

    Popularity

    Grades by review (1)
    1 review, with a printed score. Reviews count 25% of the overall score.
    User ratings collected online are not part of this score.
    4.8 vs 6.5
  • No hot shoe
    This camera does not have a hot shoe, the average camera does.
  • Smaller image sensor
    This camera has a smaller sensor than the average camera (1/2.3" vs 2/3"). The average camera's sensor size is 2/3".
    1/2.3" vs 2/3"
  • Lacks HDR mode
    This camera does not support HDR mode, the average camera does. 55% of cameras include HDR mode.
  • Fewer megapixels
    This camera has fewer megapixels than the average camera (13 MP vs 16.2 MP). The average camera's sensor resolution is 16.2 MP.
    13 MP vs 16.2 MP
  • 1.57 µm smaller sensor pixels
    This camera has smaller sensor pixels than the average camera (1.5 µm vs 3.04 µm). The average sensor pixel size is 3.04 µm.
    1.47 µm vs 3.04 µm
  • No RAW photo capture
    This camera does not support RAW photo capture, the average camera does. 61% of cameras support RAW formats.
  • No manual focus mode
    This camera does not support manual focus, the average camera does. 71.4% of cameras include a manual focus mode.
  • No manual exposure control
    This camera does not support manual exposure, the average camera does. 71.5% of cameras support manual exposure controls.
  • 27 fps slower electronic shooting
    This camera shoots slower than the average camera (3 fps vs 30 fps). The average camera shoots at 30 fps.
    3 fps vs 30 fps
  • 84.6% less optical zoom
    This camera offers less optical zoom than the average camera (1 x vs 6.5 x). The average camera offers 6.5 x.
    1 x vs 6.5 x
  • 15 s shorter exposure
    This camera allows shorter exposures than the average camera (15 s vs 30 s). The average camera allows exposures up to 30 s.
    15 s vs 30 s
  • No continuous video AF
    This camera does not support continuous autofocus in video, the average camera does.
  • 1 fewer microphones
    This camera has fewer microphones than the average camera (1 vs 2). The average camera has a microphone count of 2.
    1 vs 2
  • No removable battery
    This camera does not have a removable battery, while the average camera does.
  • No HDMI output
    This camera does not support HDMI output, the average camera does. 77.7% of cameras support HDMI output.

Video reviews

Hands-on testing, unboxing, and real-world video evaluations

Hands-on video, no verdict

Expert reviews

In-depth analysis and verdict from leading tech publications

6.0
digitalcameraworld.com
✓ explicit
20/03/2023
Hands-on test · Instant print camera
Verdict
The Kodak Step Touch suits families who want a pocketable instant printer with a screen to preview shots, though its prints look washed out.

Third-party reviews

What customers like about Kodak Step Touch

  • At 100 g it slips into a jacket pocket.
  • The 3.5 in touchscreen makes setting focus quick.
  • Each shot prints on the spot.
  • Bluetooth connectivity is built in.
  • Touch autofocus lets you choose the focus point.
  • Flash is built in for dim indoor shots.

What customers don't like about Kodak Step Touch

  • The optical zoom is fixed at 1 x.
  • Continuous shooting runs at only 3 fps.
  • Manual exposure is missing.
  • The battery cannot be removed or swapped.
  • The waterproof rating is 0 m, so keep it dry.

Verdict

At 100 g, the Kodak Step Touch is easy to carry all day in a jacket pocket. It is an instant camera with a 3.5 in touchscreen, so you tap to set focus rather than hunting for buttons. Each shot can be printed on the spot, and Bluetooth is built in for a quick link to a phone. Touch autofocus lets you pick the point to sharpen. The trade-offs show up when you try to do more. The lens is fixed at 1 x, continuous shooting runs at 3 fps, and manual exposure is missing. The battery cannot be swapped either. It suits someone who wants a light, quick print camera for trips and gatherings, and who does not mind giving up control over exposure.

Compare Kodak Step Touch with other products in the Cameras category

1Product to compare no. 1
VS
2Product to compare no. 2
VS
3Product to compare no. 3 (optional)

Graphic comparison of Kodak Step Touch and other products in the Cameras category

No results found