Scored using Graphics cards Methodology v3.0
Graphics cards Methodology v3.0
Mathematical & Unbiased Scoring
Products in this category are scored under Frontum Graphics cards Methodology v3.0: the technical score from the specifications is the base, and independent expert and video reviews (up to ±0.5 points), owner opinions (up to ±0.3) and best-of lists (up to +0.3) move it up or down.
Explore Graphics cards Methodology v3.0

MSI GeForce RTX 3080 Ti Suprim review: 117 specs compared

Avg. price:~£870VRAM:12 GBMemory bus width:384 bitThermal Design Power (TDP):400 W

MSI GeForce RTX 3080 Ti Suprim Review: Compare 117 technical specifications and 6 expert and video reviews to see how this product ranks in the Graphics cards category and whether it is worth buying.
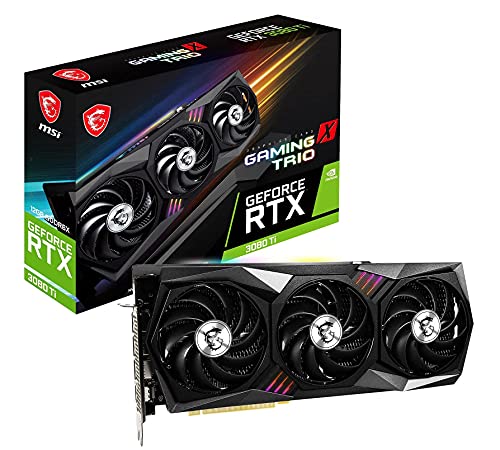
MSI GeForce RTX 3080 Ti Suprim
7.8/10

Overall score

Score
7.8/ 10
✕
What it is
Our main score for this model, 1–10. It combines specs, expert reviews, best-of lists and owners.
How we count it
Parts: Technical score 40%, Reviews score 25%, List score 25%, Sentiment score 10%
Marks: Each part gets a mark out of 10. For reviews, lists and owners, a typical model in this category gets about 8 and the best one gets 10.
No data yet: A part with no data shows "?". It counts as the mark of a weaker model in this category (4 in 5 models with data score higher). This way, models with reviews, lists and owners usually come out ahead.
Score distribution
▼
<55-66-77-88-99-10
Score components

40%

7.9

Technical score

25%

8.1

Reviews score

25%

?

List scoreNot enough data yet, so we use 7.5, the mark of a weaker model in this category

10%

7.7

Sentiment score

▲Better than 65% of graphics cards
7.3

Value for money

Value for money
7.3/ 10
✕
What it is
An indicator that combines the graphics card's overall rating with its cost.
When it matters
When you are looking for a graphics card that offers a strong balance of performance, features, and price.
Score distribution
▼
<55-66-77-88-99-10
Score components

70%

7.8

Overall score

30%

5.9

Price

▼Worse than 62%
7.9

Technical score

Technical score
7.9/ 10
✕
What it is
How good the specs are compared with the other models in this category, 1–10.
How we count it
Areas: We rate the specs in each area against the other models in this category.
Weighting: The areas that matter most to buyers count more. The shares are shown under Score components.
Share: The technical score is 40% of the overall score.
Score distribution
▼
<55-66-77-88-99-10
Score components

44%

8.0

Performance

24%

7.7

Memory

12%

7.4

Power

11%

9.2

Features

5%

5.5

Design

4%

9.2

Connectivity

▲Better than 67%
8.1

Reviews score

Reviews score
8.1/ 10
✕
What it is
Average grade from independent test sites, magazines and video reviewers, 1–10.
How we count it
Grades: Each review's own score is converted to 1–10; without one, we grade the review ourselves. Big test sites count more, short reviews half as much as full tests. A video review counts half.
Score: The average grade is 80% of the review mark; the number of reviews is the other 20% (1 review = 5, the typical number in this category = 8, the most-reviewed model = 10).
Enough data: With few reviews, the average grade is pulled toward the typical grade of this category. No reviews yet: 7.6 for now.
Share: Reviews count 25% of the overall score.
Score distribution
▼
<55-66-77-88-99-10

80%

8.0

Average grade

20%

8.3

Popularity

Grades by review (6)
2 reviews: 1 with a printed score, 1 estimated from the review. 4 video reviews, each counting half as much as a written test. Reviews count 25% of the overall score.
User ratings collected online are not part of this score.
▲Better than 60%
?

List score

List score
7.5/ 10
✕
What it is
How often independent test sites, magazines and video reviewers put this model in their best-of lists for this category.
How we count it
Points: The model in the most lists of this category gets 10; the others get 8 to 10 in proportion. In no list yet: 7.5. Lists count 25% of the overall score.
Enough data: Every list counts, even a single one. With fewer than 5 best-of lists in the category, this part is left out.
Lists with this model (0)
Not in any best-of list yet, so this part counts as 7.5. Models in a list get 8 to 10.
Not in any best-of list yet

What reviewers say about the MSI GeForce RTX 3080 Ti Suprim

Based on 2 · 4

Reviewers love the strong gaming performance, cool temperatures and sleek design, but most complain about high power draw.
Praised
Criticised
Pick a topic to see who said what

What owners say about the MSI GeForce RTX 3080 Ti Suprim

Based on 211 owners sharing their experience in online comments

56%positive18%mixed26%negative

Owners praise its strong gaming speed, though high power use and heat remain the biggest drawbacks.

What owners dislike

  • Owners say it runs hot, with hotspot and memory temperatures often reaching 85 to 93 C without repasting or undervolting.7
  • Owners say it draws a lot of power, often 350 to 450 watts stock, and may need a larger power supply.6
  • Owners say memory temperatures often run high, reaching 85 to 90 C or more on some cards, especially without new thermal pads.4
  • Owners say some games fail to hold a stable 60 fps, particularly with ray tracing and DLSS on ultrawide or 4K.3

Points mentioned by at least 3 owners, most mentioned first.

Loading...
Loading category ranking...

Technical Specifications of graphics card MSI GeForce RTX 3080 Ti Suprim

Technical score
Technical score
7.9/ 10
✕
What it is
How good the specs are compared with the other models in this category, 1–10.
How we count it
Areas: We rate the specs in each area against the other models in this category.
Weighting: The areas that matter most to buyers count more. The shares are shown under Score components.
Share: The technical score is 40% of the overall score.
Score distribution
▼
<55-66-77-88-99-10
Score components:

44%

8.0

Performance

24%

7.7

Memory

12%

7.4

Power

11%

9.2

Features

5%

5.5

Design

4%

9.2

Connectivity

7.9
Reviews score
8.1
List score
?
Value for money
Value for money
7.3/ 10
✕
What it is
An indicator that combines the graphics card's overall rating with its cost.
When it matters
When you are looking for a graphics card that offers a strong balance of performance, features, and price.
Score distribution
▼
<55-66-77-88-99-10
Score components:

70%

7.8

Overall score

30%

5.9

Price

7.3
3DMark Time Spy benchmark score
19,636 points
This graphics card scores 19,636 points in 3DMark Time Spy, which is higher than 64.2% of graphics cards and equal to 0.1% of graphics cards.
3DMark Port Royal score
14,600 points
This graphics card scores 14,600 points in 3DMark Port Royal, which is higher than 70.2% of graphics cards.
PassMark (G3D) result
26,784 points
This graphics card scores 26,784 points in PassMark G3D, which is higher than 61.1% of graphics cards and equal to 0.4% of graphics cards.
PassMark (DirectCompute) result
15,007 points
This graphics card scores 15,007 points in PassMark DirectCompute, which is higher than 61.1% of graphics cards and equal to 0.1% of graphics cards.
FP32 performance
37.48 TFLOPS
This graphics card delivers 37.48 TFLOPS FP32 performance, which is higher than that of 70.5% of graphics cards and equal to that of 0.1% of graphics cards.
Show more
What reviewers say
VRAM
12 GB
This graphics card has 12 GB of VRAM, which is more than 46% of graphics cards and equal to 16% of graphics cards.
Memory type
GDDR6X
This graphics card uses GDDR6X memory, which is newer than on 57.1% of graphics cards and equal to 22.4% of graphics cards.
Memory bus width
384 bit
This graphics card uses a 384 bit memory bus, which is wider than that of 89.7% of graphics cards and equal to that of 7% of graphics cards.
Maximum memory bandwidth
912.4 GB/s
This graphics card reaches 912.4 GB/s memory bandwidth, which is higher than that of 87.4% of graphics cards and equal to that of 0.3% of graphics cards.
Effective memory speed
19,000 MHz
This graphics card reaches an effective memory speed of 19,000 MHz, which is faster than that of 48.5% of graphics cards and equal to that of 3.2% of graphics cards.
Show more
PCI Express (PCIe) version
4
This graphics card supports PCIe 4, which is newer than on 22.5% of graphics cards and equal to 50.5% of graphics cards.
PCIe lanes
x16
This graphics card uses x16 PCIe lanes, which is more than 24.1% of graphics cards and equal to 75.9% of graphics cards.
DirectX version
12 Ultimate
This graphics card supports DirectX 12 Ultimate, which is more advanced than on 22.8% of graphics cards and equal to 77.2% of graphics cards.
Vulkan version
1.4
This graphics card supports Vulkan 1.4, which is more advanced than on 20.8% of graphics cards and equal to 79.2% of graphics cards.
OpenGL version
4.6
This graphics card supports OpenGL 4.6, which is more advanced than on 2% of graphics cards and equal to 98% of graphics cards.
Show more
Max displays supported
4
This graphics card supports up to 4 displays, which is more than 9% of graphics cards and equal to 88.2% of graphics cards.
Max digital resolution
7680x4320
This graphics card supports a maximum digital resolution of 7680x4320, which is higher than that of 9.2% of graphics cards and equal to that of 90.9% of graphics cards.
DisplayPort outputs
3
This graphics card offers 3 DisplayPort outputs, which is more than 21.7% of graphics cards and equal to 76% of graphics cards.
DisplayPort version
1.4a
This graphics card supports DisplayPort 1.4a, which is more advanced than on 19.3% of graphics cards and equal to 46.3% of graphics cards.
DisplayPort link rates
32.4 Gbps
This graphics card supports DisplayPort link rates up to 32.4 Gbps, which is faster than on 56.6% of graphics cards and equal to 20.9% of graphics cards.
Show more
Thermal Design Power (TDP)
400 W
This graphics card has a TDP of 400 W, which is higher than that of 93.9% of graphics cards and equal to that of 0.2% of graphics cards.
Power consumption while under peak load
400 W
This graphics card draws 400 W under peak load, which is higher than 91.8% of graphics cards and equal to 0.9% of graphics cards.
Recommended PSU wattage
850 W
This graphics card recommends a 850 W PSU, which is higher than that of 83.6% of graphics cards and equal to that of 11.9% of graphics cards.
Board power limit
400 W
This graphics card has a board power limit of 400 W, which is higher than that of 90.1% of graphics cards and equal to that of 1.2% of graphics cards.
PCIe power spec
400 W
Show more
What reviewers say
Size
336x 140x 61 mm
Length
336 mm
This graphics card is 336 mm long, which is longer than 88.1% of graphics cards and equal in length to 1.9% of graphics cards.
Height
140 mm
This graphics card is 140 mm tall, which is taller than 79.5% of graphics cards and equal in height to 5.4% of graphics cards.
Slot width
3 slot/s
This graphics card occupies 3 slot/s, which is wider than 70.7% of graphics cards and equal in width to 16.8% of graphics cards.
Weight
1905 g
This graphics card weighs 1905 g, which is heavier than 87.2% of Graphics cards and equal to 0.1% of Graphics cards.
Show more
What reviewers say

MSI GeForce RTX 3080 Ti Suprim vs the average graphics card

246810TotalPerformanceMemoryFeaturesConnectivityPowerDesign
  • 40 more compute units
    This graphics card has more compute units than the average graphics card (80 vs 40). The average graphics card has 40 compute units.
    80 vs 40
  • 192 bit wider memory bus
    This graphics card has a wider memory bus than the average graphics card (384 bit vs 192 bit). The average graphics card has a memory bus width of 192 bit.
    384 bit vs 192 bit
  • 40 more ray tracing cores
    This graphics card has more ray tracing cores than the average graphics card (80 vs 40). The average graphics card has 40 ray tracing cores.
    80 vs 40
  • 2.04x higher memory bandwidth
    This graphics card has a higher memory bandwidth than the average graphics card (912.4 GB/s vs 448 GB/s). The average graphics card has a memory bandwidth of 448 GB/s.
    912.4 GB/s vs 448 GB/s
  • 48 more ROPs
    This graphics card has more ROPs than the average graphics card (112 vs 64). The average graphics card has 64 ROPs.
    112 vs 64
  • 136 more TMUs
    This graphics card has more TMUs than the average graphics card (320 vs 184). The average graphics card has 184 TMUs.
    320 vs 184
  • 176 more AI cores
    This graphics card has more AI cores than the average graphics card (320 vs 144). The average graphics card has 144 AI cores.
    320 vs 144
  • 65.8% higher FP32 performance
    This graphics card has a higher FP32 performance than the average graphics card (37.5 TFLOPS vs 22.6 TFLOPS). The average graphics card has FP32 performance of 22.6 TFLOPS.
    37.48 TFLOPS vs 22.6 TFLOPS
  • 12.5% higher review score
    Reviews score
    8.1/ 10
    ✕
    What it is
    Average grade from independent test sites, magazines and video reviewers, 1–10.
    How we count it
    Grades: Each review's own score is converted to 1–10; without one, we grade the review ourselves. Big test sites count more, short reviews half as much as full tests. A video review counts half.
    Score: The average grade is 80% of the review mark; the number of reviews is the other 20% (1 review = 5, the typical number in this category = 8, the most-reviewed model = 10).
    Enough data: With few reviews, the average grade is pulled toward the typical grade of this category. No reviews yet: 7.6 for now.
    Share: Reviews count 25% of the overall score.
    Score distribution
    ▼
    <55-66-77-88-99-10

    80%

    8.0

    Average grade

    20%

    8.3

    Popularity

    Grades by review (6)
    2 reviews: 1 with a printed score, 1 estimated from the review. 4 video reviews, each counting half as much as a written test. Reviews count 25% of the overall score.
    User ratings collected online are not part of this score.
    8.1 vs 7.2
  • 40 more compute units
    This graphics card has more compute units than the average graphics card (80 vs 40). The average graphics card has 40 compute units.
    80 vs 40
  • 40 more ray tracing cores
    This graphics card has more ray tracing cores than the average graphics card (80 vs 40). The average graphics card has 40 ray tracing cores.
    80 vs 40
  • 48 more ROPs
    This graphics card has more ROPs than the average graphics card (112 vs 64). The average graphics card has 64 ROPs.
    112 vs 64
  • 136 more TMUs
    This graphics card has more TMUs than the average graphics card (320 vs 184). The average graphics card has 184 TMUs.
    320 vs 184
  • 176 more AI cores
    This graphics card has more AI cores than the average graphics card (320 vs 144). The average graphics card has 144 AI cores.
    320 vs 144
  • 65.8% higher FP32 performance
    This graphics card has a higher FP32 performance than the average graphics card (37.5 TFLOPS vs 22.6 TFLOPS). The average graphics card has FP32 performance of 22.6 TFLOPS.
    37.48 TFLOPS vs 22.6 TFLOPS
  • 41% higher texture rate
    This graphics card has a higher texture rate than the average graphics card (532.8 GTexel/s vs 378 GTexel/s). The average graphics card has a texture rate of 378 GTexel/s.
    532.8 GTexel/s vs 378 GTexel/s
  • 27.1% higher pixel rate
    This graphics card has a higher pixel rate than the average graphics card (205 GPixel/s vs 161.3 GPixel/s). The average graphics card has a pixel rate of 161.3 GPixel/s.
    205 GPixel/s vs 161.3 GPixel/s
  • 59.6% higher ray tracing score
    This graphics card has a higher ray tracing score than the average graphics card (14,600 points vs 9,148 points). The average graphics card has a ray tracing score of 9,148 points.
    14,600 points vs 9,148 points
  • 4.61x higher FP16 performance
    This graphics card has a higher FP16 performance than the average graphics card (136 TFLOPS vs 29.5 TFLOPS). The average graphics card has FP16 performance of 29.5 TFLOPS.
    136 TFLOPS vs 29.5 TFLOPS
  • 4.15x higher BF16 performance
    This graphics card has a higher BF16 performance than the average graphics card (147.2 TFLOPS vs 35.48 TFLOPS). The average graphics card has BF16 performance of 35.48 TFLOPS.
    147.16 TFLOPS vs 35.48 TFLOPS
  • 5,888 more FP32 units
    This graphics card has more FP32 units than the average graphics card (10,240 vs 4,352). The average graphics card has 4,352 FP32 units.
    10,240 vs 4,352
  • 192 bit wider memory bus
    This graphics card has a wider memory bus than the average graphics card (384 bit vs 192 bit). The average graphics card has a memory bus width of 192 bit.
    384 bit vs 192 bit
  • 2.04x higher memory bandwidth
    This graphics card has a higher memory bandwidth than the average graphics card (912.4 GB/s vs 448 GB/s). The average graphics card has a memory bandwidth of 448 GB/s.
    912.4 GB/s vs 448 GB/s
  • Supports LHR limiting
    This graphics card supports an LHR limiter, while the average graphics card does not. 7.5% of Graphics cards support one.
  • 29.3% lower boost clock speed
    This graphics card has a lower boost GPU clock than the average graphics card (1,770 MHz vs 2,505 MHz). The average graphics card has a boost GPU clock of 2,505 MHz.
    1,770 MHz vs 2,505 MHz
  • Less advanced frame generation
    This graphics card has less advanced frame generation than the average graphics card (no vs multi frame generation).
  • 28.9% lower base clock speed
    This graphics card has a lower base GPU clock than the average graphics card (1,365 MHz vs 1920 MHz). The average graphics card has a base GPU clock of 1920 MHz.
    1,365 MHz vs 1,920 MHz
  • 86% higher TDP
    This graphics card has a higher TDP than the average graphics card (400 W vs 215 W). The average graphics card has a TDP of 215 W.
    400 W vs 215 W
  • 60% larger process node
    This graphics card uses a larger manufacturing process than the average graphics card (8 nm vs 5 nm). The average graphics card uses a manufacturing process of 5 nm.
    8 nm vs 5 nm
  • No AV1 encoding
    This graphics card does not support AV1 encoding, the average graphics card does.
  • 30.8% higher PSU requirement
    This graphics card has a higher PSU requirement than the average graphics card (850 W vs 650 W). The average graphics card has a PSU requirement of 650 W.
    850 W vs 650 W
  • 53.8 mm longer card length
    This graphics card is longer than the average graphics card (336 mm vs 282.2 mm). The average graphics card has a length of 282.2 mm.
    336 mm vs 282.2 mm
  • 67.3% more expensive
    MSI GeForce RTX 3080 Ti Suprim is more expensive than the average graphics card (£870 vs £520).
    £870 vs £520
  • 29.3% lower boost clock speed
    This graphics card has a lower boost GPU clock than the average graphics card (1,770 MHz vs 2,505 MHz). The average graphics card has a boost GPU clock of 2,505 MHz.
    1,770 MHz vs 2,505 MHz
  • 28.9% lower base clock speed
    This graphics card has a lower base GPU clock than the average graphics card (1,365 MHz vs 1920 MHz). The average graphics card has a base GPU clock of 1920 MHz.
    1,365 MHz vs 1,920 MHz
  • 2 years older
    This graphics card was released earlier than the average graphics card (2021 vs 2023).
    June 2021
    2021 vs 2023
  • 32.1% slower VRAM clock
    This graphics card has a lower VRAM clock than the average graphics card (1,188 MHz vs 1,750 MHz). The average graphics card runs its VRAM at 1,750 MHz.
    1,188 MHz vs 1,750 MHz
  • 75% smaller L2 cache
    This graphics card has fewer L2 cache than the average graphics card (6 MB vs 24 MB). The average graphics card has 24 MB L2 cache.
    6 MB vs 24 MB
  • Less advanced frame generation
    This graphics card has less advanced frame generation than the average graphics card (no vs multi frame generation).
  • 60% larger process node
    This graphics card uses a larger manufacturing process than the average graphics card (8 nm vs 5 nm). The average graphics card uses a manufacturing process of 5 nm.
    8 nm vs 5 nm
  • 2.14x larger GPU die
    This graphics card has a higher GPU die size than the average graphics card (628 mm² vs 294 mm²). The average graphics card has a GPU die size of 294 mm².
    628 mm² vs 294 mm²
  • No AV1 encoding
    This graphics card does not support AV1 encoding, the average graphics card does.
  • Older HDMI version
    This graphics card supports an older HDMI version than the average graphics card (2.1 vs 2.1a).
    2.1 vs 2.1a
  • Older NVDEC generation
    This graphics card has a lower NVDEC generation than the average graphics card (5 vs 6). The average graphics card offers NVDEC generation 6.
    5 vs 6
  • 86% higher TDP
    This graphics card has a higher TDP than the average graphics card (400 W vs 215 W). The average graphics card has a TDP of 215 W.
    400 W vs 215 W
  • 30.8% higher PSU requirement
    This graphics card has a higher PSU requirement than the average graphics card (850 W vs 650 W). The average graphics card has a PSU requirement of 650 W.
    850 W vs 650 W
  • 81.8% higher board power limit
    This graphics card has a higher board power limit than the average graphics card (400 W vs 220 W). The average graphics card has a board power limit of 220 W.
    400 W vs 220 W
  • 81.8% higher peak power draw
    This graphics card has a higher peak power draw than the average graphics card (400 W vs 220 W). The average graphics card has a peak power draw of 220 W.
    400 W vs 220 W
  • 8 °C higher idle temperature
    This graphics card has a higher idle temperature than the average graphics card (45 °C vs 37 °C). The average graphics card has an idle temperature of 37 °C.
    45 °C vs 37 °C
  • 41.7% higher idle power draw
    This graphics card has a higher idle power draw than the average graphics card (17 W vs 12 W). The average graphics card has an idle power draw of 12 W.
    17 W vs 12 W
  • 53.8 mm longer card length
    This graphics card is longer than the average graphics card (336 mm vs 282.2 mm). The average graphics card has a length of 282.2 mm.
    336 mm vs 282.2 mm
  • 15 mm higher card profile
    This graphics card is taller than the average graphics card (140 mm vs 125 mm). The average graphics card has a height of 125 mm.
    140 mm vs 125 mm
  • 0.5 slot/s wider design
    This graphics card occupies more slots than the average graphics card (3 slot/s vs 2.5 slot/s). The average graphics card occupies 2.5 slot/s.
    3 slot/s vs 2.5 slot/s
  • 87.9% heavier
    This graphics card is heavier than the average graphics card (1905 g vs 1,014 g). The average graphics card weighs 1,014 g.
    1,905 g vs 1,014 g

Video reviews

Hands-on testing, unboxing, and real-world video evaluations

7.0
WootDini Tech & Tutorials
≈ estimated
29/09/2021
Hands-on review · benchmarks and game performance tests
Verdict
The MSI GeForce RTX 3080 Ti Suprim is only a good choice if you can't get a 3090 or 3080, since the 3080 is better value.
8.0
TechReflex
≈ estimated
04/07/2021
Hands-on review · undervolting, temperatures and acoustics
Verdict
The MSI GeForce RTX 3080 Ti Suprim is a solid performer worth recommending, though its high price is the main concern.
8.0
Tech Critter
≈ estimated
02/06/2021
Hands-on review · performance, thermals and design
Verdict
The MSI GeForce RTX 3080 Ti Suprim delivers close to RTX 3090 performance with less VRAM, a good cheaper option if you can find one.
8.0
Dreamcore Tech
≈ estimated
03/06/2021
First look · unboxing and short performance comparison
Verdict
The MSI GeForce RTX 3080 Ti Suprim is top tier in the RTX 3080 Ti lineup, with easy overclocking potential.
Not graded
Brand video
Not graded

Expert reviews

In-depth analysis and verdict from leading tech publications
9.0
overclocking.com
≈ estimated
02/06/2021
Lab test · Top-end RTX 3080 Ti
Verdict
The MSI RTX 3080 Ti Suprim X 12G beats the RTX 3090 Founders Edition in most tests, but its size and 400W draw limit it to roomy, well-powered builds.
8.0
clubic.com
✓ explicit
14/06/2021
Lab test · Gaming performance
Verdict
The MSI RTX 3080 Ti Suprim X edges out the RTX 3090 Founders Edition in most games, but its huge size and 400W draw make it a niche pick.

Third-party reviews

What customers like about MSI GeForce RTX 3080 Ti Suprim

  • Elite-tier performance that often rivals or exceeds the RTX 3090 in gaming benchmarks
  • Premium build quality with a high-end metal shroud and machine-cut backplate
  • Excellent thermal management using the Tri Frozr 2S cooling system, keeping temperatures significantly lower than the Founders Edition
  • Dual BIOS switch allows users to choose between 'Silent' and 'Gaming' modes for preferred noise levels
  • Quiet operation under load, especially when using the Silent BIOS profile
  • Aesthetically pleasing design with high-quality, customisable RGB lighting across three zones
  • Includes useful accessories in the box, such as a premium mouse mat and a dedicated anti-sag support bracket

What customers don't like about MSI GeForce RTX 3080 Ti Suprim

  • Extremely high power consumption, often drawing up to 400W–450W under heavy load or overclocking
  • Requires a high-wattage power supply (at least 750W–850W recommended) and three 8-pin PCIe power connectors
  • Massive physical dimensions (over 33cm long) that may not fit in many standard mid-tower cases
  • Poor value for money compared to the base RTX 3080, offering only marginal performance gains for a much higher price
  • Frequent reports of 'coil whine' (electric buzzing), especially at high frame rates
  • MSI's Dragon Center/MSI Center software for RGB control is often described as bloated or difficult to use

Verdict

The MSI GeForce RTX 3080 Ti Suprim X is a high-end graphics card powered by the NVIDIA Ampere architecture, featuring 10,240 CUDA cores and 12GB of ultra-fast GDDR6X memory on a 384-bit bus. It distinguishes itself with a factory-overclocked boost clock of 1,845 MHz in Extreme Mode and a robust Tri Frozr 2S cooling system that utilizes three Torx 4.0 fans and core pipes for efficient heat dissipation. Main pros include its premium build quality with a brushed aluminum shroud, a versatile dual BIOS for switching between 'Gaming' and 'Silent' modes, and performance that closely rivals the flagship RTX 3090 in gaming tasks. However, notable cons include its massive 336mm physical footprint that requires significant case space, a high power consumption rated at 400W necessitating at least an 850W power supply, and a price point that often carries a significant premium over standard models.

Compare MSI GeForce RTX 3080 Ti Suprim with other products in the Graphics cards category

1Product to compare no. 1
VS
2Product to compare no. 2
VS
3Product to compare no. 3 (optional)

Graphic comparison of MSI GeForce RTX 3080 Ti Suprim and other products in the Graphics cards category

No results found