Scored using Tablets Methodology v3.0
Tablets Methodology v3.0
Mathematical & Unbiased Scoring
Products in this category are scored under Frontum Tablets Methodology v3.0: the technical score from the specifications is the base, and independent expert and video reviews (up to ±0.5 points), owner opinions (up to ±0.3) and best-of lists (up to +0.3) move it up or down.
Explore Tablets Methodology v3.0

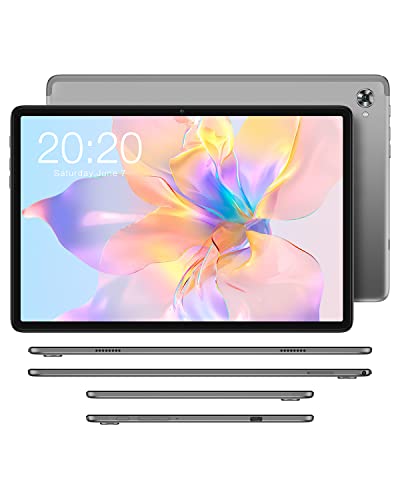
Teclast P40HD 4G (4GB + 64GB) review: 168 specs compared

Avg. price:~£60RAM capacity:4 GBInternal storage:64 GBScreen size:10.1 inchesChipset:Unisoc T606

Teclast P40HD 4G (4GB + 64GB) Review: Compare 168 technical specifications and 6 expert and video reviews to see how this product ranks in the Tablets category and whether it is worth buying.

Teclast P40HD 4G (4GB + 64GB)
6.3/10

Overall score

Score
6.3/ 10
✕
What it is
Our main score for this model, 1–10. It combines specs, best-of lists, expert reviews and owners.
How we count it
Parts: Technical score 35%, List score 30%, Reviews score 25%, Sentiment score 10%
Marks: Each part gets a mark out of 10. For reviews, lists and owners, a typical model in this category gets about 8 and the best one gets 10.
No data yet: A part with no data shows "?". It counts as the mark of a weaker model in this category (4 in 5 models with data score higher). This way, models with reviews, lists and owners usually come out ahead.
Score distribution
â–¼
<55-66-77-88-99-10
Score components

35%

5.8

Technical score

30%

?

List scoreNot enough data yet, so we use 7.5, the mark of a weaker model in this category

25%

5.8

Reviews score

10%

5.8

Sentiment score

â–¼Worse than 76% of tablets
7.4

Value for money

Value for money
7.4/ 10
✕
What it is
An indicator that combines the tablet's overall rating with its cost.
When it matters
When you are looking for a tablet with a good balance between quality and price.
Score distribution
â–¼
<55-66-77-88-99-10
Score components

70%

6.3

Overall score

30%

10

Price

â–¼Worse than 62%
5.8

Technical score

Technical score
5.8/ 10
✕
What it is
How good the specs are compared with the other models in this category, 1–10.
How we count it
Areas: We rate the specs in each area against the other models in this category.
Weighting: The areas that matter most to buyers count more. The shares are shown under Score components.
Share: The technical score is 35% of the overall score.
Score distribution
â–¼
<55-66-77-88-99-10
Score components

22%

5.5

Performance

20%

5.4

Display

16%

6.3

Camera

14%

4.3

Battery

12%

7.3

Connectivity

8%

7.0

Software

5%

6.0

Design

3%

5.5

Audio

â–¼Worse than 60%
5.8

Reviews score

Reviews score
5.8/ 10
✕
What it is
Average grade from independent test sites, magazines and video reviewers, 1–10.
How we count it
Grades: Each review's own score is converted to 1–10; without one, we grade the review ourselves. Big test sites count more, short reviews half as much as full tests. A video review counts half.
Score: The average grade is 80% of the review mark; the number of reviews is the other 20% (1 review = 5, the typical number in this category = 8, the most-reviewed model = 10).
Enough data: With few reviews, the average grade is pulled toward the typical grade of this category. No reviews yet: 7.4 for now.
Share: Reviews count 25% of the overall score.
Score distribution
â–¼
<55-66-77-88-99-10

5.8

Mark 7.6 is below the typical mark 7.8 of this category, so it cannot lift the score above the technical score

80%

7.7

Average grade

20%

7.1

Popularity

Grades by review (6)
1 review, its grade estimated from the review text. 5 video reviews, each counting half as much as a written test. Reviews count 25% of the overall score.
User ratings collected online are not part of this score.
â–¼Worse than 72%
?

List score

List score
7.5/ 10
✕
What it is
How often independent test sites, magazines and video reviewers put this model in their best-of lists for this category.
How we count it
Points: The model in the most lists of this category gets 10; the others get 8 to 10 in proportion. In no list yet: 7.5. Lists count 30% of the overall score.
Enough data: Every list counts, even a single one. With fewer than 5 best-of lists in the category, this part is left out.
Lists with this model (0)
Not in any best-of list yet, so this part counts as 7.5. Models in a list get 8 to 10.
Not in any best-of list yet

What reviewers say about the Teclast P40HD 4G (4GB + 64GB)

Based on 1 · 5

Reviewers like the reliable connectivity, decent battery and performance, but dislike the front camera; opinions on the screen are split.
Praised
Mixed views
Criticised
Pick a topic to see who said what

What owners say about the Teclast P40HD 4G (4GB + 64GB)

Based on 23 owners sharing their experience in online comments

35%positive13%mixed52%negative

Owners praise its value and entertainment use, while recurring faults and camera limitations cause the most frustration.

What owners dislike

  • Owners report Wi-Fi that connects but gives no internet, constant reboots after about 10 months, charging failures, and one unit failing after 10 days.5
  • Owners regret buying it and advise established brands such as Xiaomi, Huawei or Honor, or Huawei MatePad 11, instead.5
  • Owners say the camera won't open in its own app and works only inside apps like WhatsApp.3

Points mentioned by at least 3 owners, most mentioned first.

Loading...
Loading category ranking...

Tablets model ranking

Ranked #410 of 1,179 models in Tablets (Overall score)

Technical Specifications of tablet Teclast P40HD 4G (4GB + 64GB)

Technical score
Technical score
5.8/ 10
✕
What it is
How good the specs are compared with the other models in this category, 1–10.
How we count it
Areas: We rate the specs in each area against the other models in this category.
Weighting: The areas that matter most to buyers count more. The shares are shown under Score components.
Share: The technical score is 35% of the overall score.
Score distribution
â–¼
<55-66-77-88-99-10
Score components:

22%

5.5

Performance

20%

5.4

Display

16%

6.3

Camera

14%

4.3

Battery

12%

7.3

Connectivity

8%

7.0

Software

5%

6.0

Design

3%

5.5

Audio

5.8
Reviews score
5.8
List score
?
Value for money
Value for money
7.4/ 10
✕
What it is
An indicator that combines the tablet's overall rating with its cost.
When it matters
When you are looking for a tablet with a good balance between quality and price.
Score distribution
â–¼
<55-66-77-88-99-10
Score components:

70%

6.3

Overall score

30%

10

Price

7.4
RAM capacity
4 GB
This tablet has 4 GB of RAM, which is more than 47.2% of tablets and equal to 17.8% of tablets.
Process node
12 nm
This tablet is built on a 12 nm process, which is smaller than 53.2% of tablets and equal to 13.9% of tablets.
Internal storage
64 GB
This tablet has 64 GB of internal storage, which is more than 39.1% of tablets and equal to 17% of tablets.
Geekbench 6 single-core score
378 points
This tablet scores 378 points in single-core tests, which is lower than 72.8% of tablets and equal to 0.2% of tablets.
Chipset
Unisoc T606
This tablet runs on Unisoc T606, which is less advanced than 60.5% of tablets and equal to 1.8% of tablets.
Show more
What reviewers say
Screen resolution
1920×1200
This tablet has a 1920×1200 screen, which is sharper than 39.1% of tablets and equal to 18.8% of tablets.
Refresh rate
60 Hz
This tablet has a 60 Hz screen, which is smoother than 0.1% of tablets and equal to 73.4% of tablets.
Display type
IPS LCD
This tablet uses a IPS LCD display type. 17% of tablets use this display technology.
Pixel density
224 ppi
This tablet has a pixel density of 224 ppi, which is higher than 50.1% of tablets and equal to 11.5% of tablets.
Display glass type
Corning Gorilla Glass
This tablet protects its screen with Corning Gorilla Glass, which is more durable than 45.4% of tablets and the same as 32.8% of tablets.
Show more
What reviewers say
Optical image stabilization
no
This tablet does not support optical stabilisation. 0.4% of tablets offer this.
Main camera megapixels
5 MP
This tablet has a rear camera with 5 MP resolution, which is lower than 63.7% of tablets and equal to 26% of tablets.
Front camera megapixels
2 MP
This tablet has a front camera with 2 MP resolution, which is lower than 53.8% of tablets and equal to 25.5% of tablets.
Main camera aperture
f/1.8
This tablet has a main camera aperture of f/1.8, which is wider than 85.9% of tablets and equal to 14.1% of tablets.
Optical zoom
1xxx
This tablet has 1xx optical zoom, which is stronger than 18.2% of tablets and equal to 80.9% of tablets.
Show more
What reviewers say
Battery capacity
6,000 mAh
This tablet has 6,000 mAh battery capacity, which is smaller than 54.2% of tablets and equal to 4.2% of tablets.
Charging speed
10 W
This tablet charges at 10 W, which is slower than 60.9% of tablets and equal to 33.3% of tablets.
Battery life
10 hours
This tablet has a battery life of 10 hours, which is longer than that of 39.1% of tablets and equal to that of 20.5% of tablets.
mixed use
Wireless charging
no
This tablet does not support wireless charging. 1.5% of tablets offer this.
Fast charging
no
This tablet does not support fast charging. 56.9% of tablets offer this.
Show more
What reviewers say
LTE support
yes
This tablet has built-in LTE. 57.1% of tablets offer this.
Wi-Fi connectivity
yes
This tablet connects to Wi-Fi. 0.2% of tablets offer this.
GPS
yes
This tablet has built-in GPS. 17.1% of tablets offer this.
5G connectivity
no
This tablet does not support 5G. 8.1% of tablets offer this.
NFC
no
This tablet does not include NFC. 10.8% of tablets offer this.
Show more
What reviewers say
Operating system
Android
This tablet uses the Android operating system, which is more advanced than the one used by 23.2%.
Update support duration
short
This tablet offers short update support, which is shorter than the support period of 52.4% of tablets and equal to that of 47.6% of tablets.
Direct OS updates
no
This tablet does not support direct OS updates. 79.8% of tablets offer this.
On-device AI
no
This tablet does not support on-device AI. 28.3% of tablets support this capability.
App tracking protection
no
This tablet does not support app tracking protection. 28.4% of tablets offer this.
Show more
IP rating
not rated
This tablet's IP rating is not rated, which is less protected than 16.5% of tablets and the same as 83.6% of tablets.
Weight
515 g
This tablet weighs 515 g, which is heavier than 57.6% of tablets and equal to 0.5% of tablets.
Backlit keyboard
no
This tablet does not support a backlit keyboard. 9.7% of tablets support backlit keyboards.
Keyboard accessory
yes
This tablet supports a keyboard accessory. 15.8% of tablets support this option.
Pen latency
N/A
Show more
Number of microphones
?
aptX Adaptive
no
This tablet does not support aptX Adaptive. 6.9% of tablets offer this.
Dolby Atmos support
no
This tablet does not support Dolby Atmos. 31.3% of tablets support Dolby Atmos.
N. of speakers
2
This tablet includes 2 speakers, which is more than in 9.8% of tablets and equal to the number in 60.8% of tablets.
FM radio
no
This tablet does not include an FM radio. 19% of tablets offer this.
Show more

Teclast P40HD 4G (4GB + 64GB) vs the average tablet

246810TotalPerformanceDisplayCameraBatteryConnectivitySoftwareDesignAudio
  • Wider front camera aperture
    This tablet has a wider front camera aperture than the average tablet (f/1.8 vs f/2.2). The average tablet's front camera aperture is f/2.2.
    f/1.8 vs f/2.2
  • Wider main camera aperture
    This tablet has a wider main camera aperture than the average tablet (f/1.8 vs f/2.2). The average tablet's main camera aperture is f/2.2.
    f/1.8 vs f/2.2
  • Supports LTE
    This tablet supports LTE, while the average tablet does not. 42.9% of tablets support LTE.
  • Supports manual shutter speed
    This tablet supports manual shutter speed, while the average tablet does not. 21.8% of tablets support manual shutter speed.
  • More advanced chipset
    This tablet has a more advanced chipset than the average tablet (Unisoc T606 vs MediaTek MT8169A).
    Unisoc T606 vs MediaTek MT8169A
  • More advanced memory type
    This tablet uses more advanced memory than the average tablet (LPDDR4X vs LPDDR3).
    LPDDR4X vs LPDDR3
  • Supports cellular data
    This tablet supports cellular data, while the average tablet does not. 47.4% of tablets offer this.
  • More advanced graphics
    This tablet has more advanced graphics than the average tablet (Mali-G57 vs Mali-G51).
    Mali-G57 vs Mali-G51
  • 4.33x cheaper
    Teclast P40HD 4G (4GB + 64GB) is cheaper than the average tablet (£60 vs £260).
    £60 vs £260
  • More advanced chipset
    This tablet has a more advanced chipset than the average tablet (Unisoc T606 vs MediaTek MT8169A).
    Unisoc T606 vs MediaTek MT8169A
  • More advanced memory type
    This tablet uses more advanced memory than the average tablet (LPDDR4X vs LPDDR3).
    LPDDR4X vs LPDDR3
  • More advanced graphics
    This tablet has more advanced graphics than the average tablet (Mali-G57 vs Mali-G51).
    Mali-G57 vs Mali-G51
  • 14.3% smaller process node
    This tablet has a smaller process node than the average tablet (12 nm vs 14 nm). The average tablet is built on 14 nm.
    12 nm vs 14 nm
  • Wider front camera aperture
    This tablet has a wider front camera aperture than the average tablet (f/1.8 vs f/2.2). The average tablet's front camera aperture is f/2.2.
    f/1.8 vs f/2.2
  • Wider main camera aperture
    This tablet has a wider main camera aperture than the average tablet (f/1.8 vs f/2.2). The average tablet's main camera aperture is f/2.2.
    f/1.8 vs f/2.2
  • Supports manual shutter speed
    This tablet supports manual shutter speed, while the average tablet does not. 21.8% of tablets support manual shutter speed.
  • Built-in camera flash
    This tablet has a camera flash, while the average tablet does not. 45.5% of tablets have one.
  • Supports LTE
    This tablet supports LTE, while the average tablet does not. 42.9% of tablets support LTE.
  • Supports cellular data
    This tablet supports cellular data, while the average tablet does not. 47.4% of tablets offer this.
  • Supports dynamic themes
    This tablet supports dynamic themes, while the average tablet does not. 29.5% of tablets offer this.
  • Supports extra dim mode
    This tablet supports extra dim mode, while the average tablet does not. 35.9% of tablets offer this.
  • Includes clipboard warnings
    This tablet has clipboard warnings, the average tablet does not. 40.3% of tablets include clipboard warnings.
  • 37.8 mm shorter
    This tablet is shorter than the average tablet (162.2 mm vs 200 mm). The average tablet is 200 mm tall.
    162.2 mm vs 200 mm
  • Shorter update support
    This tablet offers shorter update support than the average tablet (short vs medium). The average tablet gets medium of update support.
    short vs medium
  • No fast charging
    This tablet does not support fast charging, while the average tablet does. 56.8% of tablets support fast charging.
  • 3 MP lower front resolution
    This tablet has a lower-resolution front camera than the average tablet (2 MP vs 5 MP). The average tablet has a front camera of 5 MP.
    2 MP vs 5 MP
  • No direct OS updates
    This tablet does not support direct OS updates, while the average tablet does. 79.7% of tablets offer this.
  • No continuous video AF
    This tablet does not support continuous video AF, the average tablet does. 57.7% of tablets support continuous video autofocus.
  • 100 nits lower typical brightness
    This tablet has a lower typical brightness than the average tablet (300 nits vs 400 nits). The average tablet reaches 400 nits typical brightness.
    300 nits vs 400 nits
  • 3 MP lower rear resolution
    This tablet has a lower-resolution rear camera than the average tablet (5 MP vs 8 MP). The average tablet has a rear camera of 8 MP.
    5 MP vs 8 MP
  • 17.1% lower review score
    Reviews score
    5.8/ 10
    ✕
    What it is
    Average grade from independent test sites, magazines and video reviewers, 1–10.
    How we count it
    Grades: Each review's own score is converted to 1–10; without one, we grade the review ourselves. Big test sites count more, short reviews half as much as full tests. A video review counts half.
    Score: The average grade is 80% of the review mark; the number of reviews is the other 20% (1 review = 5, the typical number in this category = 8, the most-reviewed model = 10).
    Enough data: With few reviews, the average grade is pulled toward the typical grade of this category. No reviews yet: 7.4 for now.
    Share: Reviews count 25% of the overall score.
    Score distribution
    â–¼
    <55-66-77-88-99-10

    5.8

    Mark 7.6 is below the typical mark 7.8 of this category, so it cannot lift the score above the technical score

    80%

    7.7

    Average grade

    20%

    7.1

    Popularity

    Grades by review (6)
    1 review, its grade estimated from the review text. 5 video reviews, each counting half as much as a written test. Reviews count 25% of the overall score.
    User ratings collected online are not part of this score.
    5.8 vs 7.0
  • 17.1% lower review score
    Reviews score
    5.8/ 10
    ✕
    What it is
    Average grade from independent test sites, magazines and video reviewers, 1–10.
    How we count it
    Grades: Each review's own score is converted to 1–10; without one, we grade the review ourselves. Big test sites count more, short reviews half as much as full tests. A video review counts half.
    Score: The average grade is 80% of the review mark; the number of reviews is the other 20% (1 review = 5, the typical number in this category = 8, the most-reviewed model = 10).
    Enough data: With few reviews, the average grade is pulled toward the typical grade of this category. No reviews yet: 7.4 for now.
    Share: Reviews count 25% of the overall score.
    Score distribution
    â–¼
    <55-66-77-88-99-10

    5.8

    Mark 7.6 is below the typical mark 7.8 of this category, so it cannot lift the score above the technical score

    80%

    7.7

    Average grade

    20%

    7.1

    Popularity

    Grades by review (6)
    1 review, its grade estimated from the review text. 5 video reviews, each counting half as much as a written test. Reviews count 25% of the overall score.
    User ratings collected online are not part of this score.
    5.8 vs 7.0
  • 22.7% lower sentiment score
    5.8 vs 7.5
  • 20% lower CPU speed
    This tablet has a lower CPU speed than the average tablet (1.6 GHz vs 2 GHz). The average tablet has CPU speed of 2 GHz.
    1.6 GHz vs 2 GHz
  • 48.1% lower single-core score
    This tablet has a lower single-core score than the average tablet (378 points vs 729 points). The average tablet scores 729 points in single-core tests.
    378 points vs 729 points
  • 26.4% lower multi-core score
    This tablet has a lower multi-core score than the average tablet (1,391 points vs 1,891 points). The average tablet scores 1,891 points in multi-core tests.
    1,391 points vs 1,891 points
  • 3 fewer GPU execution units
    This tablet has less GPU execution units than the average tablet (1 vs 4). The average tablet has 4 GPU execution units.
    1 vs 4
  • 100 nits lower typical brightness
    This tablet has a lower typical brightness than the average tablet (300 nits vs 400 nits). The average tablet reaches 400 nits typical brightness.
    300 nits vs 400 nits
  • Less vivid contrast
    This tablet has less contrast than the average tablet (1000:1 vs 1015:1). The average tablet has a contrast ratio of 1015:1.
    1,000:1 vs 1,015:1
  • 3 MP lower front resolution
    This tablet has a lower-resolution front camera than the average tablet (2 MP vs 5 MP). The average tablet has a front camera of 5 MP.
    2 MP vs 5 MP
  • No continuous video AF
    This tablet does not support continuous video AF, the average tablet does. 57.7% of tablets support continuous video autofocus.
  • 3 MP lower rear resolution
    This tablet has a lower-resolution rear camera than the average tablet (5 MP vs 8 MP). The average tablet has a rear camera of 8 MP.
    5 MP vs 8 MP
  • No manual white balance
    This tablet does not support manual white balance, while the average tablet does. 51.5% of tablets support manual white balance.
  • No panorama mode
    This tablet does not support panorama mode, while the average tablet does. 78.6% of tablets support panorama mode.
  • No timelapse video
    This tablet does not support timelapse video, while the average tablet does. 57.5% of tablets support timelapse video.
  • No fast charging
    This tablet does not support fast charging, while the average tablet does. 56.8% of tablets support fast charging.
  • 44.4% slower charging
    This tablet charges slower than the average tablet (10 W vs 18 W). The average tablet charges at 18 W.
    10 W vs 18 W
  • 9.1% smaller battery capacity
    This tablet has a smaller battery capacity than the average tablet (6,000 mAh vs 6,600 mAh). The average tablet offers 6,600 mAh of battery capacity.
    6,000 mAh vs 6,600 mAh
  • Shorter update support
    This tablet offers shorter update support than the average tablet (short vs medium). The average tablet gets medium of update support.
    short vs medium
  • No direct OS updates
    This tablet does not support direct OS updates, while the average tablet does. 79.7% of tablets offer this.
  • 5.1% heavier
    This tablet is heavier than the average tablet (515 g vs 490 g). The average tablet weighs 490 g.
    515 g vs 490 g

Video reviews

Hands-on testing, unboxing, and real-world video evaluations

7.0
Zi Reviews Tech
≈ estimated
09/05/2023
Unboxing and review · performance, games, battery and camera
Verdict
Teclast P40HD 4G is a very average tablet that does its job as a cheap option, but not a standout deal at this price.
Hands-on video, no verdict
Overview video
Overview video

Expert reviews

In-depth analysis and verdict from leading tech publications
5.0
smartzone.de
≈ estimated
06/10/2023
Hands-on test · Budget tablet
Verdict
The Teclast P40HD is cheap and fast enough for daily tasks, but its heavy, loosely fitted body and blurry, dim screen make it hard to recommend.

Third-party reviews

What customers like about Teclast P40HD 4G (4GB + 64GB)

  • Excellent value for money, often described as a bargain for the specs
  • Sturdy semi-metallic unibody design that feels premium and lightweight
  • Sharp 1920x1200 FHD display with good indoor brightness and clear video quality
  • Responsive performance for daily tasks, streaming, and light gaming
  • Clean software experience with very little bloatware pre-installed
  • Versatile connectivity options including 4G LTE, dual SIM support, and a 3.5mm headphone jack

What customers don't like about Teclast P40HD 4G (4GB + 64GB)

  • Inconsistent battery performance; while some find it robust, others report it drains quickly compared to high-end tablets
  • Lack of long-term software support, with many units never receiving Android version updates
  • Occasional touchscreen inaccuracies and lag reported by some users
  • Poor color accuracy on the display, including a noted red tint in some technical tests
  • Cameras are generally low quality and only suitable for basic video calls
  • Mediocre speaker quality that lacks bass, despite having a stereo setup

Verdict

The Teclast P40 HD 4G is a budget-friendly 10.1-inch tablet featuring a 1920x1200 IPS Full HD display and a slim 7.8mm metal body. It is powered by a Unisoc T606 octa-core processor paired with 4GB of LPDDR4X RAM and 64GB of eMMC internal storage, which is expandable via a microSD slot. Key characteristics include dual-SIM 4G LTE support, dual-band Wi-Fi, and a 6000mAh battery that supports 18W fast charging via USB-C. Main pros are its high-resolution screen for the price, solid build quality, and inclusion of a 3.5mm headphone jack and GPS. However, cons include relatively basic camera performance (5MP rear and 2MP front), limited multitasking capabilities due to the 4GB RAM, and a display that may lack sufficient brightness for comfortable outdoor use.

Compare Teclast P40HD 4G (4GB + 64GB) with other tablets

1Product to compare no. 1
VS
2Product to compare no. 2
VS
3Product to compare no. 3 (optional)

Graphic comparison of Teclast P40HD 4G (4GB + 64GB) and other tablets

No results found