Scored using Graphics cards Methodology v3.0
Graphics cards Methodology v3.0
Mathematical & Unbiased Scoring
Products in this category are scored under Frontum Graphics cards Methodology v3.0: the technical score from the specifications is the base, and independent expert and video reviews (up to ±0.5 points), owner opinions (up to ±0.3) and best-of lists (up to +0.3) move it up or down.
Explore Graphics cards Methodology v3.0

Manli GeForce RTX 4070 Ti Super Gallardo M3604 N693 review: 117 specs compared

Avg. price:~£780VRAM:16 GBMemory bus width:256 bitThermal Design Power (TDP):285 W

Manli GeForce RTX 4070 Ti Super Gallardo M3604 N693 Review: Compare 117 technical specifications to see how this product ranks in the Graphics cards category and whether it is worth buying.
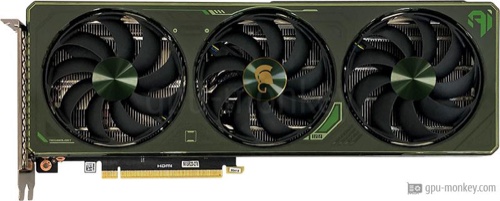
Manli GeForce RTX 4070 Ti Super Gallardo M3604 N693
8.1/10

Overall score

Score
8.1/ 10
✕
What it is
Our main score for this model, 1–10. It combines specs, expert reviews, best-of lists and owners.
How we count it
Parts: Technical score 40%, Reviews score 25%, List score 25%, Sentiment score 10%
Marks: Each part gets a mark out of 10. For reviews, lists and owners, a typical model in this category gets about 8 and the best one gets 10.
No data yet: A part with no data shows "?". It counts as the mark of a weaker model in this category (4 in 5 models with data score higher). This way, models with reviews, lists and owners usually come out ahead.
Score distribution
▼
<55-66-77-88-99-10
Score components

40%

8.7

Technical score

25%

?

Reviews scoreNot enough data yet, so we use 7.6, the mark of a weaker model in this category

25%

?

List scoreNot enough data yet, so we use 7.5, the mark of a weaker model in this category

10%

8.6

Sentiment score

▲Better than 75% of graphics cards
7.6

Value for money

Value for money
7.6/ 10
✕
What it is
An indicator that combines the graphics card's overall rating with its cost.
When it matters
When you are looking for a graphics card that offers a strong balance of performance, features, and price.
Score distribution
▼
<55-66-77-88-99-10
Score components

70%

8.1

Overall score

30%

6.4

Price

▲Better than 62%
8.7

Technical score

Technical score
8.7/ 10
✕
What it is
How good the specs are compared with the other models in this category, 1–10.
How we count it
Areas: We rate the specs in each area against the other models in this category.
Weighting: The areas that matter most to buyers count more. The shares are shown under Score components.
Share: The technical score is 40% of the overall score.
Score distribution
▼
<55-66-77-88-99-10
Score components

44%

8.9

Performance

24%

8.4

Memory

12%

8.5

Power

11%

9.7

Features

5%

6.5

Design

4%

9.6

Connectivity

▲Better than 78%
?

Reviews score

Reviews score
✕
What it is
Average grade from independent test sites, magazines and video reviewers, 1–10.
How we count it
Grades: Each review's own score is converted to 1–10; without one, we grade the review ourselves. Big test sites count more, short reviews half as much as full tests. A video review counts half.
Score: The average grade is 80% of the review mark; the number of reviews is the other 20% (1 review = 5, the typical number in this category = 8, the most-reviewed model = 10).
Enough data: With few reviews, the average grade is pulled toward the typical grade of this category. No reviews yet: 7.6 for now.
Share: Reviews count 25% of the overall score.
Score distribution
▼
<55-66-77-88-99-10
Grades by review (0)
We have not found an independent test of this model yet. Until we do, its review part counts as 7.6.
User ratings collected online are not part of this score.
No expert tests yet
?

List score

List score
7.5/ 10
✕
What it is
How often independent test sites, magazines and video reviewers put this model in their best-of lists for this category.
How we count it
Points: The model in the most lists of this category gets 10; the others get 8 to 10 in proportion. In no list yet: 7.5. Lists count 25% of the overall score.
Enough data: Every list counts, even a single one. With fewer than 5 best-of lists in the category, this part is left out.
Lists with this model (0)
Not in any best-of list yet, so this part counts as 7.5. Models in a list get 8 to 10.
Not in any best-of list yet

What owners say about the Manli GeForce RTX 4070 Ti Super Gallardo M3604 N693

Based on 209 owners sharing their experience in online comments

78%positive9%mixed13%negative

Owners praise its strong gaming speed and generous memory, while demanding games and unstable tuning expose its main limits.

What owners dislike

  • Aggressive undervolt or overclock curves can cause crashes, black screens or driver failures, and some owners found the set voltage did not hold.8
  • Applied curve settings sometimes don't hold: core clocks drop below the target, voltage stays above the set value, and memory clocks reset after applying.4
  • At 4K or 240Hz settings, owners often need DLSS or frame generation, and path-traced games can drop to around 30–40 fps.3
  • Some owners' undervolt presets cost noticeable frame rate, around 5–15%, in games like Red Dead Redemption 2 and Resident Evil Requiem.3

Points mentioned by at least 3 owners, most mentioned first.

Loading...
Loading category ranking...

Technical Specifications of graphics card Manli GeForce RTX 4070 Ti Super Gallardo M3604 N693

Technical score
Technical score
8.7/ 10
✕
What it is
How good the specs are compared with the other models in this category, 1–10.
How we count it
Areas: We rate the specs in each area against the other models in this category.
Weighting: The areas that matter most to buyers count more. The shares are shown under Score components.
Share: The technical score is 40% of the overall score.
Score distribution
▼
<55-66-77-88-99-10
Score components:

44%

8.9

Performance

24%

8.4

Memory

12%

8.5

Power

11%

9.7

Features

5%

6.5

Design

4%

9.6

Connectivity

8.7
Reviews score
7.6
List score
?
Value for money
Value for money
7.6/ 10
✕
What it is
An indicator that combines the graphics card's overall rating with its cost.
When it matters
When you are looking for a graphics card that offers a strong balance of performance, features, and price.
Score distribution
▼
<55-66-77-88-99-10
Score components:

70%

8.1

Overall score

30%

6.4

Price

7.6
3DMark Time Spy benchmark score
24,500 points
This graphics card scores 24,500 points in 3DMark Time Spy, which is higher than 76.8% of graphics cards and equal to 0.7% of graphics cards.
3DMark Port Royal score
15,650 points
This graphics card scores 15,650 points in 3DMark Port Royal, which is higher than 75% of graphics cards.
PassMark (G3D) result
31,827 points
This graphics card scores 31,827 points in PassMark G3D, which is higher than 77% of graphics cards and equal to 0.1% of graphics cards.
PassMark (DirectCompute) result
26,726 points
This graphics card scores 26,726 points in PassMark DirectCompute, which is higher than 91.1% of graphics cards.
FP32 performance
44.1 TFLOPS
This graphics card delivers 44.1 TFLOPS FP32 performance, which is higher than that of 75.8% of graphics cards and equal to that of 1.9% of graphics cards.
Show more
VRAM
16 GB
This graphics card has 16 GB of VRAM, which is more than 62% of graphics cards and equal to 28.1% of graphics cards.
Memory type
GDDR6X
This graphics card uses GDDR6X memory, which is newer than on 57.1% of graphics cards and equal to 22.4% of graphics cards.
Memory bus width
256 bit
This graphics card uses a 256 bit memory bus, which is wider than that of 50.7% of graphics cards and equal to that of 35.5% of graphics cards.
Maximum memory bandwidth
672 GB/s
This graphics card reaches 672 GB/s memory bandwidth, which is higher than that of 68.5% of graphics cards and equal to that of 4.7% of graphics cards.
Effective memory speed
21,000 MHz
This graphics card reaches an effective memory speed of 21,000 MHz, which is faster than that of 61.2% of graphics cards and equal to that of 12.4% of graphics cards.
Show more
PCI Express (PCIe) version
4
This graphics card supports PCIe 4, which is newer than on 22.5% of graphics cards and equal to 50.5% of graphics cards.
PCIe lanes
x16
This graphics card uses x16 PCIe lanes, which is more than 24.1% of graphics cards and equal to 75.9% of graphics cards.
DirectX version
12 Ultimate
This graphics card supports DirectX 12 Ultimate, which is more advanced than on 22.8% of graphics cards and equal to 77.2% of graphics cards.
Vulkan version
1.4
This graphics card supports Vulkan 1.4, which is more advanced than on 20.8% of graphics cards and equal to 79.2% of graphics cards.
OpenGL version
4.6
This graphics card supports OpenGL 4.6, which is more advanced than on 2% of graphics cards and equal to 98% of graphics cards.
Show more
Max displays supported
4
This graphics card supports up to 4 displays, which is more than 9% of graphics cards and equal to 88.2% of graphics cards.
Max digital resolution
7680x4320
This graphics card supports a maximum digital resolution of 7680x4320, which is higher than that of 9.2% of graphics cards and equal to that of 90.9% of graphics cards.
DisplayPort outputs
3
This graphics card offers 3 DisplayPort outputs, which is more than 21.7% of graphics cards and equal to 76% of graphics cards.
DisplayPort version
1.4a
This graphics card supports DisplayPort 1.4a, which is more advanced than on 19.3% of graphics cards and equal to 46.3% of graphics cards.
DisplayPort link rates
20 Gbps
This graphics card supports DisplayPort link rates up to 20 Gbps, which is slower than on 50.4% of graphics cards and equal to 7.2% of graphics cards.
Show more
Thermal Design Power (TDP)
285 W
This graphics card has a TDP of 285 W, which is higher than that of 67.6% of graphics cards and equal to that of 3.5% of graphics cards.
Power consumption while under peak load
285 W
This graphics card draws 285 W under peak load, which is higher than 65.6% of graphics cards and equal to 3.5% of graphics cards.
Recommended PSU wattage
700 W
This graphics card recommends a 700 W PSU, which is higher than that of 60.8% of graphics cards and equal to that of 4.6% of graphics cards.
Board power limit
285 W
This graphics card has a board power limit of 285 W, which is higher than that of 64.4% of graphics cards and equal to that of 3% of graphics cards.
PCIe power spec
285 W
Show more
Size
315x 120x 42 mm
Length
315 mm
This graphics card is 315 mm long, which is longer than 70.2% of graphics cards and equal in length to 0.6% of graphics cards.
Height
125 mm
This graphics card is 125 mm tall, which is shorter than 48.8% of graphics cards and equal in height to 2.9% of graphics cards.
Slot width
3 slot/s
This graphics card occupies 3 slot/s, which is wider than 70.7% of graphics cards and equal in width to 16.8% of graphics cards.
Weight
?
Show more

Manli GeForce RTX 4070 Ti Super Gallardo M3604 N693 vs the average graphics card

246810TotalPerformanceMemoryFeaturesConnectivityPowerDesign
  • 21.9% higher base clock speed
    This graphics card has a higher base GPU clock than the average graphics card (2,340 MHz vs 1920 MHz). The average graphics card has a base GPU clock of 1920 MHz.
    2,340 MHz vs 1,920 MHz
  • 4.2% higher boost clock speed
    This graphics card has a higher boost GPU clock than the average graphics card (2,610 MHz vs 2,505 MHz). The average graphics card has a boost GPU clock of 2,505 MHz.
    2,610 MHz vs 2,505 MHz
  • 26 more compute units
    This graphics card has more compute units than the average graphics card (66 vs 40). The average graphics card has 40 compute units.
    66 vs 40
  • 4 GB more VRAM
    This graphics card has more VRAM than the average graphics card (16 GB vs 12 GB). The average graphics card has 12 GB VRAM.
    16 GB vs 12 GB
  • 82.3% higher texture rate
    This graphics card has a higher texture rate than the average graphics card (689 GTexel/s vs 378 GTexel/s). The average graphics card has a texture rate of 378 GTexel/s.
    689 GTexel/s vs 378 GTexel/s
  • 26 more ray tracing cores
    This graphics card has more ray tracing cores than the average graphics card (66 vs 40). The average graphics card has 40 ray tracing cores.
    66 vs 40
  • 64 bit wider memory bus
    This graphics card has a wider memory bus than the average graphics card (256 bit vs 192 bit). The average graphics card has a memory bus width of 192 bit.
    256 bit vs 192 bit
  • 50% higher memory bandwidth
    This graphics card has a higher memory bandwidth than the average graphics card (672 GB/s vs 448 GB/s). The average graphics card has a memory bandwidth of 448 GB/s.
    672 GB/s vs 448 GB/s
  • 21.9% higher base clock speed
    This graphics card has a higher base GPU clock than the average graphics card (2,340 MHz vs 1920 MHz). The average graphics card has a base GPU clock of 1920 MHz.
    2,340 MHz vs 1,920 MHz
  • 4.2% higher boost clock speed
    This graphics card has a higher boost GPU clock than the average graphics card (2,610 MHz vs 2,505 MHz). The average graphics card has a boost GPU clock of 2,505 MHz.
    2,610 MHz vs 2,505 MHz
  • 26 more compute units
    This graphics card has more compute units than the average graphics card (66 vs 40). The average graphics card has 40 compute units.
    66 vs 40
  • 82.3% higher texture rate
    This graphics card has a higher texture rate than the average graphics card (689 GTexel/s vs 378 GTexel/s). The average graphics card has a texture rate of 378 GTexel/s.
    689 GTexel/s vs 378 GTexel/s
  • 26 more ray tracing cores
    This graphics card has more ray tracing cores than the average graphics card (66 vs 40). The average graphics card has 40 ray tracing cores.
    66 vs 40
  • 32 more ROPs
    This graphics card has more ROPs than the average graphics card (96 vs 64). The average graphics card has 64 ROPs.
    96 vs 64
  • 55.4% higher pixel rate
    This graphics card has a higher pixel rate than the average graphics card (250.6 GPixel/s vs 161.3 GPixel/s). The average graphics card has a pixel rate of 161.3 GPixel/s.
    250.6 GPixel/s vs 161.3 GPixel/s
  • 95.1% higher FP32 performance
    This graphics card has a higher FP32 performance than the average graphics card (44.1 TFLOPS vs 22.6 TFLOPS). The average graphics card has FP32 performance of 22.6 TFLOPS.
    44.1 TFLOPS vs 22.6 TFLOPS
  • 80 more TMUs
    This graphics card has more TMUs than the average graphics card (264 vs 184). The average graphics card has 184 TMUs.
    264 vs 184
  • 120 more AI cores
    This graphics card has more AI cores than the average graphics card (264 vs 144). The average graphics card has 144 AI cores.
    264 vs 144
  • 40.6% higher PassMark score
    This graphics card has a higher PassMark score than the average graphics card (31,827 points vs 22,638 points). The average graphics card has a PassMark score of 22,638 points.
    31,827 points vs 22,638 points
  • 65.8% higher gaming score
    This graphics card has a higher gaming score than the average graphics card (24,500 points vs 14,779 points). The average graphics card has a gaming score of 14,779 points.
    24,500 points vs 14,779 points
  • 71.1% higher ray tracing score
    This graphics card has a higher ray tracing score than the average graphics card (15,650 points vs 9,148 points). The average graphics card has a ray tracing score of 9,148 points.
    15,650 points vs 9,148 points
  • 9.95x higher BF16 performance
    This graphics card has a higher BF16 performance than the average graphics card (353 TFLOPS vs 35.48 TFLOPS). The average graphics card has BF16 performance of 35.48 TFLOPS.
    353 TFLOPS vs 35.48 TFLOPS
  • 2.21x higher compute score
    This graphics card has a higher compute score than the average graphics card (26,726 points vs 12,70.5 points). The average graphics card has a compute score of 12,070.5 points.
    26,726 points vs 12,070.5 points
  • 4 GB more VRAM
    This graphics card has more VRAM than the average graphics card (16 GB vs 12 GB). The average graphics card has 12 GB VRAM.
    16 GB vs 12 GB
  • 64 bit wider memory bus
    This graphics card has a wider memory bus than the average graphics card (256 bit vs 192 bit). The average graphics card has a memory bus width of 192 bit.
    256 bit vs 192 bit
  • 50% higher memory bandwidth
    This graphics card has a higher memory bandwidth than the average graphics card (672 GB/s vs 448 GB/s). The average graphics card has a memory bandwidth of 448 GB/s.
    672 GB/s vs 448 GB/s
  • 2x larger L2 cache
    This graphics card has more L2 cache than the average graphics card (48 MB vs 24 MB). The average graphics card has 24 MB L2 cache.
    48 MB vs 24 MB
  • 10.5% faster memory speed
    This graphics card has a higher effective memory speed than the average graphics card (21,000 MHz vs 19,000 MHz). The average graphics card reaches an effective memory speed of 19,000 MHz.
    21,000 MHz vs 19,000 MHz
  • 2x more transistors
    This graphics card has more transistors than the average graphics card (45,900 million vs 22,900 million). The average graphics card has 22,900 million transistors.
    45,900 million vs 22,900 million
  • Less advanced frame generation
    This graphics card has less advanced frame generation than the average graphics card (frame generation vs multi frame generation).
    frame generation vs multi frame generation
  • 32.6% higher TDP
    This graphics card has a higher TDP than the average graphics card (285 W vs 215 W). The average graphics card has a TDP of 215 W.
    285 W vs 215 W
  • 25% slower VRAM clock
    This graphics card has a lower VRAM clock than the average graphics card (1,313 MHz vs 1,750 MHz). The average graphics card runs its VRAM at 1,750 MHz.
    1,313 MHz vs 1,750 MHz
  • 0.5 slot/s wider design
    This graphics card occupies more slots than the average graphics card (3 slot/s vs 2.5 slot/s). The average graphics card occupies 2.5 slot/s.
    3 slot/s vs 2.5 slot/s
  • 32.8 mm longer card length
    This graphics card is longer than the average graphics card (315 mm vs 282.2 mm). The average graphics card has a length of 282.2 mm.
    315 mm vs 282.2 mm
  • 29.5% higher board power limit
    This graphics card has a higher board power limit than the average graphics card (285 W vs 220 W). The average graphics card has a board power limit of 220 W.
    285 W vs 220 W
  • 2 fewer monitors per output type
    This graphics card supports fewer monitors per output type than the average graphics card (1 vs 3). The average graphics card supports 3 monitors per output type.
    1 vs 3
  • 50% more expensive
    Manli GeForce RTX 4070 Ti Super Gallardo M3604 N693 is more expensive than the average graphics card (£780 vs £520).
    £780 vs £520
  • 50% more expensive
    Manli GeForce RTX 4070 Ti Super Gallardo M3604 N693 is more expensive than the average graphics card (£780 vs £520).
    £780 vs £520
  • 25% slower VRAM clock
    This graphics card has a lower VRAM clock than the average graphics card (1,313 MHz vs 1,750 MHz). The average graphics card runs its VRAM at 1,750 MHz.
    1,313 MHz vs 1,750 MHz
  • Less advanced frame generation
    This graphics card has less advanced frame generation than the average graphics card (frame generation vs multi frame generation).
    frame generation vs multi frame generation
  • 28.8% larger GPU die
    This graphics card has a higher GPU die size than the average graphics card (378.6 mm² vs 294 mm²). The average graphics card has a GPU die size of 294 mm².
    378.6 mm² vs 294 mm²
  • 2 fewer monitors per output type
    This graphics card supports fewer monitors per output type than the average graphics card (1 vs 3). The average graphics card supports 3 monitors per output type.
    1 vs 3
  • 32.6% higher TDP
    This graphics card has a higher TDP than the average graphics card (285 W vs 215 W). The average graphics card has a TDP of 215 W.
    285 W vs 215 W
  • 29.5% higher board power limit
    This graphics card has a higher board power limit than the average graphics card (285 W vs 220 W). The average graphics card has a board power limit of 220 W.
    285 W vs 220 W
  • 7.7% higher PSU requirement
    This graphics card has a higher PSU requirement than the average graphics card (700 W vs 650 W). The average graphics card has a PSU requirement of 650 W.
    700 W vs 650 W
  • 32.8 mm longer card length
    This graphics card is longer than the average graphics card (315 mm vs 282.2 mm). The average graphics card has a length of 282.2 mm.
    315 mm vs 282.2 mm
  • 0.5 slot/s wider design
    This graphics card occupies more slots than the average graphics card (3 slot/s vs 2.5 slot/s). The average graphics card occupies 2.5 slot/s.
    3 slot/s vs 2.5 slot/s

Third-party reviews

What customers like about Manli GeForce RTX 4070 Ti Super Gallardo M3604 N693

  • Upgraded 16GB GDDR6X VRAM provides significantly more breathing room for 4K textures and future-proofing.
  • Excellent 1440p performance, consistently delivering over 100 FPS in demanding titles.
  • High power efficiency compared to competitors, with particularly low idle draw.
  • Compact 2-slot design (in newer revisions) makes it easier to fit into smaller cases compared to bulky 3.5-slot competitors.
  • Access to Nvidia's full feature suite, including DLSS 3.5 Frame Generation and superior Ray Tracing performance.
  • Solid thermal performance, with reported load temperatures staying comfortably around 60-70°C.

What customers don't like about Manli GeForce RTX 4070 Ti Super Gallardo M3604 N693

  • Performance uplift over the original 4070 Ti is relatively small (approx. 5-10%), leading some to view it as a 'boring' refresh.
  • Higher cost per frame compared to the RTX 4070 Super, which is often cited as a better overall value for most gamers.
  • Weak rasterisation value compared to AMD's Radeon RX 7900 XT, which often performs better for less money.
  • Limited availability and potentially longer warranty support times for users in Europe and the US, as Manli's primary market is Asia.
  • Lack of DisplayPort 2.1 support, which is seen as an omission for a high-end card released in 2024.

Verdict

The Manli GeForce RTX 4070 Ti Super Gallardo (M3604+N693) is an enthusiast-class graphics card featuring the NVIDIA Ada Lovelace architecture with 8,448 CUDA cores and 16GB of high-speed GDDR6X memory on a 256-bit bus. This specific Gallardo model utilizes a slimmed-down 2-slot cooling design with three 90mm axial fans and a metal backplate, operating at a base clock of 2,340 MHz and a boost clock of 2,610 MHz with a 285W TDP. Main pros include its significant VRAM and bandwidth upgrade over the standard Ti model, excellent 1440p and competitive 4K gaming performance, and robust AI and ray tracing capabilities through DLSS 3.5. However, it can be quite expensive compared to AMD alternatives, and the performance uplift over the original 4070 Ti is relatively marginal in some rasterization-heavy titles.

Compare Manli GeForce RTX 4070 Ti Super Gallardo M3604 N693 with other products in the Graphics cards category

1Product to compare no. 1
VS
2Product to compare no. 2
VS
3Product to compare no. 3 (optional)

Graphic comparison of Manli GeForce RTX 4070 Ti Super Gallardo M3604 N693 and other products in the Graphics cards category

No results found