Scored using Tablets Methodology v3.0
Tablets Methodology v3.0
Mathematical & Unbiased Scoring
Products in this category are scored under Frontum Tablets Methodology v3.0: the technical score from the specifications is the base, and independent expert and video reviews (up to ±0.5 points), owner opinions (up to ±0.3) and best-of lists (up to +0.3) move it up or down.
Explore Tablets Methodology v3.0

Teclast T65 review: 168 specs compared

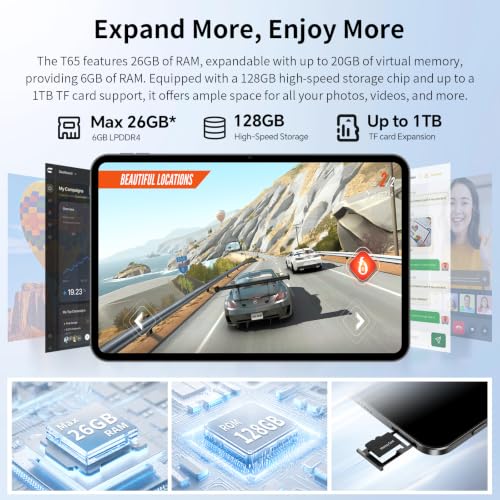
Avg. price:~£160RAM capacity:?Internal storage:128 GBScreen size:13.4 inchesChipset:?

Teclast T65 Review: Compare 168 technical specifications, 4 expert and video reviews and 5 best-of lists to see how this product ranks in the Tablets category and whether it is worth buying.
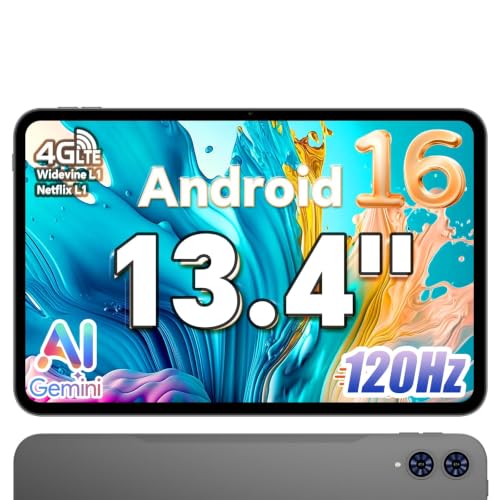
Teclast T65
7.6/10

Overall score

Score
7.6/ 10
✕
What it is
Our main score for this model, 1–10. It combines specs, best-of lists, expert reviews and owners.
How we count it
Parts: Technical score 35%, List score 30%, Reviews score 25%, Sentiment score 10%
Marks: Each part gets a mark out of 10. For reviews, lists and owners, a typical model in this category gets about 8 and the best one gets 10.
No data yet: A part with no data shows "?". It counts as the mark of a weaker model in this category (4 in 5 models with data score higher). This way, models with reviews, lists and owners usually come out ahead.
Score distribution
▼
<55-66-77-88-99-10
Score components

35%

7.1

Technical score

30%

8.2

List score

25%

7.9

Reviews score

10%

?

Sentiment scoreNot enough data yet, so we use 6.9, the mark of a weaker model in this category

▲Better than 76% of tablets
8.2

Value for money

Value for money
8.2/ 10
✕
What it is
An indicator that combines the tablet's overall rating with its cost.
When it matters
When you are looking for a tablet with a good balance between quality and price.
Score distribution
▼
<55-66-77-88-99-10
Score components

70%

7.6

Overall score

30%

9.7

Price

★Better than 92%
7.1

Technical score

Technical score
7.1/ 10
✕
What it is
How good the specs are compared with the other models in this category, 1–10.
How we count it
Areas: We rate the specs in each area against the other models in this category.
Weighting: The areas that matter most to buyers count more. The shares are shown under Score components.
Share: The technical score is 35% of the overall score.
Score distribution
▼
<55-66-77-88-99-10
Score components

22%

7.8

Performance

20%

7.5

Display

16%

7.2

Camera

14%

5.7

Battery

12%

7.3

Connectivity

8%

7.6

Software

5%

6.3

Design

3%

5.5

Audio

▲Better than 71%
7.9

Reviews score

Reviews score
7.9/ 10
✕
What it is
Average grade from independent test sites, magazines and video reviewers, 1–10.
How we count it
Grades: Each review's own score is converted to 1–10; without one, we grade the review ourselves. Big test sites count more, short reviews half as much as full tests. A video review counts half.
Score: The average grade is 80% of the review mark; the number of reviews is the other 20% (1 review = 5, the typical number in this category = 8, the most-reviewed model = 10).
Enough data: With few reviews, the average grade is pulled toward the typical grade of this category. No reviews yet: 7.4 for now.
Share: Reviews count 25% of the overall score.
Score distribution
▼
<55-66-77-88-99-10

80%

8.2

Average grade

20%

6.6

Popularity

Grades by review (4)
2 reviews: 1 with a printed score, 1 estimated from the review. 2 video reviews, each counting half as much as a written test. Reviews count 25% of the overall score.
User ratings collected online are not part of this score.
▲Better than 52%
8.2

List score

List score
8.2/ 10
✕
What it is
How often independent test sites, magazines and video reviewers put this model in their best-of lists for this category.
How we count it
Points: The model in the most lists of this category gets 10; the others get 8 to 10 in proportion. In no list yet: 7.5. Lists count 30% of the overall score.
Enough data: Every list counts, even a single one. With fewer than 5 best-of lists in the category, this part is left out.
Lists with this model (5)
List score: in 5 of 139 lists (4%)
★Better than 97%
  • teclast-t65
  • teclast-t65
  • teclast-t65
  • teclast-t65
  • teclast-t65
  • teclast-t65
  • teclast-t65
  • teclast-t65
teclast-t65
teclast-t65
teclast-t65
teclast-t65
teclast-t65
teclast-t65
teclast-t65
teclast-t65
Where to buy
*As an Amazon Associate, we earn from qualifying purchases.

What reviewers say about the Teclast T65

Based on 2 · 3

Reviewers like the smooth screen and solid battery life, but everyone agrees performance feels slow.
Praised
Criticised
Pick a topic to see who said what
Loading...
Loading category ranking...

Technical Specifications of tablet Teclast T65

Technical score
Technical score
7.1/ 10
✕
What it is
How good the specs are compared with the other models in this category, 1–10.
How we count it
Areas: We rate the specs in each area against the other models in this category.
Weighting: The areas that matter most to buyers count more. The shares are shown under Score components.
Share: The technical score is 35% of the overall score.
Score distribution
▼
<55-66-77-88-99-10
Score components:

22%

7.8

Performance

20%

7.5

Display

16%

7.2

Camera

14%

5.7

Battery

12%

7.3

Connectivity

8%

7.6

Software

5%

6.3

Design

3%

5.5

Audio

7.1
Reviews score
7.9
List score
8.2
Value for money
Value for money
8.2/ 10
✕
What it is
An indicator that combines the tablet's overall rating with its cost.
When it matters
When you are looking for a tablet with a good balance between quality and price.
Score distribution
▼
<55-66-77-88-99-10
Score components:

70%

7.6

Overall score

30%

9.7

Price

8.2
RAM capacity
?
Process node
12 nm
This tablet is built on a 12 nm process, which is smaller than 53.2% of tablets and equal to 13.9% of tablets.
Internal storage
128 GB
This tablet has 128 GB of internal storage, which is more than 56.2% of tablets and equal to 20% of tablets.
Geekbench 6 single-core score
?
Chipset
?
Show more
What reviewers say
Screen resolution
1920×1200
This tablet has a 1920×1200 screen, which is sharper than 39.1% of tablets and equal to 18.8% of tablets.
Refresh rate
120 Hz
This tablet has a 120 Hz screen, which is smoother than 80.3% of tablets and equal to 10.9% of tablets.
Display type
IPS LCD
This tablet uses a IPS LCD display type. 17% of tablets use this display technology.
Pixel density
169 ppi
This tablet has a pixel density of 169 ppi, which is lower than 81.3% of tablets and equal to 0.4% of tablets.
Display glass type
?
Show more
What reviewers say
Optical image stabilization
no
This tablet does not support optical stabilisation. 0.4% of tablets offer this.
Main camera megapixels
?
Front camera megapixels
?
Main camera aperture
?
Optical zoom
1xxx
This tablet has 1xx optical zoom, which is stronger than 18.2% of tablets and equal to 80.9% of tablets.
Show more
Battery capacity
8,000 mAh
This tablet has 8,000 mAh battery capacity, which is larger than 70.2% of tablets and equal to 4% of tablets.
Charging speed
10 W
This tablet charges at 10 W, which is slower than 60.9% of tablets and equal to 33.3% of tablets.
Battery life
?
Wireless charging
no
This tablet does not support wireless charging. 1.5% of tablets offer this.
Fast charging
no
This tablet does not support fast charging. 56.9% of tablets offer this.
Show more
What reviewers say
LTE support
yes
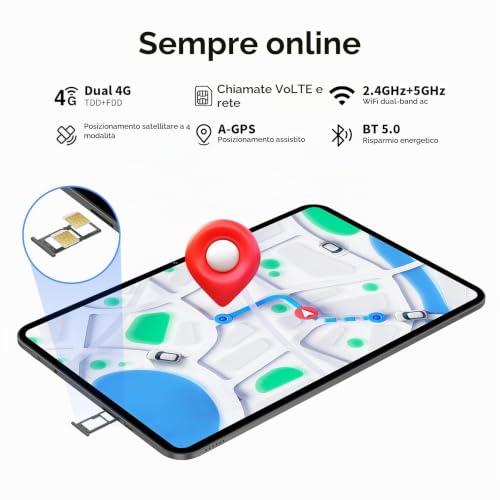
This tablet has built-in LTE. 57.1% of tablets offer this.
Wi-Fi connectivity
yes
This tablet connects to Wi-Fi. 0.2% of tablets offer this.
GPS
yes
This tablet has built-in GPS. 17.1% of tablets offer this.
5G connectivity
no
This tablet does not support 5G. 8.1% of tablets offer this.
NFC
no
This tablet does not include NFC. 10.8% of tablets offer this.
Show more
Operating system
?
Update support duration
short
This tablet offers short update support, which is shorter than the support period of 52.4% of tablets and equal to that of 47.6% of tablets.
Direct OS updates
?
On-device AI
no
This tablet does not support on-device AI. 28.3% of tablets support this capability.
App tracking protection
?
Show more
IP rating
not rated
This tablet's IP rating is not rated, which is less protected than 16.5% of tablets and the same as 83.6% of tablets.
Weight
?
Backlit keyboard
no
This tablet does not support a backlit keyboard. 9.7% of tablets support backlit keyboards.
Keyboard accessory
yes
This tablet supports a keyboard accessory. 15.8% of tablets support this option.
Pen latency
N/A
Show more
Number of microphones
?
aptX Adaptive
no
This tablet does not support aptX Adaptive. 6.9% of tablets offer this.
Dolby Atmos support
no
This tablet does not support Dolby Atmos. 31.3% of tablets support Dolby Atmos.
N. of speakers
2
This tablet includes 2 speakers, which is more than in 9.8% of tablets and equal to the number in 60.8% of tablets.
FM radio
?
Show more

Teclast T65 vs the average tablet

246810TotalPerformanceDisplayCameraBatteryConnectivitySoftwareDesignAudio
  • 2x faster refresh rate
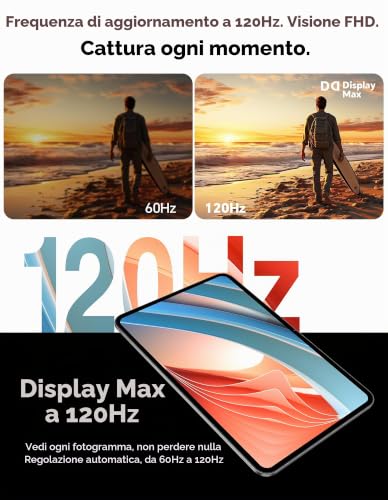
    This tablet has a faster refresh rate than the average tablet (120 Hz vs 60 Hz). The average tablet has a 60 Hz refresh rate.
    120 Hz vs 60 Hz
  • 3.3 inches larger screen
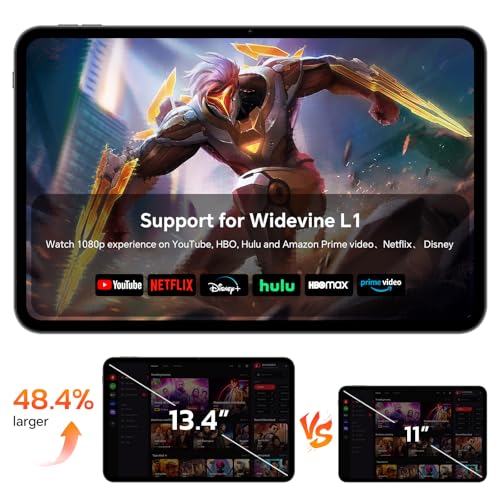
    This tablet has a larger screen than the average tablet (13.4 inches vs 10.1 inches). The average tablet measures 10.1 inches.
    13.4 inches vs 10.1 inches
  • Supports adaptive refresh rate
    This tablet has adaptive refresh rate, the average tablet does not. 17.7% of tablets support adaptive refresh rate.
  • Supports LTE
    This tablet supports LTE, while the average tablet does not. 42.9% of tablets support LTE.
  • 21.2% larger battery capacity
    This tablet has a larger battery capacity than the average tablet (8,000 mAh vs 6,600 mAh). The average tablet offers 6,600 mAh of battery capacity.
    8,000 mAh vs 6,600 mAh
  • 2x more internal storage
    This tablet has more internal storage than the average tablet (128 GB vs 64 GB). The average tablet has 64 GB of internal storage.
    128 GB vs 64 GB
  • Supports cellular data
    This tablet supports cellular data, while the average tablet does not. 47.4% of tablets offer this.
  • 12.9% higher review score
    Reviews score
    7.9/ 10
    ✕
    What it is
    Average grade from independent test sites, magazines and video reviewers, 1–10.
    How we count it
    Grades: Each review's own score is converted to 1–10; without one, we grade the review ourselves. Big test sites count more, short reviews half as much as full tests. A video review counts half.
    Score: The average grade is 80% of the review mark; the number of reviews is the other 20% (1 review = 5, the typical number in this category = 8, the most-reviewed model = 10).
    Enough data: With few reviews, the average grade is pulled toward the typical grade of this category. No reviews yet: 7.4 for now.
    Share: Reviews count 25% of the overall score.
    Score distribution
    ▼
    <55-66-77-88-99-10

    80%

    8.2

    Average grade

    20%

    6.6

    Popularity

    Grades by review (4)
    2 reviews: 1 with a printed score, 1 estimated from the review. 2 video reviews, each counting half as much as a written test. Reviews count 25% of the overall score.
    User ratings collected online are not part of this score.
    7.9 vs 7.0
  • 12.9% higher review score
    Reviews score
    7.9/ 10
    ✕
    What it is
    Average grade from independent test sites, magazines and video reviewers, 1–10.
    How we count it
    Grades: Each review's own score is converted to 1–10; without one, we grade the review ourselves. Big test sites count more, short reviews half as much as full tests. A video review counts half.
    Score: The average grade is 80% of the review mark; the number of reviews is the other 20% (1 review = 5, the typical number in this category = 8, the most-reviewed model = 10).
    Enough data: With few reviews, the average grade is pulled toward the typical grade of this category. No reviews yet: 7.4 for now.
    Share: Reviews count 25% of the overall score.
    Score distribution
    ▼
    <55-66-77-88-99-10

    80%

    8.2

    Average grade

    20%

    6.6

    Popularity

    Grades by review (4)
    2 reviews: 1 with a printed score, 1 estimated from the review. 2 video reviews, each counting half as much as a written test. Reviews count 25% of the overall score.
    User ratings collected online are not part of this score.
    7.9 vs 7.0
  • 9% better value for money
    Teclast T65 has better value for money than the average tablet (8.23 vs 7.6).
    8.23 vs 7.55
  • 2x more internal storage
    This tablet has more internal storage than the average tablet (128 GB vs 64 GB). The average tablet has 64 GB of internal storage.
    128 GB vs 64 GB
  • 14.3% smaller process node
    This tablet has a smaller process node than the average tablet (12 nm vs 14 nm). The average tablet is built on 14 nm.
    12 nm vs 14 nm
  • 2x faster refresh rate
    This tablet has a faster refresh rate than the average tablet (120 Hz vs 60 Hz). The average tablet has a 60 Hz refresh rate.
    120 Hz vs 60 Hz
  • 3.3 inches larger screen
    This tablet has a larger screen than the average tablet (13.4 inches vs 10.1 inches). The average tablet measures 10.1 inches.
    13.4 inches vs 10.1 inches
  • Supports adaptive refresh rate
    This tablet has adaptive refresh rate, the average tablet does not. 17.7% of tablets support adaptive refresh rate.
  • Built-in camera flash
    This tablet has a camera flash, while the average tablet does not. 45.5% of tablets have one.
  • 21.2% larger battery capacity
    This tablet has a larger battery capacity than the average tablet (8,000 mAh vs 6,600 mAh). The average tablet offers 6,600 mAh of battery capacity.
    8,000 mAh vs 6,600 mAh
  • Supports LTE
    This tablet supports LTE, while the average tablet does not. 42.9% of tablets support LTE.
  • Supports cellular data
    This tablet supports cellular data, while the average tablet does not. 47.4% of tablets offer this.
  • Supports dynamic themes
    This tablet supports dynamic themes, while the average tablet does not. 29.5% of tablets offer this.
  • Supports extra dim mode
    This tablet supports extra dim mode, while the average tablet does not. 35.9% of tablets offer this.
  • Includes clipboard warnings
    This tablet has clipboard warnings, the average tablet does not. 40.3% of tablets include clipboard warnings.
  • Shorter update support
    This tablet offers shorter update support than the average tablet (short vs medium). The average tablet gets medium of update support.
    short vs medium
  • No fast charging
    This tablet does not support fast charging, while the average tablet does. 56.8% of tablets support fast charging.
  • 23.5% softer screen detail
    This tablet has softer screen detail than the average tablet (169 ppi vs 221 ppi). The average tablet has a pixel density of 221 ppi.
    169 ppi vs 221 ppi
  • No manual white balance
    This tablet does not support manual white balance, while the average tablet does. 51.5% of tablets support manual white balance.
  • 44.4% slower charging
    This tablet charges slower than the average tablet (10 W vs 18 W). The average tablet charges at 18 W.
    10 W vs 18 W
  • No timelapse video
    This tablet does not support timelapse video, while the average tablet does. 57.5% of tablets support timelapse video.
  • 23.5% softer screen detail
    This tablet has softer screen detail than the average tablet (169 ppi vs 221 ppi). The average tablet has a pixel density of 221 ppi.
    169 ppi vs 221 ppi
  • No manual white balance
    This tablet does not support manual white balance, while the average tablet does. 51.5% of tablets support manual white balance.
  • No timelapse video
    This tablet does not support timelapse video, while the average tablet does. 57.5% of tablets support timelapse video.
  • No fast charging
    This tablet does not support fast charging, while the average tablet does. 56.8% of tablets support fast charging.
  • 44.4% slower charging
    This tablet charges slower than the average tablet (10 W vs 18 W). The average tablet charges at 18 W.
    10 W vs 18 W
  • Shorter update support
    This tablet offers shorter update support than the average tablet (short vs medium). The average tablet gets medium of update support.
    short vs medium

Video reviews

Hands-on testing, unboxing, and real-world video evaluations

9.0
Espritnewgen
≈ estimated
04/03/2026
Hands-on review · battery, GPS and benchmark tests
Verdict
The Teclast T65 is an exceptional tablet at an exceptional price, though not for every use; it is great for browsing and films.
8.0
Espritnewgen
≈ estimated
10/02/2026
First look · unboxing and first impressions
Verdict
The Teclast T65 has satisfied so far, though the full test is still to come.

Expert reviews

In-depth analysis and verdict from leading tech publications

7.4
notebookcheck.net
✓ explicit
21/09/2025
Lab test · Large budget tablet
Verdict
The Teclast T65 suits buyers who want a large 120 Hz screen and 4G on a small budget, if they can live with a sluggish processor and modest battery.
9.0
gsmgotech.com
≈ estimated
23/09/2025
Hands-on review · Family budget tablet
Verdict
The Teclast T65 is good value for streaming, light work and family use, thanks to its smooth screen, but it is not built for demanding games.

Third-party reviews

What customers like about Teclast T65

  • 120 Hz makes scrolling and video look smooth.
  • A 13.4-inch screen gives room for split-screen work.
  • The 8000 mAh battery is large for everyday use.
  • Adaptive refresh rate saves power when the picture is still.
  • Two speakers and HDR photo mode add to the entertainment.
  • LTE support connects it to a mobile data network.

What customers don't like about Teclast T65

  • 169 ppi makes small text look soft.
  • Charging runs at 10 W with no fast charging.
  • Update support is short, so software updates stop sooner.
  • There is no IP rating, so rain and dust are a risk.
  • Video recording tops out at 1080p at 30 fps.

Verdict

A 120 Hz refresh rate on a 13.4-inch screen makes the Teclast T65 feel smooth when you scroll through pages or video. The 1920×1200 IPS LCD panel gives room for two windows side by side, and split-screen mode puts that space to use. The 8000 mAh battery is large, and the adaptive refresh rate drops the speed when the picture is still, which saves power. Two speakers, LTE support and GPS add useful extras. The trade-off is sharpness: 169 ppi means small text looks softer than on denser panels. Charging runs at 10 W with no fast charging, and update support is short. Dynamic theme adds a bit of personality to the interface. It suits someone who watches films, reads long articles and wants a tablet that lasts a long day on one charge.

Compare Teclast T65 with other tablets

1Product to compare no. 1
VS
2Product to compare no. 2
VS
3Product to compare no. 3 (optional)

Graphic comparison of Teclast T65 and other tablets

No results found