Scored using Tablets Methodology v3.0
Tablets Methodology v3.0
Mathematical & Unbiased Scoring
Products in this category are scored under Frontum Tablets Methodology v3.0: the technical score from the specifications is the base, and independent expert and video reviews (up to ±0.5 points), owner opinions (up to ±0.3) and best-of lists (up to +0.3) move it up or down.
Explore Tablets Methodology v3.0

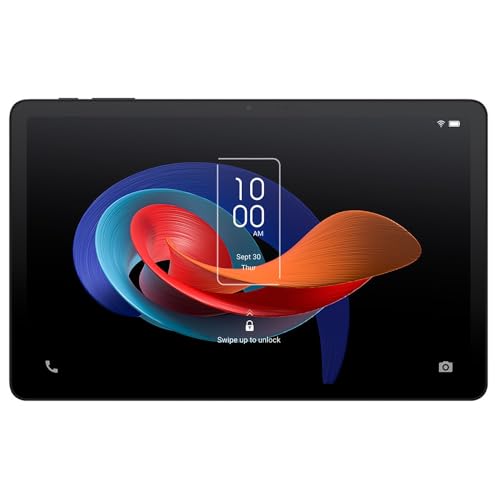
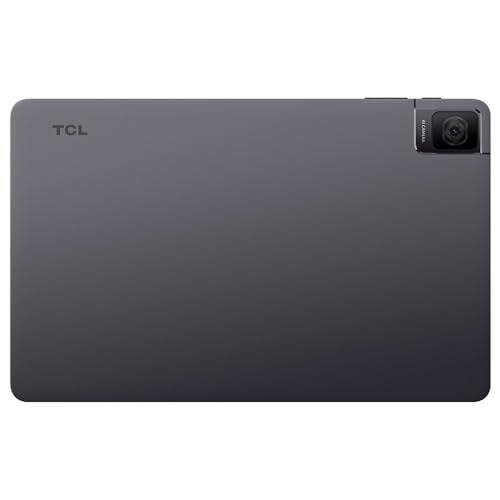
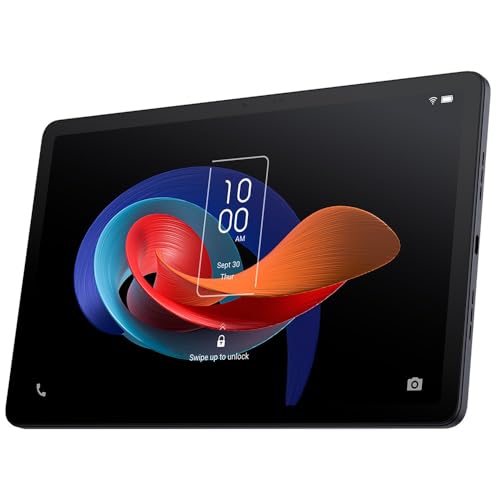
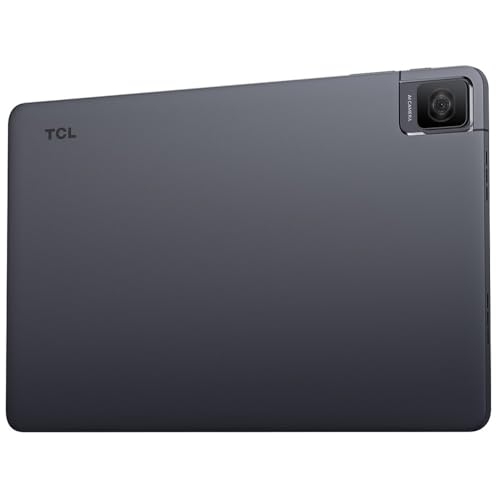
TCL Tab 10 Gen 2 4G (4GB + 64GB) review: 168 specs compared

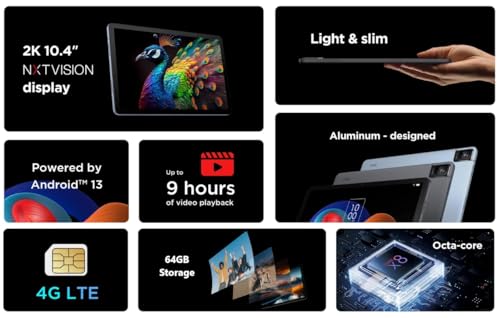
Avg. price:~£130RAM capacity:4 GBInternal storage:64 GBScreen size:10.36 inchesChipset:MediaTek MT8768

TCL Tab 10 Gen 2 4G (4GB + 64GB) Review: Compare 168 technical specifications and 1 expert and video reviews to see how this product ranks in the Tablets category and whether it is worth buying.
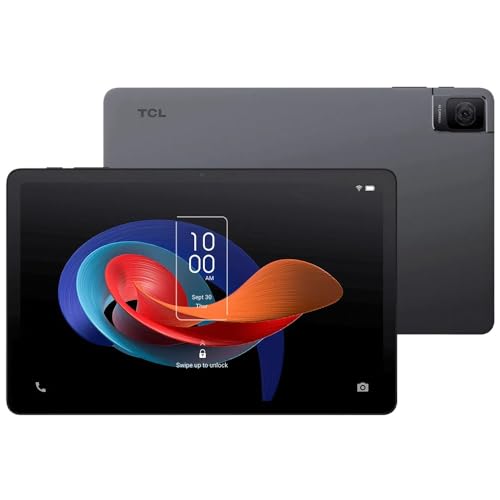
TCL Tab 10 Gen 2 4G (4GB + 64GB)
6.5/10

Overall score

Score
6.5/ 10
✕
What it is
Our main score for this model, 1–10. It combines specs, best-of lists, expert reviews and owners.
How we count it
Parts: Technical score 35%, List score 30%, Reviews score 25%, Sentiment score 10%
Marks: Each part gets a mark out of 10. For reviews, lists and owners, a typical model in this category gets about 8 and the best one gets 10.
No data yet: A part with no data shows "?". It counts as the mark of a weaker model in this category (4 in 5 models with data score higher). This way, models with reviews, lists and owners usually come out ahead.
Score distribution
â–¼
<55-66-77-88-99-10
Score components

35%

6.0

Technical score

30%

?

List scoreNot enough data yet, so we use 7.5, the mark of a weaker model in this category

25%

6.0

Reviews score

10%

?

Sentiment scoreNot enough data yet, so we use 6.9, the mark of a weaker model in this category

â–¼Worse than 68% of tablets
7.5

Value for money

Value for money
7.5/ 10
✕
What it is
An indicator that combines the tablet's overall rating with its cost.
When it matters
When you are looking for a tablet with a good balance between quality and price.
Score distribution
â–¼
<55-66-77-88-99-10
Score components

70%

6.5

Overall score

30%

9.8

Price

â–¼Worse than 57%
6.0

Technical score

Technical score
6.0/ 10
✕
What it is
How good the specs are compared with the other models in this category, 1–10.
How we count it
Areas: We rate the specs in each area against the other models in this category.
Weighting: The areas that matter most to buyers count more. The shares are shown under Score components.
Share: The technical score is 35% of the overall score.
Score distribution
â–¼
<55-66-77-88-99-10
Score components

22%

5.8

Performance

20%

5.3

Display

16%

6.9

Camera

14%

4.0

Battery

12%

7.3

Connectivity

8%

8.2

Software

5%

7.0

Design

3%

4.4

Audio

â–¼Worse than 53%
6.0

Reviews score

Reviews score
6.0/ 10
✕
What it is
Average grade from independent test sites, magazines and video reviewers, 1–10.
How we count it
Grades: Each review's own score is converted to 1–10; without one, we grade the review ourselves. Big test sites count more, short reviews half as much as full tests. A video review counts half.
Score: The average grade is 80% of the review mark; the number of reviews is the other 20% (1 review = 5, the typical number in this category = 8, the most-reviewed model = 10).
Enough data: With few reviews, the average grade is pulled toward the typical grade of this category. No reviews yet: 7.4 for now.
Share: Reviews count 25% of the overall score.
Score distribution
â–¼
<55-66-77-88-99-10

6.0

Mark 7.0 is below the typical mark 7.8 of this category, so it cannot lift the score above the technical score

80%

7.5

Average grade

20%

5.0

Popularity

Grades by review (1)
1 video review, counting half as much as a written test. Reviews count 25% of the overall score.
User ratings collected online are not part of this score.
â–¼Worse than 67%
?

List score

List score
7.5/ 10
✕
What it is
How often independent test sites, magazines and video reviewers put this model in their best-of lists for this category.
How we count it
Points: The model in the most lists of this category gets 10; the others get 8 to 10 in proportion. In no list yet: 7.5. Lists count 30% of the overall score.
Enough data: Every list counts, even a single one. With fewer than 5 best-of lists in the category, this part is left out.
Lists with this model (0)
Not in any best-of list yet, so this part counts as 7.5. Models in a list get 8 to 10.
Not in any best-of list yet
Loading...
Loading category ranking...

Technical Specifications of tablet TCL Tab 10 Gen 2 4G (4GB + 64GB)

Technical score
Technical score
6.0/ 10
✕
What it is
How good the specs are compared with the other models in this category, 1–10.
How we count it
Areas: We rate the specs in each area against the other models in this category.
Weighting: The areas that matter most to buyers count more. The shares are shown under Score components.
Share: The technical score is 35% of the overall score.
Score distribution
â–¼
<55-66-77-88-99-10
Score components:

22%

5.8

Performance

20%

5.3

Display

16%

6.9

Camera

14%

4.0

Battery

12%

7.3

Connectivity

8%

8.2

Software

5%

7.0

Design

3%

4.4

Audio

6.0
Reviews score
6.0
List score
?
Value for money
Value for money
7.5/ 10
✕
What it is
An indicator that combines the tablet's overall rating with its cost.
When it matters
When you are looking for a tablet with a good balance between quality and price.
Score distribution
â–¼
<55-66-77-88-99-10
Score components:

70%

6.5

Overall score

30%

9.8

Price

7.5
RAM capacity
4 GB
This tablet has 4 GB of RAM, which is more than 47.2% of tablets and equal to 17.8% of tablets.
Process node
12 nm
This tablet is built on a 12 nm process, which is smaller than 53.2% of tablets and equal to 13.9% of tablets.
Internal storage
64 GB
This tablet has 64 GB of internal storage, which is more than 39.1% of tablets and equal to 17% of tablets.
Geekbench 6 single-core score
?
Chipset
MediaTek MT8768
This tablet runs on MediaTek MT8768, which is less advanced than 85.5% of tablets and equal to 1% of tablets.
Show more
Screen resolution
2000×1200
This tablet has a 2000×1200 screen, which is sharper than 58.1% of tablets and equal to 8.1% of tablets.
Refresh rate
60 Hz
This tablet has a 60 Hz screen, which is smoother than 0.1% of tablets and equal to 73.4% of tablets.
Display type
IPS LCD
This tablet uses a IPS LCD display type. 17% of tablets use this display technology.
Pixel density
225 ppi
This tablet has a pixel density of 225 ppi, which is higher than 61.7% of tablets and equal to 1.8% of tablets.
Display glass type
Tempered Glass
This tablet protects its screen with Tempered Glass, which is less durable than 78% of tablets and the same as 19.6% of tablets.
Show more
Optical image stabilization
no
This tablet does not support optical stabilisation. 0.4% of tablets offer this.
Main camera megapixels
8 MP
This tablet has a rear camera with 8 MP resolution, which is higher than 36.4% of tablets and equal to 31.9% of tablets.
Front camera megapixels
5 MP
This tablet has a front camera with 5 MP resolution, which is higher than 48.6% of tablets and equal to 19.7% of tablets.
Main camera aperture
f/2.0
This tablet has a main camera aperture of f/2.0, which is wider than 57.4% of tablets and equal to 24.7% of tablets.
Optical zoom
1xxx
This tablet has 1xx optical zoom, which is stronger than 18.2% of tablets and equal to 80.9% of tablets.
Show more
Battery capacity
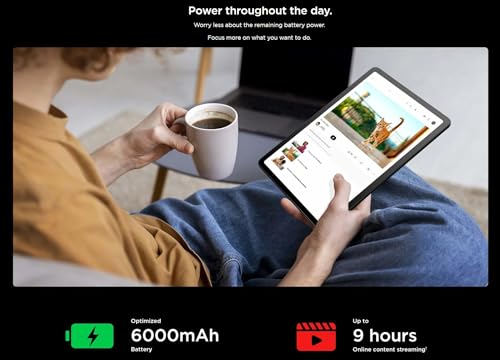
6,000 mAh
This tablet has 6,000 mAh battery capacity, which is smaller than 54.2% of tablets and equal to 4.2% of tablets.
Charging speed
10 W
This tablet charges at 10 W, which is slower than 60.9% of tablets and equal to 33.3% of tablets.
Battery life
9 hours
This tablet has a battery life of 9 hours, which is shorter than that of 62.7% of tablets and equal to that of 6.9% of tablets.
video playback
Wireless charging
no
This tablet does not support wireless charging. 1.5% of tablets offer this.
Fast charging
no
This tablet does not support fast charging. 56.9% of tablets offer this.
Show more
LTE support
yes
This tablet has built-in LTE. 57.1% of tablets offer this.
Wi-Fi connectivity
yes
This tablet connects to Wi-Fi. 0.2% of tablets offer this.
GPS
yes
This tablet has built-in GPS. 17.1% of tablets offer this.
5G connectivity
no
This tablet does not support 5G. 8.1% of tablets offer this.
NFC
no
This tablet does not include NFC. 10.8% of tablets offer this.
Show more
Operating system
Android
This tablet uses the Android operating system, which is more advanced than the one used by 23.2%.
Update support duration
short
This tablet offers short update support, which is shorter than the support period of 52.4% of tablets and equal to that of 47.6% of tablets.
Direct OS updates
yes
This tablet supports direct OS updates. 20.3% of tablets offer this.
On-device AI
?
App tracking protection
yes
This tablet supports app tracking protection. 71.6% of tablets offer this.
Show more
IP rating
?
Weight
425 g
This tablet weighs 425 g, which is lighter than 72.3% of tablets and equal to 0.6% of tablets.
Backlit keyboard
no
This tablet does not support a backlit keyboard. 9.7% of tablets support backlit keyboards.
Keyboard accessory
yes
This tablet supports a keyboard accessory. 15.8% of tablets support this option.
Pen latency
?
Show more
Number of microphones
?
aptX Adaptive
no
This tablet does not support aptX Adaptive. 6.9% of tablets offer this.
Dolby Atmos support
no
This tablet does not support Dolby Atmos. 31.3% of tablets support Dolby Atmos.
N. of speakers
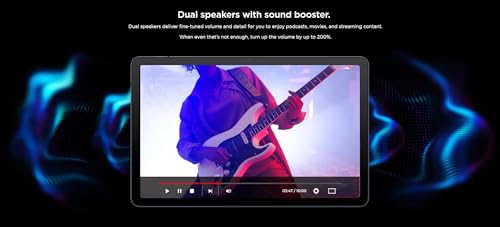
2
This tablet includes 2 speakers, which is more than in 9.8% of tablets and equal to the number in 60.8% of tablets.
FM radio
no
This tablet does not include an FM radio. 19% of tablets offer this.
Show more

TCL Tab 10 Gen 2 4G (4GB + 64GB) vs the average tablet

246810TotalPerformanceDisplayCameraBatteryConnectivitySoftwareDesignAudio
  • Supports LTE
    This tablet supports LTE, while the average tablet does not. 42.9% of tablets support LTE.
  • Includes anti-reflection coating
    This tablet has anti-reflection coating, the average tablet does not. 24.6% of tablets use anti-reflection coating.
  • Supports manual ISO
    This tablet supports manual ISO, while the average tablet does not. 45.9% of tablets support manual ISO.
  • More advanced memory type
    This tablet uses more advanced memory than the average tablet (LPDDR4X vs LPDDR3).
    LPDDR4X vs LPDDR3
  • Supports cellular data
    This tablet supports cellular data, while the average tablet does not. 47.4% of tablets offer this.
  • Supports app tracking protection
    This tablet supports app tracking protection, while the average tablet does not. 28.4% of tablets offer this.
  • Wider main camera aperture
    This tablet has a wider main camera aperture than the average tablet (f/2 vs f/2.2). The average tablet's main camera aperture is f/2.2.
    f/2.0 vs f/2.2
  • 13.3% lighter
    This tablet is lighter than the average tablet (425 g vs 490 g). The average tablet weighs 490 g.
    425 g vs 490 g
  • 2x cheaper
    TCL Tab 10 Gen 2 4G (4GB + 64GB) is cheaper than the average tablet (£130 vs £260).
    £130 vs £260
  • More advanced memory type
    This tablet uses more advanced memory than the average tablet (LPDDR4X vs LPDDR3).
    LPDDR4X vs LPDDR3
  • 4 years newer
    This tablet was released more recently than the average tablet (2023 vs 2019). The average tablet was released in 2019.
    September 2023
    2023 vs 2019
  • 14.3% smaller process node
    This tablet has a smaller process node than the average tablet (12 nm vs 14 nm). The average tablet is built on 14 nm.
    12 nm vs 14 nm
  • Includes anti-reflection coating
    This tablet has anti-reflection coating, the average tablet does not. 24.6% of tablets use anti-reflection coating.
  • Sharper display
    This tablet has a sharper screen than the average tablet (2000×1200 vs 1920×1200).
    2,000×1,200 vs 1,920×1,200
  • 0.26 inches larger screen
    This tablet has a larger screen than the average tablet (10.4 inches vs 10.1 inches). The average tablet measures 10.1 inches.
    10.36 inches vs 10.1 inches
  • 1.8% sharper screen detail
    This tablet has sharper screen detail than the average tablet (225 ppi vs 221 ppi). The average tablet has a pixel density of 221 ppi.
    225 ppi vs 221 ppi
  • Supports manual ISO
    This tablet supports manual ISO, while the average tablet does not. 45.9% of tablets support manual ISO.
  • Wider main camera aperture
    This tablet has a wider main camera aperture than the average tablet (f/2 vs f/2.2). The average tablet's main camera aperture is f/2.2.
    f/2.0 vs f/2.2
  • Supports slow-motion video
    This tablet supports slow-motion recording, while the average tablet does not. 37.3% of tablets support slow-motion recording.
  • Built-in camera flash
    This tablet has a camera flash, while the average tablet does not. 45.5% of tablets have one.
  • Supports LTE
    This tablet supports LTE, while the average tablet does not. 42.9% of tablets support LTE.
  • Supports cellular data
    This tablet supports cellular data, while the average tablet does not. 47.4% of tablets offer this.
  • Supports app tracking protection
    This tablet supports app tracking protection, while the average tablet does not. 28.4% of tablets offer this.
  • Supports dynamic themes
    This tablet supports dynamic themes, while the average tablet does not. 29.5% of tablets offer this.
  • Supports extra dim mode
    This tablet supports extra dim mode, while the average tablet does not. 35.9% of tablets offer this.
  • Includes clipboard warnings
    This tablet has clipboard warnings, the average tablet does not. 40.3% of tablets include clipboard warnings.
  • 13.3% lighter
    This tablet is lighter than the average tablet (425 g vs 490 g). The average tablet weighs 490 g.
    425 g vs 490 g
  • 45.3 mm shorter
    This tablet is shorter than the average tablet (154.7 mm vs 200 mm). The average tablet is 200 mm tall.
    154.7 mm vs 200 mm
  • 0.65 mm thinner
    This tablet is thinner than the average tablet (7.4 mm vs 8 mm). The average tablet is 8 mm thick.
    7.35 mm vs 8 mm
  • Shorter update support
    This tablet offers shorter update support than the average tablet (short vs medium). The average tablet gets medium of update support.
    short vs medium
  • No fast charging
    This tablet does not support fast charging, while the average tablet does. 56.8% of tablets support fast charging.
  • Less durable glass
    This tablet has less durable glass than the average tablet (Tempered Glass vs Corning Gorilla Glass). The average tablet uses Corning Gorilla Glass.
    Tempered Glass vs Corning Gorilla Glass
  • No manual exposure control
    This tablet does not support manual exposure, while the average tablet does. 63.6% of tablets support manual exposure.
  • 51 nits dimmer screen
    This tablet is dimmer than the average tablet (350 nits vs 401 nits). The average tablet reaches 401 nits.
    350 nits vs 401 nits
  • 55.8% lower multi-core score
    This tablet has a lower multi-core score than the average tablet (835 points vs 1,891 points). The average tablet scores 1,891 points in multi-core tests.
    835 points vs 1,891 points
  • 44.4% slower charging
    This tablet charges slower than the average tablet (10 W vs 18 W). The average tablet charges at 18 W.
    10 W vs 18 W
  • 14.3% lower review score
    Reviews score
    6.0/ 10
    ✕
    What it is
    Average grade from independent test sites, magazines and video reviewers, 1–10.
    How we count it
    Grades: Each review's own score is converted to 1–10; without one, we grade the review ourselves. Big test sites count more, short reviews half as much as full tests. A video review counts half.
    Score: The average grade is 80% of the review mark; the number of reviews is the other 20% (1 review = 5, the typical number in this category = 8, the most-reviewed model = 10).
    Enough data: With few reviews, the average grade is pulled toward the typical grade of this category. No reviews yet: 7.4 for now.
    Share: Reviews count 25% of the overall score.
    Score distribution
    â–¼
    <55-66-77-88-99-10

    6.0

    Mark 7.0 is below the typical mark 7.8 of this category, so it cannot lift the score above the technical score

    80%

    7.5

    Average grade

    20%

    5.0

    Popularity

    Grades by review (1)
    1 video review, counting half as much as a written test. Reviews count 25% of the overall score.
    User ratings collected online are not part of this score.
    6.0 vs 7.0
  • 55.8% lower multi-core score
    This tablet has a lower multi-core score than the average tablet (835 points vs 1,891 points). The average tablet scores 1,891 points in multi-core tests.
    835 points vs 1,891 points
  • More basic graphics
    This tablet has less advanced graphics than the average tablet (PowerVR GE8320 vs Mali-G51).
    PowerVR GE8320 vs Mali-G51
  • 14.1% less memory bandwidth
    This tablet has less memory bandwidth than the average tablet (12.8 GB/s vs 14.9 GB/s). The average tablet has 14.9 GB/s of memory bandwidth.
    12.8 GB/s vs 14.9 GB/s
  • Less durable glass
    This tablet has less durable glass than the average tablet (Tempered Glass vs Corning Gorilla Glass). The average tablet uses Corning Gorilla Glass.
    Tempered Glass vs Corning Gorilla Glass
  • 51 nits dimmer screen
    This tablet is dimmer than the average tablet (350 nits vs 401 nits). The average tablet reaches 401 nits.
    350 nits vs 401 nits
  • 50 nits lower typical brightness
    This tablet has a lower typical brightness than the average tablet (350 nits vs 400 nits). The average tablet reaches 400 nits typical brightness.
    350 nits vs 400 nits
  • No manual exposure control
    This tablet does not support manual exposure, while the average tablet does. 63.6% of tablets support manual exposure.
  • No panorama mode
    This tablet does not support panorama mode, while the average tablet does. 78.6% of tablets support panorama mode.
  • No backside-illuminated sensor
    This tablet does not have a BSI sensor, while the average tablet does. 52.6% of tablets have a BSI sensor.
  • No timelapse video
    This tablet does not support timelapse video, while the average tablet does. 57.5% of tablets support timelapse video.
  • No fast charging
    This tablet does not support fast charging, while the average tablet does. 56.8% of tablets support fast charging.
  • 44.4% slower charging
    This tablet charges slower than the average tablet (10 W vs 18 W). The average tablet charges at 18 W.
    10 W vs 18 W
  • 1 hours shorter battery life
    This tablet offers shorter battery life than the average tablet (9 hours vs 10 hours). The average tablet offers 10 hours of battery life.
    video playback
    9 hours vs 10 hours
  • 9.1% smaller battery capacity
    This tablet has a smaller battery capacity than the average tablet (6,000 mAh vs 6,600 mAh). The average tablet offers 6,600 mAh of battery capacity.
    6,000 mAh vs 6,600 mAh
  • Shorter update support
    This tablet offers shorter update support than the average tablet (short vs medium). The average tablet gets medium of update support.
    short vs medium
  • 69.6 mm wider
    This tablet is wider than the average tablet (244.9 mm vs 175.3 mm). The average tablet is 175.3 mm wide.
    244.9 mm vs 175.3 mm
  • No headphone jack
    This tablet does not include a 3.5 mm headphone jack, while the average tablet does. 72.8% of tablets offer this.

Video reviews

Hands-on testing, unboxing, and real-world video evaluations
5.0
FishBee Productions
≈ estimated
18/12/2023
Hands-on review · battery and gaming tests
Verdict
TCL Tab 10 Gen 2 4G has a good screen and battery, but entry-level performance makes it hard to choose over rivals.
Hands-on video, no verdict

Third-party reviews

What customers like about TCL Tab 10 Gen 2 4G (4GB + 64GB)

  • Excellent value for the price point, often cited as a better alternative to budget competitors like Amazon Fire tablets
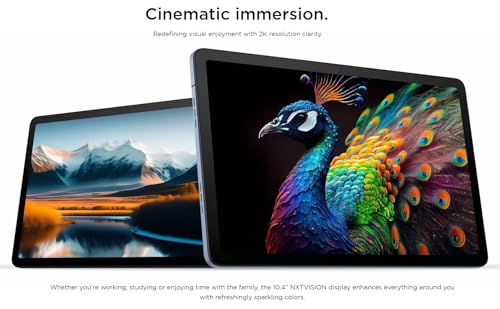
  • Vibrant 10.4-inch 2K NXTVISION display provides a clear and crisp viewing experience for streaming and reading
  • Solid battery life from the 6000mAh unit, capable of lasting through a full day of typical use or long flights
  • Slim and lightweight aluminum design that feels premium and is comfortable for one-handed use
  • Generous expandable storage support up to 1TB via microSD card
  • Decent dual speakers that provide sufficient volume for podcasts and videos

What customers don't like about TCL Tab 10 Gen 2 4G (4GB + 64GB)

  • Noticeable lag and slow performance when multitasking or loading larger applications
  • Camera quality is basic and often produces muddy or washed-out images, particularly in low light
  • Lack of biometric security features like a fingerprint sensor
  • Frustrating adaptive brightness behavior that some users find makes the screen too dark
  • No 3.5mm headphone jack, requiring adapters or Bluetooth for private listening
  • Compatibility issues with some common apps and games

Verdict

The TCL TAB 10 Gen 2 4G is a budget-friendly 10.36-inch tablet featuring a 2K NXTVISION IPS display (2000 x 1200) and an aluminum chassis for a premium feel. It is powered by a MediaTek Helio P22T octa-core processor, 4GB of RAM, and 64GB of storage that is expandable up to 1TB via microSD, running on Android 13. Its main strengths include integrated 4G LTE connectivity for mobile use, a solid 6,000mAh battery supporting long streaming sessions, and dual speakers with sound booster technology. However, users should note that the 10W charging speed is relatively slow for its battery size, and the entry-level chipset may struggle with intensive multitasking or high-end gaming.

Compare TCL Tab 10 Gen 2 4G (4GB + 64GB) with other tablets

1Product to compare no. 1
VS
2Product to compare no. 2
VS
3Product to compare no. 3 (optional)

Graphic comparison of TCL Tab 10 Gen 2 4G (4GB + 64GB) and other tablets

No results found