Scored using Smartwatches Methodology v3.0
Smartwatches Methodology v3.0
Mathematical & Unbiased Scoring
Products in this category are scored under Frontum Smartwatches Methodology v3.0: the technical score from the specifications is the base, and independent expert and video reviews (up to ±0.5 points), owner opinions (up to ±0.3) and best-of lists (up to +0.3) move it up or down.
Explore Smartwatches Methodology v3.0

Fossil Q Harper review: 127 specs compared

Avg. price:~£160Screen size:?Battery life:180 daysDisplay type:?

Fossil Q Harper Review: Compare 127 technical specifications to see how this product ranks in the Smartwatches category and whether it is worth buying.
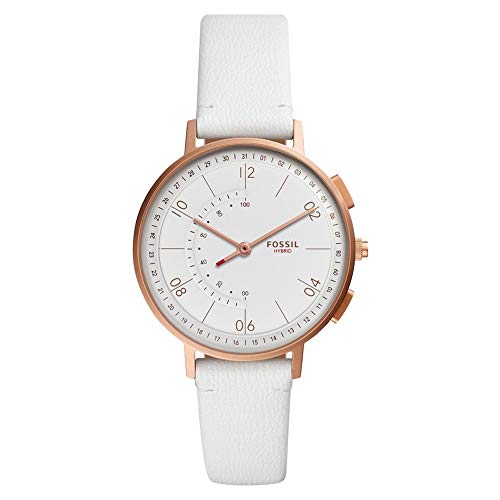
Fossil Q Harper
6.3/10

Overall score

Score
6.3/ 10
✕
What it is
Our main score for this model, 1–10. It combines specs, best-of lists, expert reviews and owners.
How we count it
Parts: Technical score 35%, List score 30%, Reviews score 25%, Sentiment score 10%
Marks: Each part gets a mark out of 10. For reviews, lists and owners, a typical model in this category gets about 8 and the best one gets 10.
No data yet: A part with no data shows "?". It counts as the mark of a weaker model in this category (4 in 5 models with data score higher). This way, models with reviews, lists and owners usually come out ahead.
Score distribution
â–¼
<55-66-77-88-99-10
Score components

35%

4.4

Technical score

30%

?

List scoreNot enough data yet, so we use 7.5, the mark of a weaker model in this category

25%

?

Reviews scoreNot enough data yet, so we use 7.4, the mark of a weaker model in this category

10%

?

Sentiment scoreNot enough data yet, so we use 6.8, the mark of a weaker model in this category

â–¼Worse than 76% of smartwatches
7.3

Value for money

Value for money
7.3/ 10
✕
What it is
An indicator that combines the smartwatch's overall rating with its cost.
When it matters
When you are looking for a smartwatch with a good balance between quality and price.
Score distribution
â–¼
<55-66-77-88-99-10
Score components

70%

6.3

Overall score

30%

9.7

Price

â–¼Worse than 79%
4.4

Technical score

Technical score
4.4/ 10
✕
What it is
How good the specs are compared with the other models in this category, 1–10.
How we count it
Areas: We rate the specs in each area against the other models in this category.
Weighting: The areas that matter most to buyers count more. The shares are shown under Score components.
Share: The technical score is 35% of the overall score.
Score distribution
â–¼
<55-66-77-88-99-10
Score components

24%

2.5

Health

21%

5.0

Fitness

16%

7.4

Battery

14%

4.1

Smart features

12%

2.5

Connectivity

9%

6.3

Display & Design

4%

2.4

Hardware

â–¼Worse than 95%
?

Reviews score

Reviews score
✕
What it is
Average grade from independent test sites, magazines and video reviewers, 1–10.
How we count it
Grades: Each review's own score is converted to 1–10; without one, we grade the review ourselves. Every review counts the same: written or video, short or full test.
Score: The average grade is 80% of the review mark; the number of reviews is the other 20% (1 review = 5, the typical number in this category = 8, the most-reviewed model = 10).
Enough data: With few reviews, the average grade is pulled toward the typical grade of this category. No reviews yet: 7.4 for now.
Share: Reviews count 25% of the overall score.
Score distribution
â–¼
<55-66-77-88-99-10
Grades by review (0)
We have not found an independent test of this model yet. Until we do, its review part counts as 7.4.
User ratings collected online are not part of this score.
No expert tests yet
?

List score

List score
7.5/ 10
✕
What it is
How often independent test sites, magazines and video reviewers put this model in their best-of lists for this category.
How we count it
Points: The model in the most lists of this category gets 10; the others get 8 to 10 in proportion. In no list yet: 7.5. Lists count 30% of the overall score.
Enough data: Every list counts, even a single one. With fewer than 5 best-of lists in the category, this part is left out.
Lists with this model (0)
Not in any best-of list yet, so this part counts as 7.5. Models in a list get 8 to 10.
Not in any best-of list yet
Loading...
Loading category ranking...

Technical Specifications of smartwatch Fossil Q Harper

Technical score
Technical score
4.4/ 10
✕
What it is
How good the specs are compared with the other models in this category, 1–10.
How we count it
Areas: We rate the specs in each area against the other models in this category.
Weighting: The areas that matter most to buyers count more. The shares are shown under Score components.
Share: The technical score is 35% of the overall score.
Score distribution
â–¼
<55-66-77-88-99-10
Score components:

24%

2.5

Health

21%

5.0

Fitness

16%

7.4

Battery

14%

4.1

Smart features

12%

2.5

Connectivity

9%

6.3

Display & Design

4%

2.4

Hardware

4.4
Reviews score
7.4
List score
?
Value for money
Value for money
7.3/ 10
✕
What it is
An indicator that combines the smartwatch's overall rating with its cost.
When it matters
When you are looking for a smartwatch with a good balance between quality and price.
Score distribution
â–¼
<55-66-77-88-99-10
Score components:

70%

6.3

Overall score

30%

9.7

Price

7.3
Heart rate monitor
no
This smartwatch does not include a heart rate monitor. 90.7% of smartwatches include a heart rate monitor.
Blood oxygen monitoring
no
This smartwatch does not support blood oxygen monitoring. 69.7% of smartwatches support blood oxygen monitoring.
ECG
no
This smartwatch does not support ECG. 18.2% of smartwatches support ECG.
Irregular heart rate warnings
no
This smartwatch does not support irregular heart rate warnings. 50.6% of smartwatches support irregular heart rate warnings.
HRV tracking
no
This smartwatch does not support HRV tracking. 45.2% of smartwatches support HRV tracking.
Show more
Accelerometer
yes
This smartwatch includes an accelerometer. 0.5% of smartwatches include an accelerometer.
Barometer
no
This smartwatch does not include a barometer. 53.6% of smartwatches include a barometer.
Gyroscope
no
This smartwatch does not include a gyroscope. 71.3% of smartwatches include a gyroscope.
Cadence sensor
no
This smartwatch does not include a cadence sensor. 32.9% of smartwatches include a cadence sensor.
Distance tracking
yes
This smartwatch supports distance tracking. 3.7% of smartwatches support distance tracking.
Show more
Battery life
180 days
This smartwatch lasts 180 days on a charge, which is longer than 98.5% of Smartwatches and the same as 1% of Smartwatches.
Converted from the reported 6-month hybrid battery life.
Battery life in training mode
?
Battery life with GPS on
N/A
Battery power
?
Charge time
?
Show more
Operating system
Proprietary OS
This smartwatch runs Proprietary OS, which is less advanced than the system in 54.2% of Smartwatches and equal to 42% of Smartwatches.
Software update frequency
?
Third-party app support
no
This smartwatch does not support third-party apps. 51.6% of smartwatches support third-party apps.
Notifications
yes
This smartwatch supports notifications. 0.3% of smartwatches support notifications.
Voice assistant support
no
This smartwatch does not support voice assistants. 69.3% of smartwatches support voice assistants.
Show more
Cellular module
no
This smartwatch does not include a cellular module. 16.7% of smartwatches include a cellular module.
SIM cards
0
GPS
no
This smartwatch does not support GPS. 59.8% of smartwatches support GPS.
Galileo support
no
This smartwatch does not support Galileo navigation. 43.6% of smartwatches support Galileo navigation.
Dual-frequency GPS
no
This smartwatch does not support dual-frequency GPS. 15.1% of Smartwatches offer this.
Show more
Screen size
?
Display type
?
Resolution
?
Pixel density
?
Display brightness
?
Show more
CPU speed
?
Processor model
?
RAM
N/A
Internal storage
0 GB
This smartwatch has 0 GB of internal storage, which is less than 76.5% of Smartwatches and equal to 23.5% of Smartwatches.
No local user storage for apps/media.
External memory slot
no
This smartwatch does not include an external memory slot. 0.3% of smartwatches include an external memory slot.
Show more

Fossil Q Harper vs the average smartwatch

246810TotalHealthFitnessBatteryConnectivityDisplay & DesignSmart featuresHardware
  • 173 days longer battery life
    This smartwatch runs longer per charge than the average smartwatch (180 days vs 7 days). The average smartwatch runs for 7 days on a charge.
    Converted from the reported 6-month hybrid battery life.
    180 days vs 7 days
  • Calorie tracking
    This smartwatch supports calorie tracking, the average smartwatch does not. 48.7% of smartwatches support calorie tracking.
  • Water intake tracking
    This smartwatch tracks water intake, the average smartwatch does not. 44.1% of smartwatches track water intake.
    Water intake tracking may require manual logging in a companion app or widget.
  • 6 mm slimmer strap
    This smartwatch has a slimmer strap than the average smartwatch (16 mm vs 22 mm). The average smartwatch has a 22 mm strap.
    16 mm vs 22 mm
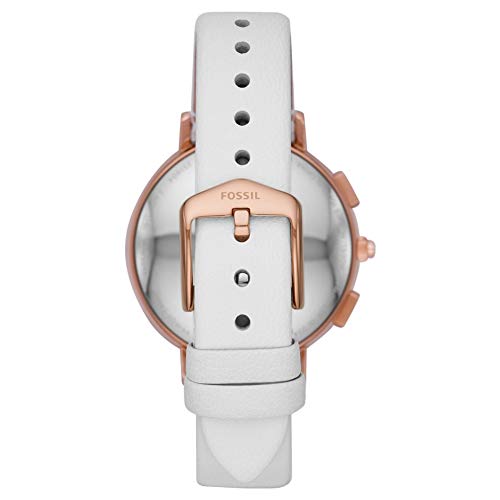
  • Hybrid watch design
    This smartwatch has a hybrid design, the average smartwatch does not. 8.6% of smartwatches have a hybrid design.
  • Better band material
    This smartwatch uses leather for the band material, while the average smartwatch uses silicone.
    leather vs silicone
  • Better case material
    This smartwatch uses stainless steel for the case material, while the average smartwatch uses polycarbonate.
    stainless steel vs polycarbonate
  • 8 mm shorter case
    This smartwatch has a shorter case than the average smartwatch (37 mm vs 45 mm). The average smartwatch is 45 mm tall.
    37 mm vs 45 mm
  • Calorie tracking
    This smartwatch supports calorie tracking, the average smartwatch does not. 48.7% of smartwatches support calorie tracking.
  • Water intake tracking
    This smartwatch tracks water intake, the average smartwatch does not. 44.1% of smartwatches track water intake.
    Water intake tracking may require manual logging in a companion app or widget.
  • 173 days longer battery life
    This smartwatch runs longer per charge than the average smartwatch (180 days vs 7 days). The average smartwatch runs for 7 days on a charge.
    Converted from the reported 6-month hybrid battery life.
    180 days vs 7 days
  • 6 mm slimmer strap
    This smartwatch has a slimmer strap than the average smartwatch (16 mm vs 22 mm). The average smartwatch has a 22 mm strap.
    16 mm vs 22 mm
  • Hybrid watch design
    This smartwatch has a hybrid design, the average smartwatch does not. 8.6% of smartwatches have a hybrid design.
  • Better band material
    This smartwatch uses leather for the band material, while the average smartwatch uses silicone.
    leather vs silicone
  • Better case material
    This smartwatch uses stainless steel for the case material, while the average smartwatch uses polycarbonate.
    stainless steel vs polycarbonate
  • 8 mm shorter case
    This smartwatch has a shorter case than the average smartwatch (37 mm vs 45 mm). The average smartwatch is 45 mm tall.
    37 mm vs 45 mm
  • 5.5 mm narrower case
    This smartwatch has a narrower case than the average smartwatch (37 mm vs 42.5 mm). The average smartwatch measures 42.5 mm across.
    37 mm vs 42.5 mm
  • No VO2 max measurement
    This smartwatch does not measure VO2 max, the average smartwatch does. 51.3% of smartwatches measure VO2 max.
  • No blood oxygen monitoring
    This smartwatch does not support blood oxygen monitoring, the average smartwatch does. 69.6% of smartwatches support blood oxygen monitoring.
  • No GPS support
    This smartwatch does not support GPS, the average smartwatch does. 59.7% of smartwatches support GPS.
  • No third-party apps
    This smartwatch does not support third-party apps, the average smartwatch does. 51.6% of smartwatches support third-party apps.
  • No irregular heart rate alerts
    This smartwatch does not support irregular heart rate warnings, the average smartwatch does. 50.6% of smartwatches support irregular heart rate warnings.
  • No stress monitoring
    This smartwatch does not support stress monitoring, the average smartwatch does. 68.7% of smartwatches support stress monitoring.
  • No multi-sport mode
    This smartwatch does not include a multi-sport mode, the average smartwatch does. 71.7% of smartwatches include a multi-sport mode.
  • No heart rate monitor
    This smartwatch does not include a heart rate monitor, the average smartwatch does. 90.5% of smartwatches include a heart rate monitor.
  • 5.9% worse value for money
    Fossil Q Harper has a lower value-for-money score than the average smartwatch (7.33 vs 7.8).
    7.33 vs 7.76
  • No VO2 max measurement
    This smartwatch does not measure VO2 max, the average smartwatch does. 51.3% of smartwatches measure VO2 max.
  • No blood oxygen monitoring
    This smartwatch does not support blood oxygen monitoring, the average smartwatch does. 69.6% of smartwatches support blood oxygen monitoring.
  • No irregular heart rate alerts
    This smartwatch does not support irregular heart rate warnings, the average smartwatch does. 50.6% of smartwatches support irregular heart rate warnings.
  • No stress monitoring
    This smartwatch does not support stress monitoring, the average smartwatch does. 68.7% of smartwatches support stress monitoring.
  • No heart rate monitor
    This smartwatch does not include a heart rate monitor, the average smartwatch does. 90.5% of smartwatches include a heart rate monitor.
  • No cycle tracking
    This smartwatch does not support menstrual cycle tracking, the average smartwatch does. 66.8% of smartwatches support menstrual cycle tracking.
  • No smart scale support
    This smartwatch does not support smart scale compatibility, the average smartwatch does. 57.1% of smartwatches support smart scale compatibility.
  • No multi-sport mode
    This smartwatch does not include a multi-sport mode, the average smartwatch does. 71.7% of smartwatches include a multi-sport mode.
  • No elevation tracking
    This smartwatch does not support elevation tracking, the average smartwatch does. 67.6% of smartwatches support elevation tracking.
  • No barometer
    This smartwatch does not include a barometer, the average smartwatch does. 53.6% of smartwatches include a barometer.
  • No pace tracking
    This smartwatch does not support pace tracking, the average smartwatch does. 80.6% of smartwatches support pace tracking.
  • No route tracking
    This smartwatch does not support route tracking, the average smartwatch does. 77% of smartwatches support route tracking.
  • No coaching features
    This smartwatch does not support coaching, the average smartwatch does. 58.8% of smartwatches support coaching.
  • No gyroscope
    This smartwatch does not include a gyroscope, the average smartwatch does. 71.2% of smartwatches include a gyroscope.
  • No auto-pause
    This smartwatch does not support auto pause, the average smartwatch does. 62.6% of smartwatches support auto pause.
  • No route support
    This smartwatch does not support route support, the average smartwatch does. 54.4% of smartwatches support route support.
  • No live tracking
    This smartwatch does not support live tracking, the average smartwatch does. 89.5% of smartwatches support live tracking.
  • No voice feedback
    This smartwatch does not support voice feedback, the average smartwatch does. 63.5% of smartwatches support voice feedback.
  • Basic battery type
    This smartwatch uses a button-cell battery, while the average smartwatch uses Li-Po.
    button-cell vs Li-Po
  • No battery indicator
    This smartwatch does not include a battery level indicator, the average smartwatch does. 97.8% of smartwatches include a battery level indicator.
  • No GPS support
    This smartwatch does not support GPS, the average smartwatch does. 59.7% of smartwatches support GPS.
  • No compass
    This smartwatch does not include a compass, the average smartwatch does. 56.7% of smartwatches include a compass.
  • Less current Bluetooth version
    This smartwatch uses a less current Bluetooth version than the average smartwatch (4.1 vs 5).
    4.1 vs 5
  • No always-on display
    This smartwatch does not have an always-on display, the average smartwatch does. 70.3% of smartwatches have an always-on display.
  • No ambient light sensor
    This smartwatch does not include an ambient light sensor, the average smartwatch does. 63.5% of smartwatches include an ambient light sensor.
  • 1.3 mm thicker
    This smartwatch is thicker than the average smartwatch (13 mm vs 11.7 mm). The average smartwatch is 11.7 mm thick.
    Some sources mention variant-dependent thickness values.
    13 mm vs 11.7 mm
  • No touchscreen
    This smartwatch does not have a touch screen, the average smartwatch does. 91.5% of smartwatches have a touch screen.
  • No third-party apps
    This smartwatch does not support third-party apps, the average smartwatch does. 51.6% of smartwatches support third-party apps.
  • No music playback
    This smartwatch does not support music playback, the average smartwatch does. 57.1% of smartwatches support music playback.
  • No voice assistant
    This smartwatch does not support voice assistants, the average smartwatch does. 69.2% of smartwatches support voice assistants.
  • No call answering
    This smartwatch does not support call answering, the average smartwatch does. 60% of smartwatches support call answering.
  • No call controls
    This smartwatch does not offer call control, the average smartwatch does. 91.2% of smartwatches offer call control.
  • No passcode
    This smartwatch does not include passcode protection, the average smartwatch does. 70.4% of smartwatches include passcode protection.
  • No smart alarm
    This smartwatch does not support a smart alarm, the average smartwatch does. 50.6% of smartwatches support smart alarms.
  • No gesture control
    This smartwatch does not support gesture control, the average smartwatch does. 79.6% of smartwatches support gesture control.
  • No speaker
    This smartwatch does not include a built-in speaker, the average smartwatch does. 56.7% of smartwatches include a built-in speaker.

Third-party reviews

What customers like about Fossil Q Harper

  • Stylish and attractive traditional watch design that looks high-end
  • Exceptional battery life lasting 6 to 12 months with no daily charging required
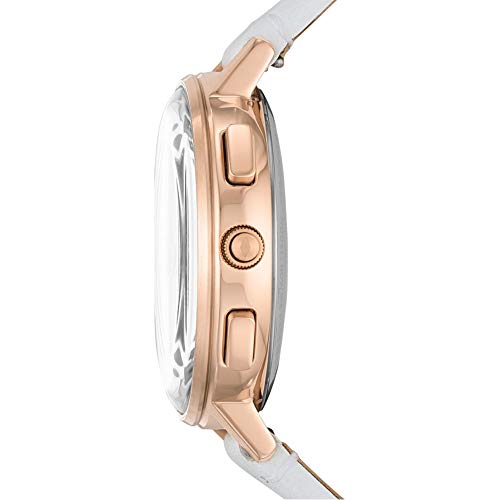
  • Easy-to-use physical buttons that can be customised for music control or camera shutter
  • Comfortable fit with high-quality, interchangeable straps
  • Subtle and discreet notifications that don't overwhelm the user

What customers don't like about Fossil Q Harper

  • Inaccurate or basic activity and sleep tracking compared to dedicated fitness trackers
  • Difficult to read in dark environments due to lack of backlight or luminous hands
  • Limited notification detail; hands point to numbers rather than showing text
  • Occasional Bluetooth connectivity issues between the watch and the smartphone app
  • Unintuitive setup for users expecting standard smartwatch features like apps or payments

Verdict

The Fossil Q Harper is a 37mm hybrid smartwatch with a traditional analog face and 16mm interchangeable straps, featuring an accelerometer for tracking steps, distance, calories, and sleep, alongside Bluetooth-connected notifications and customizable buttons [1.1, 1.2]. Its primary advantage is a 6-month battery life via a replaceable coin cell, eliminating the need for daily charging [1.2]. However, it lacks a digital display, heart rate sensor, and built-in GPS, while offering only 3 ATM water resistance [1.2].

Compare Fossil Q Harper with other Smartwatches

1Product to compare no. 1
VS
2Product to compare no. 2
VS
3Product to compare no. 3 (optional)

Graphic comparison of Fossil Q Harper and other Smartwatches

No results found