Scored using Smartphones Methodology v3.0
Smartphones Methodology v3.0
Mathematical & Unbiased Scoring
Products in this category are scored under Frontum Smartphones Methodology v3.0: the technical score from the specifications is the base, and independent expert and video reviews (up to ±0.5 points), owner opinions (up to ±0.3) and best-of lists (up to +0.3) move it up or down.
Explore Smartphones Methodology v3.0

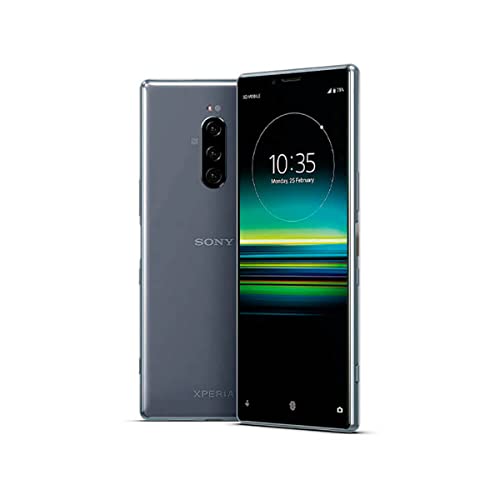
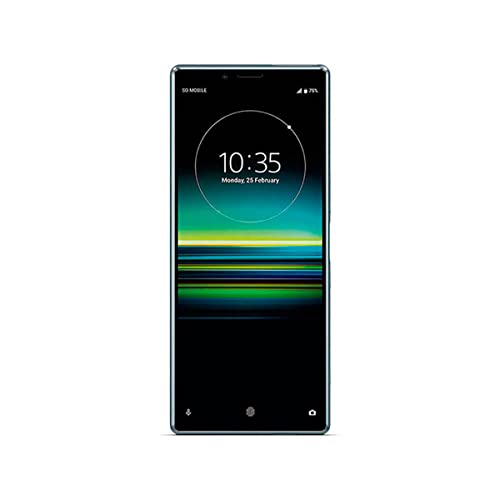
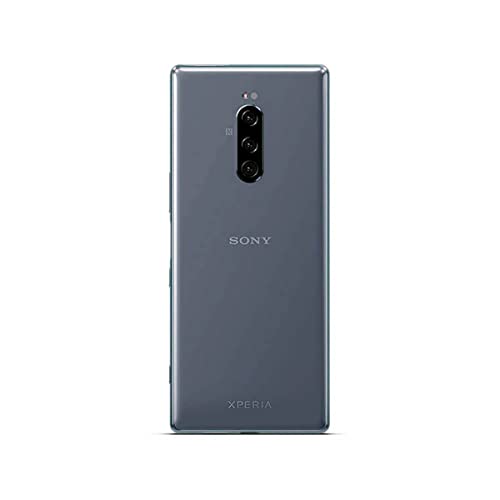
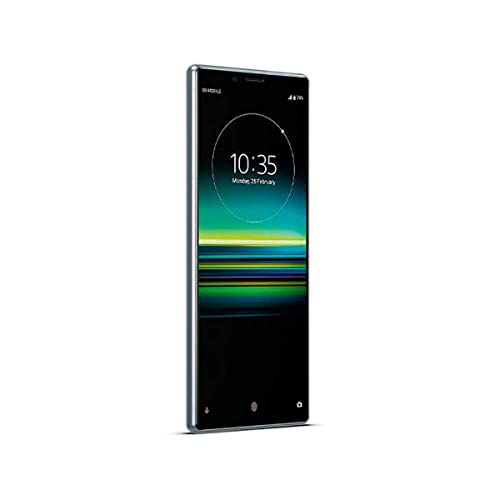
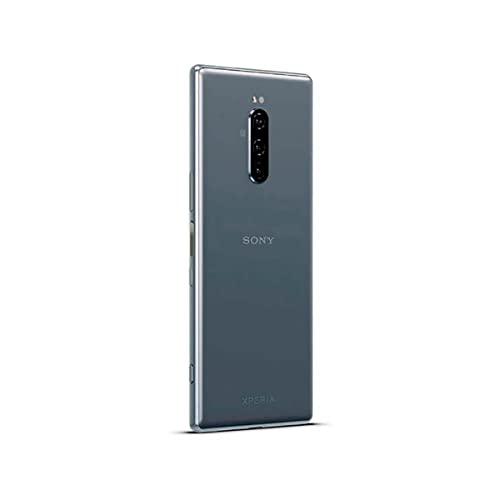
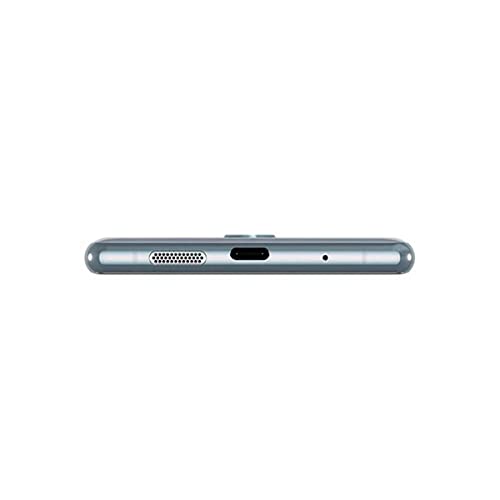
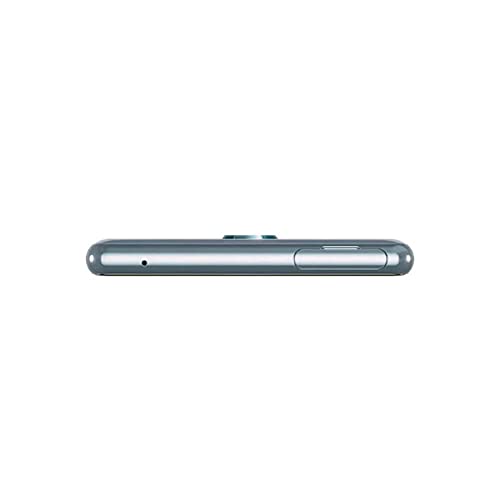
Sony Xperia 1 (128GB) review: 196 specs compared

Avg. price:~£250RAM capacity:6 GBInternal storage:128 GBScreen size:6.5 inchesMain camera megapixels:12 MP & 12 MP & 12 MP

Sony Xperia 1 (128GB) Review: Compare 196 technical specifications, 42 expert and video reviews and 212 owner opinions to see how this product ranks in the Smartphones category and whether it is worth buying.

Sony Xperia 1 (128GB)
6.7/10

Overall score

Score
6.7/ 10
✕
What it is
Our main score for this model, 1–10. It combines specs, best-of lists, expert reviews and owners.
How we count it
Parts: Technical score 40%, List score 30%, Reviews score 25%, Sentiment score 5%
Marks: Each part gets a mark out of 10. For reviews, lists and owners, a typical model in this category gets about 8 and the best one gets 10.
No data yet: A part with no data shows "?". It counts as the mark of a weaker model in this category (4 in 5 models with data score higher). This way, models with reviews, lists and owners usually come out ahead.
Score distribution
â–¼
<55-66-77-88-99-10
Score components

40%

6.1

Technical score

30%

?

List scoreNot enough data yet, so we use 7.5, the mark of a weaker model in this category

25%

6.1

Reviews score

5%

9.9

Sentiment score

â–¼Worse than 72% of smartphones
7.5

Value for money

Value for money
7.5/ 10
✕
What it is
An indicator that combines the smartphone's overall rating with its cost.
When it matters
When you are looking for a smartphone with a good balance between quality and price.
Score distribution
â–¼
<55-66-77-88-99-10
Score components

70%

6.7

Overall score

30%

9.2

Price

â–¼Worse than 68%
6.1

Technical score

Technical score
6.1/ 10
✕
What it is
How good the specs are compared with the other models in this category, 1–10.
How we count it
Areas: We rate the specs in each area against the other models in this category.
Weighting: The areas that matter most to buyers count more. The shares are shown under Score components.
Share: The technical score is 40% of the overall score.
Score distribution
â–¼
<55-66-77-88-99-10
Score components

25%

5.7

Performance

18%

7.4

Camera

15%

6.2

Display

15%

3.4

Battery

10%

7.6

Software

10%

7.1

Connectivity

4%

7.6

Audio

3%

6.0

Design

â–¼Worse than 70%
6.1

Reviews score

Reviews score
6.1/ 10
✕
What it is
Average grade from independent test sites, magazines and video reviewers, 1–10.
How we count it
Grades: Each review's own score is converted to 1–10; without one, we grade the review ourselves. Big test sites count more, short reviews half as much as full tests. A video review counts half.
Score: The average grade is 80% of the review mark; the number of reviews is the other 20% (1 review = 5, the typical number in this category = 8, the most-reviewed model = 10).
Enough data: With few reviews, the average grade is pulled toward the typical grade of this category. No reviews yet: 7.5 for now.
Share: Reviews count 25% of the overall score.
Score distribution
â–¼
<55-66-77-88-99-10

6.1

Mark 7.8 is below the typical mark 7.9 of this category, so it cannot lift the score above the technical score

80%

7.6

Average grade

20%

8.6

Popularity

Grades by review (42)
13 reviews: 9 with a printed score, 4 estimated from the review. 29 video reviews, each counting half as much as a written test. Reviews count 25% of the overall score.
User ratings collected online are not part of this score.
â–¼Worse than 82%
9.9

Sentiment score

Sentiment score
9.9/ 10
✕
What it is
How positive owners are about this model in their comments under video reviews and on forums. We read each comment, keep only people who say they own the model, and sort them into positive, mixed or negative.
How we count it
Score: We compare how satisfied this model’s owners are with the other models in this category: the typical model gets 8, the most satisfied tenth 10, the least satisfied 4. This is 80% of the owner mark; the number of owners is the other 20%.
Enough data: A model counts with 10+ owners from 4+ different discussions. With fewer, the owner part changes nothing.
Share: Owners count 5% of the overall score (left out in categories where fewer than 10 models have enough owner comments).
Score distribution
â–¼
<55-66-77-88-99-10

80%

9.9

Satisfaction

20%

10

Popularity

Owners (212)
212 owners from 25 online discussions
70% positive
9% mixed
21% negative
Category average: 51% positive
Our own analysis of online owner opinions, not a rating from any website.
★Better than 91%
?

List score

List score
7.5/ 10
✕
What it is
How often independent test sites, magazines and video reviewers put this model in their best-of lists for this category.
How we count it
Points: The model in the most lists of this category gets 10; the others get 8 to 10 in proportion. In no list yet: 7.5. Lists count 30% of the overall score.
Enough data: Every list counts, even a single one. With fewer than 5 best-of lists in the category, this part is left out.
Lists with this model (0)
Not in any best-of list yet, so this part counts as 7.5. Models in a list get 8 to 10.
Not in any best-of list yet

What reviewers say about the Sony Xperia 1 (128GB)

Based on 0 · 30

Reviewers love the stunning display and strong performance, but battery life and charging are the clear weak spot, and it's pricey.
Praised
Mixed views
Criticised
Pick a topic to see who said what

What owners say about the Sony Xperia 1 (128GB)

Based on 212 owners sharing their experience in online comments

70%positive9%mixed21%negative

Owners love the vivid display and multimedia experience, while battery life and camera performance draw the most complaints.

What owners dislike

  • Some owners say the battery falls short with heavy use, managing only around six hours of screen time or a day with video streaming.12
  • Some owners report phones that die suddenly, get stuck in boot loops or show black screens, often after water damage or repairs.12
  • Owners say the fingerprint scanner often fails to unlock, and some report it overheating or stopping work, including after battery replacement.9
  • Owners find photos weak in low light, with dark shots lacking brightness and focus slow or unreliable at night.7
  • Owners say the camera app is hard to use, with automatic mode missing HDR and needing manual settings to get the best results.7
  • Some owners say photo quality trails rival phones from Samsung, Google and Huawei, and a few returned the phone over it.7
  • Owners find the screen too dim outdoors, with poor visibility in bright sunlight.6
  • Owners say zoom shots lack fine detail and dynamic range is limited, even compared with older phones.4
  • Owners report Wi-Fi that drops every few minutes, especially with a case on, and weaker signal than some rival phones.4
  • Owners find apps such as Netflix and Prime Video often stream upscaled or lower-quality video on this 21:9 screen, with limited 4K support.4

Points mentioned by at least 3 owners, most mentioned first.

Loading...
Loading category ranking...

Technical Specifications of smartphone Sony Xperia 1 (128GB)

Technical score
Technical score
6.1/ 10
✕
What it is
How good the specs are compared with the other models in this category, 1–10.
How we count it
Areas: We rate the specs in each area against the other models in this category.
Weighting: The areas that matter most to buyers count more. The shares are shown under Score components.
Share: The technical score is 40% of the overall score.
Score distribution
â–¼
<55-66-77-88-99-10
Score components:

25%

5.7

Performance

18%

7.4

Camera

15%

6.2

Display

15%

3.4

Battery

10%

7.6

Software

10%

7.1

Connectivity

4%

7.6

Audio

3%

6.0

Design

6.1
Reviews score
6.1
Sentiment score
9.9
List score
?
Value for money
Value for money
7.5/ 10
✕
What it is
An indicator that combines the smartphone's overall rating with its cost.
When it matters
When you are looking for a smartphone with a good balance between quality and price.
Score distribution
â–¼
<55-66-77-88-99-10
Score components:

70%

6.7

Overall score

30%

9.2

Price

7.5
Processor model
Qualcomm Snapdragon 855
This smartphone uses the Qualcomm Snapdragon 855 processor which is faster than processors in 55.2% of smartphones and equal to processors in 0.9% of smartphones.
Storage type
UFS 2.1
This smartphone uses UFS 2.1 storage, which is slower than the storage in 77.4% of smartphones and the same as in 4.5% of smartphones.
RAM capacity
6 GB
This smartphone has a RAM capacity of 6 GB which is smaller than the RAM capacity of 70.9% of smartphones and equal to that of 10.7% of smartphones.
Internal storage
128 GB
This smartphone has an internal storage capacity of 128 GB which is smaller than the storage of 60.5% of smartphones and equal to that of 28.2% of smartphones.
CPU boost clock speed
2.84 GHz
The CPU boost clock speed of this smartphone is 2.84 GHz which is higher than the boost speed of 68.9% of smartphones and equal to that of 4.6% of smartphones.
Show more
What reviewers say
Operating system
Android
This smartphone runs Android, which is more mainstream than the system in 4.9% of smartphones and the same as in 95.1% of smartphones.
Android version
Android 9 Pie
This smartphone runs Android version Android 9 Pie which is older than that found in 94.1% of smartphones and equal to that in 2.5% of smartphones.
Direct OS updates
no
This smartphone does not support direct OS updates. 19.8% of smartphones offer this.
Promised software updates
?
Open-source OS
yes
This smartphone runs an open-source operating system. 5.3% of smartphones offer this.
Show more
What reviewers say
Multi-lens main camera
yes
This smartphone includes a multi-lens main camera system. 93.9% of smartphones include multi-lens setups.
Main camera megapixels
12 MP & 12 MP & 12 MP
This smartphone has a main camera resolution of 12 MP & 12 MP & 12 MP which is lower than that of 94.9% of smartphones and equal to that of 0.8% of smartphones.
Main camera aperture
f/1.6 & f/2.4 & f/2.4
This smartphone has a main camera aperture of f/1.6 & f/2.4 & f/2.4 which is wider than that of 93.2% of smartphones and equal to that of 0.1% of smartphones.
Main camera sensor area
27 mm²
This smartphone has a main camera sensor area of 27 mm² which is smaller than the main camera sensor area of 70.4% of smartphones.
Main camera pixel size
?
Show more
What reviewers say
Number of SIM slots
2
This smartphone has 2 SIM slots, which is more than in 3.6% of smartphones and equal to the number in 96.3% of smartphones.
Cellular module
yes
This smartphone includes a cellular module. 100% of smartphones include cellular modules.
eSIM support
no
This smartphone does not have eSIM support. 20.6% of smartphones offer this.
5G connectivity
no
This smartphone does not have 5G connectivity. 65.8% of smartphones offer this.
LTE support
yes
This smartphone supports LTE. 99.7% of smartphones include LTE connectivity.
Show more
What reviewers say
Screen size
6.5 inches
This smartphone has a screen size of 6.5 inches which is smaller than the screens of 79.6% of smartphones and equal to those of 3.8% of smartphones.
Screen resolution
1644x 3840 px
This smartphone has a screen resolution of 1644x3840 px which is higher than that of 99.6% of smartphones and equal to that of 0.2% of smartphones.
Pixel density
643 ppi
This smartphone has a pixel density of 643 ppi which is higher than that of 99.6% of smartphones and equal to that of 0.3% of smartphones.
Display type
OLED/AMOLED
This smartphone uses a OLED/AMOLED display type. 57.8% of smartphones use this display technology.
Refresh rate
60 Hz
This smartphone supports a refresh rate of 60 Hz which is lower than in 83.8% of smartphones and equal to that in 16.2% of smartphones.
Show more
What reviewers say
Battery capacity
3,330 mAh
This smartphone has a battery capacity of 3,330 mAh which is smaller than the batteries in 95.2% of smartphones.
Charging speed
18 W
This smartphone supports charging speeds of 18 W which is slower than in 75.3% of smartphones and equal to speeds in 12.1% of smartphones.
Fast charging
yes
This smartphone supports fast charging. 93.4% of smartphones support fast charging.
GSMArena full wired charge time
?
Wireless charging
no
This smartphone does not support wireless charging. 24.8% of smartphones support wireless charging.
Show more
What reviewers say
Stereo speakers
yes
This smartphone includes stereo speakers. 63.6% of smartphones provide stereo audio.
3.5 mm headphone jack
yes
This smartphone includes a 3.5 mm headphone jack. 45.3% of smartphones offer this port.
Number of microphones
2
This smartphone includes 2 microphones, which is more than in 10.2% of smartphones and equal to the number in 66.9% of smartphones.
FM radio
no
This smartphone does not have an FM radio. 34.9% of smartphones offer this.
aptX Lossless
?
Show more
What reviewers say
Height
167 mm
This smartphone has a height of 167 mm which is taller than 78.4% of smartphones and equal to that of 0.4% of smartphones.
Width
72 mm
This smartphone has a width of 72 mm which is narrower than 92% of smartphones and equal to that of 0.9% of smartphones.
Thickness
8.2 mm
This smartphone has a thickness of 8.2 mm which is thinner than 52.2% of smartphones and equal to that of 6% of smartphones.
Weight
178 g
This smartphone weighs 178 g which is lighter than 87.7% of smartphones and equal to the weight of 0.8% of smartphones.
Device volume
98,596.8 cm³
This smartphone has a device volume of 98,596.8 cm³ which is larger than 98% of smartphones.
Show more
What reviewers say

Sony Xperia 1 (128GB) vs the average smartphone

246810TotalPerformanceSoftwareCameraConnectivityDisplayBatteryAudioDesign
  • Higher screen resolution
    This smartphone has a higher screen resolution than the average smartphone (1644x3840 px vs 1080x2400 px). The average smartphone resolution is 1080x2400 px.
    1644x3840 px vs 1080x2400 px
  • Has optical image stabilization
    This smartphone has optical image stabilization (OIS), the average smartphone does not. 47.7% of smartphones feature OIS.
  • 2 x higher optical zoom
    This smartphone offers stronger optical zoom than the average smartphone (2 x vs 0 x). The average smartphone's optical zoom is 0 x.
    2 x vs 0 x
  • 62.8% higher pixel density
    This smartphone has a higher pixel density than the average smartphone (643 ppi vs 395 ppi). The average smartphone has a pixel density of 395 ppi.
    643 ppi vs 395 ppi
  • Supports HDR10 support
    This smartphone supports HDR10, the average smartphone does not. 43.1% of smartphones are HDR10 compatible.
  • Uses a BSI sensor
    This smartphone uses a BSI sensor, the average smartphone does not. 39.5% of smartphones include BSI sensors.
  • Supports RAW photo capture
    This smartphone supports RAW photo capture, the average smartphone does not. 38.2% of smartphones allow RAW files.
  • 18.3% higher CPU boost clock speed
    This smartphone has a higher CPU boost clock speed than the average smartphone (2.8 GHz vs 2.4 GHz). The average smartphone has a boost clock speed of 2.4 GHz.
    2.84 GHz vs 2.4 GHz
  • 26.9% higher sentiment score
    Sentiment score
    9.9/ 10
    ✕
    What it is
    How positive owners are about this model in their comments under video reviews and on forums. We read each comment, keep only people who say they own the model, and sort them into positive, mixed or negative.
    How we count it
    Score: We compare how satisfied this model’s owners are with the other models in this category: the typical model gets 8, the most satisfied tenth 10, the least satisfied 4. This is 80% of the owner mark; the number of owners is the other 20%.
    Enough data: A model counts with 10+ owners from 4+ different discussions. With fewer, the owner part changes nothing.
    Share: Owners count 5% of the overall score (left out in categories where fewer than 10 models have enough owner comments).
    Score distribution
    â–¼
    <55-66-77-88-99-10

    80%

    9.9

    Satisfaction

    20%

    10

    Popularity

    Owners (212)
    212 owners from 25 online discussions
    70% positive
    9% mixed
    21% negative
    Category average: 51% positive
    Our own analysis of online owner opinions, not a rating from any website.
    9.9 vs 7.8
  • 18.3% higher CPU boost clock speed
    This smartphone has a higher CPU boost clock speed than the average smartphone (2.8 GHz vs 2.4 GHz). The average smartphone has a boost clock speed of 2.4 GHz.
    2.84 GHz vs 2.4 GHz
  • Higher CPU base clock speed
    This smartphone has a higher CPU base clock speed than the average smartphone (1x2.84 GHz & 3x2.42 GHz & 4x1.8 GHz vs 2x2.2 GHz & 6x2 GHz). The average smartphone has a base clock speed of 2x2.2 GHz & 6x2 GHz.
    1x2.84 GHz & 3x2.42 GHz & 4x1.8 GHz vs 2x2.2 GHz & 6x2 GHz
  • 2 more memory channels
    This smartphone has more memory channels than the average smartphone (4 vs 2). The average smartphone has 2 memory channels.
    4 vs 2
  • 14.3% higher maximum RAM
    This smartphone supports more maximum RAM than the average smartphone (16 GB vs 14 GB). The average smartphone supports 14 GB RAM.
    16 GB vs 14 GB
  • 2x more shader units
    This smartphone features more shader units than the average smartphone (512 vs 256). The average smartphone has 256 shader units.
    512 vs 256
  • Has optical image stabilization
    This smartphone has optical image stabilization (OIS), the average smartphone does not. 47.7% of smartphones feature OIS.
  • 2 x higher optical zoom
    This smartphone offers stronger optical zoom than the average smartphone (2 x vs 0 x). The average smartphone's optical zoom is 0 x.
    2 x vs 0 x
  • Uses a BSI sensor
    This smartphone uses a BSI sensor, the average smartphone does not. 39.5% of smartphones include BSI sensors.
  • Supports RAW photo capture
    This smartphone supports RAW photo capture, the average smartphone does not. 38.2% of smartphones allow RAW files.
  • Wider main camera aperture
    This smartphone has a wider main camera aperture than the average smartphone (f/1.6 & f/2.4 & f/2.4 vs f/1.8 & f/2.2 & f/2.4 & f/2.4). The average smartphone has a main camera aperture of f/1.8 & f/2.2 & f/2.4 & f/2.4.
    f/1.6 & f/2.4 & f/2.4 vs f/1.8 & f/2.2 & f/2.4 & f/2.4
  • Supports HDR10 video recording
    This smartphone supports HDR10 video recording, the average smartphone does not. 35.5% of smartphones support HDR10.
  • Wider front camera aperture
    This smartphone has a wider front camera aperture than the average smartphone (f/2 vs f/2.2). The average aperture is f/2.2.
    f/2.0 vs f/2.2
  • Newer USB version
    This smartphone supports a newer USB version than the average smartphone (3.1 vs 2). The average version is USB 2.
    3.1 vs 2
  • Has a barometer
    This smartphone features a barometer, the average smartphone does not. 19.9% of smartphones include a barometer.
  • Higher screen resolution
    This smartphone has a higher screen resolution than the average smartphone (1644x3840 px vs 1080x2400 px). The average smartphone resolution is 1080x2400 px.
    1644x3840 px vs 1080x2400 px
  • 62.8% higher pixel density
    This smartphone has a higher pixel density than the average smartphone (643 ppi vs 395 ppi). The average smartphone has a pixel density of 395 ppi.
    643 ppi vs 395 ppi
  • Supports HDR10 support
    This smartphone supports HDR10, the average smartphone does not. 43.1% of smartphones are HDR10 compatible.
  • Supports aptX HD
    This smartphone supports aptX HD, the average smartphone does not. 44% of smartphones include aptX HD support.
  • Has a 3.5 mm headphone jack
    This smartphone features a 3.5 mm headphone jack, the average smartphone does not. 45.3% of smartphones include a standard headphone jack.
  • Supports aptX
    This smartphone supports aptX, the average smartphone does not. 49.2% of smartphones are aptX compatible.
  • 1.5 m deeper water resistance
    This smartphone has a deeper water resistance rating than the average smartphone (1.5 m vs 0 m). The average depth rating is 0 m.
    1.5 m vs 0 m
  • 9.6% lighter
    This smartphone is lighter than the average smartphone (178 g vs 196.8 g). The average smartphone weighs 196.8 g.
    178 g vs 196.8 g
  • 4 mm narrower
    This smartphone is narrower than the average smartphone (72 mm vs 76 mm). The average smartphone width is 76 mm.
    72 mm vs 76 mm
  • 50% lower refresh rate
    This smartphone has a lower refresh rate than the average smartphone (60 Hz vs 120 Hz). The average smartphone has a refresh rate of 120 Hz.
    60 Hz vs 120 Hz
  • No 5G connectivity
    This smartphone does not support 5G connectivity, the average smartphone does. 65.8% of smartphones are 5G compatible.
  • 38.4% slower GPU clock
    This smartphone has a lower GPU frequency than the average smartphone (585 MHz vs 950 MHz). The average smartphone has a GPU frequency of 950 MHz.
    585 MHz vs 950 MHz
  • Lower-resolution main camera
    This smartphone has a lower-resolution main camera than the average smartphone (12 MP & 12 MP & 12 MP vs 50 MP & 8 MP). The average smartphone has a 50 MP & 8 MP main camera.
    12 MP & 12 MP & 12 MP vs 50 MP & 8 MP
  • 33.4% smaller battery capacity
    This smartphone has a smaller battery capacity than the average smartphone (3,330 mAh vs 5,000 mAh). The average smartphone has a capacity of 5,000 mAh.
    3,330 mAh vs 5,000 mAh
  • Slower storage type
    This smartphone has slower storage than the average smartphone (UFS 2.1 vs UFS 3.1).
    UFS 2.1 vs UFS 3.1
  • 50% less storage
    This smartphone offers less internal storage than the average smartphone (128 GB vs 256 GB). The average smartphone includes 256 GB of internal storage.
    128 GB vs 256 GB
  • No live text recognition
    This smartphone does not support live text recognition, the average smartphone does. 52.1% of smartphones offer real-time text recognition.
  • 16.4% lower review score
    Reviews score
    6.1/ 10
    ✕
    What it is
    Average grade from independent test sites, magazines and video reviewers, 1–10.
    How we count it
    Grades: Each review's own score is converted to 1–10; without one, we grade the review ourselves. Big test sites count more, short reviews half as much as full tests. A video review counts half.
    Score: The average grade is 80% of the review mark; the number of reviews is the other 20% (1 review = 5, the typical number in this category = 8, the most-reviewed model = 10).
    Enough data: With few reviews, the average grade is pulled toward the typical grade of this category. No reviews yet: 7.5 for now.
    Share: Reviews count 25% of the overall score.
    Score distribution
    â–¼
    <55-66-77-88-99-10

    6.1

    Mark 7.8 is below the typical mark 7.9 of this category, so it cannot lift the score above the technical score

    80%

    7.6

    Average grade

    20%

    8.6

    Popularity

    Grades by review (42)
    13 reviews: 9 with a printed score, 4 estimated from the review. 29 video reviews, each counting half as much as a written test. Reviews count 25% of the overall score.
    User ratings collected online are not part of this score.
    6.1 vs 7.3
  • 2% worse value for money
    Sony Xperia 1 (128GB) has worse value for money than the average smartphone (7.48 vs 7.6).
    7.48 vs 7.63
  • 38.4% slower GPU clock
    This smartphone has a lower GPU frequency than the average smartphone (585 MHz vs 950 MHz). The average smartphone has a GPU frequency of 950 MHz.
    585 MHz vs 950 MHz
  • Slower storage type
    This smartphone has slower storage than the average smartphone (UFS 2.1 vs UFS 3.1).
    UFS 2.1 vs UFS 3.1
  • 50% less storage
    This smartphone offers less internal storage than the average smartphone (128 GB vs 256 GB). The average smartphone includes 256 GB of internal storage.
    128 GB vs 256 GB
  • 2 GB less RAM
    This smartphone has less RAM than the average smartphone (6 GB vs 8 GB). The average smartphone has 8 GB of RAM.
    6 GB vs 8 GB
  • Worse processor
    This smartphone uses a worse processor than the average smartphone (Qualcomm Snapdragon 855 vs Qualcomm Snapdragon 7 Gen 3).
    Qualcomm Snapdragon 855 vs Qualcomm Snapdragon 7 Gen 3
  • 16.7% larger process node
    This smartphone is manufactured on a larger process node than the average smartphone (7 nm vs 6 nm). The average smartphone uses a 6 nm process.
    7 nm vs 6 nm
  • 50% less L3 cache
    This smartphone has a smaller L3 cache than the average smartphone (2048 KB vs 4,096 KB). The average smartphone has an L3 cache of 4,096 KB.
    2,048 KB vs 4,096 KB
  • 22.4% slower memory speed
    This smartphone has a lower memory speed than the average smartphone (2,133 MHz vs 2,750 MHz). The average smartphone has a memory speed of 2,750 MHz.
    2,133 MHz vs 2,750 MHz
  • 6.1% lower PCMark Work 3.0 Performance benchmark
    This smartphone performs worse in PCMark Work 3.0 than the average smartphone (10,026 vs 10,683). The average smartphone scores 10,683 in PCMark Work 3.0.
    10,026 vs 10,683
  • 20.6% lower 3DMark Wild Life Unlimited benchmark
    This smartphone scores lower in 3DMark Wild Life Unlimited than the average smartphone (3,039 vs 3,826). The average smartphone scores 3,826.
    3,039 vs 3,826
  • 28.4% lower 3DMark Wild Life Extreme benchmark
    This smartphone scores lower in 3DMark Wild Life Extreme than the average smartphone (876 vs 1,224). The average smartphone scores 1,224.
    876 vs 1,224
  • No live text recognition
    This smartphone does not support live text recognition, the average smartphone does. 52.1% of smartphones offer real-time text recognition.
  • Older Android version
    This smartphone runs an older Android version than the average smartphone (Android 9 Pie vs Android 14). The average smartphone runs Android version Android 14.
    Android 9 Pie vs Android 14
  • Lacks app tracking protection
    This smartphone does not have app tracking protection, the average smartphone does. 71.6% of smartphones include app tracking protection.
  • Does not allow app offloading
    This smartphone does not support app offloading, the average smartphone does. 52.7% of smartphones support app offloading to save space.
  • Lower-resolution main camera
    This smartphone has a lower-resolution main camera than the average smartphone (12 MP & 12 MP & 12 MP vs 50 MP & 8 MP). The average smartphone has a 50 MP & 8 MP main camera.
    12 MP & 12 MP & 12 MP vs 50 MP & 8 MP
  • 24.2% lower DxOMark Mobile score
    This smartphone has a lower DxOMark Mobile score than the average smartphone (91 vs 120). The average smartphone scores 120.
    91 vs 120
  • Lower front camera megapixels
    This smartphone has lower front camera megapixels than the average smartphone (8 MP vs 16 MP). The average smartphone has a 16 MP front camera.
    8 MP vs 16 MP
  • 15.6% smaller main camera sensor area
    This smartphone has a smaller main camera sensor area than the average smartphone (27 mm² vs 32 mm²). The average smartphone sensor area is 32 mm².
    27 mm² vs 32 mm²
  • No 5G connectivity
    This smartphone does not support 5G connectivity, the average smartphone does. 65.8% of smartphones are 5G compatible.
  • Older Bluetooth version
    This smartphone uses an older Bluetooth version than the average smartphone (5 vs 5.2). The average smartphone uses Bluetooth 5.2.
    5 vs 5.2
  • 50% lower refresh rate
    This smartphone has a lower refresh rate than the average smartphone (60 Hz vs 120 Hz). The average smartphone has a refresh rate of 120 Hz.
    60 Hz vs 120 Hz
  • 0.17 inches inch smaller screen size
    This smartphone has a smaller screen size than the average smartphone (6.5 inches vs 6.67 inches). The average smartphone has a screen size of 6.67 inches.
    6.5 inches vs 6.67 inches
  • 50% lower touch sampling rate
    This smartphone has a lower touch sampling rate than the average smartphone (120 Hz vs 240 Hz). The average smartphone has a sampling rate of 240 Hz.
    120 Hz vs 240 Hz
  • 229 nits lower GSMArena max display brightness
    This smartphone has a lower GSMArena max display brightness than the average smartphone (665 nits vs 894 nits). The average smartphone scores 894 nits.
    665 nits vs 894 nits
  • 340 nits lower peak brightness
    This smartphone has a lower peak brightness than the average smartphone (660 nits vs 1,000 nits). The average smartphone peak brightness is 1,000 nits.
    in auto brightness mode
    660 nits vs 1,000 nits
  • 33.4% smaller battery capacity
    This smartphone has a smaller battery capacity than the average smartphone (3,330 mAh vs 5,000 mAh). The average smartphone has a capacity of 5,000 mAh.
    3,330 mAh vs 5,000 mAh
  • 20 fewer endurance points
    This smartphone has a lower GSMArena battery endurance score than the average smartphone (79 vs 99). The average smartphone scores 99.
    79 vs 99
  • 49.5% lower PCMark Work 3.0 battery benchmark
    This smartphone scores lower in PCMark Work 3.0 battery benchmark than the average smartphone (401 min vs 794 min). The average smartphone scores 794 min.
    401 min vs 794 min
  • 45.5% slower charging speed
    This smartphone has a slower charging speed than the average smartphone (18 W vs 33 W). The average smartphone charges at 33 W.
    18 W vs 33 W
  • No reverse wired charging
    This smartphone does not support reverse wired charging, the average smartphone does. 62.4% of smartphones support reverse wired charging.
  • Lower IP rating
    This smartphone has a lower IP rating than the average smartphone (IP65/IP68 vs IP67). 0.00% of smartphones have a higher IP rating.
    IP65/IP68 vs IP67
  • 35.4% lower French repairability index
    This smartphone has a lower French repairability index than the average smartphone (5.1 vs 7.9). The average smartphone scores 7.9.
    5.1 vs 7.9
  • 957.25x larger volume
    This smartphone has a larger volume than the average smartphone (98,596.8 cm³ vs 103 cm³). The average smartphone volume is 103 cm³.
    98,596.8 cm³ vs 103 cm³
  • 3.4 mm taller
    This smartphone is taller than the average smartphone (167 mm vs 163.6 mm). The average smartphone has a height of 163.6 mm.
    167 mm vs 163.6 mm

Video reviews

Hands-on testing, unboxing, and real-world video evaluations

8.0
J. Williams
≈ estimated
20/12/2023
Long-term test · 3 months of daily use and video
Verdict
Sony Xperia 1 is a great phone overall, held back by a high price with few discounts and bloatware that cannot be removed.
7.0
OSReviews
≈ estimated
27/10/2023
Revisited review · daily use, gaming and video tests
Verdict
Sony Xperia 1 is a quirky niche phone with a great display but compromises, so it is not for conservative buyers.
9.0
PRISTINE TECH
≈ estimated
08/01/2020
Personal impressions · ongoing use, still relevant
Verdict
Sony Xperia 1 is still relevant and one of the best phones of its year, and the reviewer enjoys using it daily.
7.0
MrMobile [Michael Fisher]
≈ estimated
19/07/2019
Hands-on review · two weeks of use and camera tests
Verdict
Sony Xperia 1 has a great screen and video tools for a narrow audience, but buggy camera software and a steep price limit it.
8.0
Tech Spurt
≈ estimated
08/07/2019
In-depth review · about a month of daily use
Verdict
Sony Xperia 1 is not quite perfect, but it is distinctive, with unique features that help it stand out.
4.0
The Verge
≈ estimated
08/07/2019
Hands-on review · handling, camera and daily use
Verdict
Sony Xperia 1 is an interesting tall phone, but awkward handling and a steep price make it hard to recommend.
9.0
Quick Expert Reviews
≈ estimated
05/07/2019
Ownership update · one month of daily use
Verdict
Sony Xperia 1 is hard to fault, with a great display and Dolby audio, though battery life could be better.
8.0
PhoneArena
≈ estimated
04/07/2019
Long-term review · several weeks of use
Verdict
Sony Xperia 1 is well built with a great screen, but camera software, fingerprint reader and price hold it back.
9.0
GSMArena Official
≈ estimated
13/06/2019
Full review · performance, camera and build tests
Verdict
Sony Xperia 1 is a great phone with all the expected flagship features and strong screen and photo quality, though a few weak points remain.
8.0
Nick Ackerman
≈ estimated
18/07/2019
First look · unboxing and first impressions
Verdict
Sony Xperia 1 is promising so far and may be Sony's best phone yet, with the camera still to be judged.
8.0
Unbox Therapy
≈ estimated
01/07/2019
First impressions · unboxing and first look
Verdict
Sony Xperia 1 looks promising out of the box, but battery life remains unproven and the reviewer is sceptical.
Overview video

Third-party reviews

What customers like about Sony Xperia 1 (128GB)

  • At 178 g it feels light for a 6.5 inch phone.
  • The 643 ppi OLED screen shows sharp text and rich colors.
  • The 2 x optical zoom lets you get closer without cropping.
  • The Snapdragon 855 chip keeps apps and games running fast.
  • 128 GB of storage leaves room for many photos and apps.
  • Its barometer is an uncommon extra for a phone.

What customers don't like about Sony Xperia 1 (128GB)

  • The 3330 mAh battery scored 401 min in a battery benchmark, which is short.
  • Charging at 18 W is slow for a battery this size.
  • The 60 Hz screen makes scrolling look less smooth.
  • At 167 mm tall, it is awkward in a small pocket.
  • There is no app tracking protection and no wireless charging.

Verdict

A 6.5 inch screen at 178 g is rare, and the Sony Xperia 1 (128GB) manages it. Its OLED panel has 643 ppi, so text and photos look crisp. The Snapdragon 855 chip and 6 GB of RAM keep apps and games running fast, and 128 GB of storage gives room for photos. The main camera has three 12 MP lenses and a 2 x optical zoom for closer shots. The trade-off is battery life. The 3330 mAh cell scored 401 min in a battery benchmark, and the 18 W charger takes a while to fill it. The screen also refreshes only at 60 Hz. It suits someone who wants a slim, fast phone for photos and video, and who is ready to top it up during the day.

Compare Sony Xperia 1 (128GB) with other smartphones

1Product to compare no. 1
VS
2Product to compare no. 2
VS
3Product to compare no. 3 (optional)

Graphic comparison of Sony Xperia 1 (128GB) and other smartphones

No results found