Scored using Smartphones Methodology v3.0
Smartphones Methodology v3.0
Mathematical & Unbiased Scoring
Products in this category are scored under Frontum Smartphones Methodology v3.0: the technical score from the specifications is the base, and independent expert and video reviews (up to ±0.5 points), owner opinions (up to ±0.3) and best-of lists (up to +0.3) move it up or down.
Explore Smartphones Methodology v3.0

Samsung Galaxy S25+ review: 196 specs compared

Avg. price:~£740RAM capacity:12 GBInternal storage:256 GBScreen size:6.7 inchesMain camera megapixels:?

Samsung Galaxy S25+ Review: Compare 196 technical specifications, 71 expert and video reviews and 9 best-of lists to see how this product ranks in the Smartphones category and whether it is worth buying.
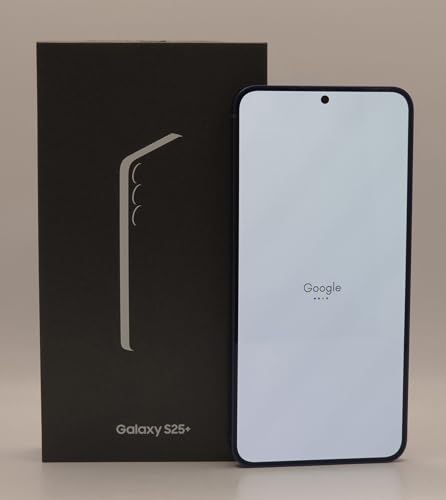
Samsung Galaxy S25+
8.4/10

Overall score

Score
8.4/ 10
✕
What it is
Our main score for this model, 1–10. It combines specs, best-of lists, expert reviews and owners.
How we count it
Parts: Technical score 35%, List score 30%, Reviews score 25%, Sentiment score 10%
Marks: Each part gets a mark out of 10. For reviews, lists and owners, a typical model in this category gets about 8 and the best one gets 10.
No data yet: A part with no data shows "?". It counts as the mark of a weaker model in this category (4 in 5 models with data score higher). This way, models with reviews, lists and owners usually come out ahead.
Score distribution
▼
<55-66-77-88-99-10
Score components

35%

8.1

Technical score

30%

8.2

List score

25%

8.4

Reviews score

10%

10

Sentiment score

★Better than 96% of smartphones
7.9

Value for money

Value for money
7.9/ 10
✕
What it is
An indicator that combines the smartphone's overall rating with its cost.
When it matters
When you are looking for a smartphone with a good balance between quality and price.
Score distribution
▼
<55-66-77-88-99-10
Score components

70%

8.4

Overall score

30%

6.6

Price

▲Better than 70%
8.1

Technical score

Technical score
8.1/ 10
✕
What it is
How good the specs are compared with the other models in this category, 1–10.
How we count it
Areas: We rate the specs in each area against the other models in this category.
Weighting: The areas that matter most to buyers count more. The shares are shown under Score components.
Share: The technical score is 35% of the overall score.
Score distribution
▼
<55-66-77-88-99-10
Score components

25%

8.0

Performance

18%

8.7

Camera

15%

8.2

Display

15%

7.7

Battery

10%

8.9

Software

10%

8.1

Connectivity

4%

5.9

Audio

3%

8.6

Design

▲Better than 89%
8.4

Reviews score

Reviews score
8.4/ 10
✕
What it is
Average grade from independent test sites, magazines and video reviewers, 1–10.
How we count it
Grades: Each review's own score is converted to 1–10; without one, we grade the review ourselves. Big test sites count more, short reviews half as much as full tests. A video review counts half.
Score: The average grade is 80% of the review mark; the number of reviews is the other 20% (1 review = 5, the typical number in this category = 8, the most-reviewed model = 10).
Enough data: With few reviews, the average grade is pulled toward the typical grade of this category. No reviews yet: 7.5 for now.
Share: Reviews count 25% of the overall score.
Score distribution
▼
<55-66-77-88-99-10

80%

8.3

Average grade

20%

9.1

Popularity

Grades by review (71)
26 reviews: 18 with a printed score, 8 estimated from the review. 45 video reviews, each counting half as much as a written test. Reviews count 25% of the overall score.
User ratings collected online are not part of this score.
▲Better than 82%
8.2

List score

List score
8.2/ 10
✕
What it is
How often independent test sites, magazines and video reviewers put this model in their best-of lists for this category.
How we count it
Points: The model in the most lists of this category gets 10; the others get 8 to 10 in proportion. In no list yet: 7.5. Lists count 30% of the overall score.
Enough data: Every list counts, even a single one. With fewer than 5 best-of lists in the category, this part is left out.
Lists with this model (9)
List score: in 9 of 228 lists (4%)
★Better than 96%
  • samsung-galaxy-s25-e10103898
  • samsung-galaxy-s25-e10103898
  • samsung-galaxy-s25-e10103898
  • samsung-galaxy-s25-e10103898
  • samsung-galaxy-s25-e10103898
  • samsung-galaxy-s25-e10103898
samsung-galaxy-s25-e10103898
Where to buy
*As an Amazon Associate, we earn from qualifying purchases.
Available versions:

What reviewers say about the Samsung Galaxy S25+

Based on 26 · 48

Reviewers praise fast performance, good battery life and a comfortable size, but say charging is slow and upgrades over last year are minimal.
Praised
Mixed views
Criticised
Pick a topic to see who said what
Loading...
Loading category ranking...

Technical Specifications of smartphone Samsung Galaxy S25+

Technical score
Technical score
8.1/ 10
✕
What it is
How good the specs are compared with the other models in this category, 1–10.
How we count it
Areas: We rate the specs in each area against the other models in this category.
Weighting: The areas that matter most to buyers count more. The shares are shown under Score components.
Share: The technical score is 35% of the overall score.
Score distribution
▼
<55-66-77-88-99-10
Score components:

25%

8.0

Performance

18%

8.7

Camera

15%

8.2

Display

15%

7.7

Battery

10%

8.9

Software

10%

8.1

Connectivity

4%

5.9

Audio

3%

8.6

Design

8.1
Reviews score
8.4
List score
8.2
Value for money
Value for money
7.9/ 10
✕
What it is
An indicator that combines the smartphone's overall rating with its cost.
When it matters
When you are looking for a smartphone with a good balance between quality and price.
Score distribution
▼
<55-66-77-88-99-10
Score components:

70%

8.4

Overall score

30%

6.6

Price

7.9
Processor model
?
Storage type
?
RAM capacity
12 GB
This smartphone has a RAM capacity of 12 GB which is larger than the RAM capacity of 59.3% of smartphones and equal to that of 24.3% of smartphones.
Internal storage
256 GB
This smartphone has an internal storage capacity of 256 GB which is larger than the storage of 38.9% of smartphones and equal to that of 38.4% of smartphones.
CPU boost clock speed
4.47 GHz
The CPU boost clock speed of this smartphone is 4.47 GHz which is higher than the boost speed of 97.9% of smartphones and equal to that of 0.4% of smartphones.
Show more
What reviewers say
Operating system
Android
This smartphone runs Android, which is more mainstream than the system in 4.8% of smartphones and the same as in 95.2% of smartphones.
Android version
?
Direct OS updates
no
This smartphone does not support direct OS updates. 20.1% of smartphones offer this.
Promised software updates
7 years
This smartphone promises 7 years of software updates, which is longer than 65% of smartphones and equal to 33.9% of smartphones.
Open-source OS
yes
This smartphone runs an open-source operating system. 5.2% of smartphones offer this.
Show more
What reviewers say
Multi-lens main camera
yes
This smartphone includes a multi-lens main camera system. 93.7% of smartphones include multi-lens setups.
Main camera megapixels
?
Main camera aperture
?
Main camera sensor area
?
Main camera pixel size
?
Show more
What reviewers say
Number of SIM slots
2
This smartphone has 2 SIM slots, which is more than in 3.7% of smartphones and equal to the number in 96.2% of smartphones.
Cellular module
yes
This smartphone includes a cellular module. 100% of smartphones include cellular modules.
eSIM support
yes
Samsung Galaxy S25+ has eSIM support. 80.2% of smartphones offer this.
5G connectivity
yes
This smartphone supports 5G connectivity. 66.6% of smartphones support 5G.
LTE support
yes
This smartphone supports LTE. 99.7% of smartphones include LTE connectivity.
Show more
What reviewers say
Screen size
6.7 inches
This smartphone has a screen size of 6.7 inches which is larger than the screens of 51.7% of smartphones and equal to those of 10.1% of smartphones.
Screen resolution
?
Pixel density
513 ppi
This smartphone has a pixel density of 513 ppi which is higher than that of 94.8% of smartphones and equal to that of 0.3% of smartphones.
Display type
?
Refresh rate
120 Hz
This smartphone supports a refresh rate of 120 Hz which is higher than in 34.4% of smartphones and equal to that in 55.6% of smartphones.
Show more
What reviewers say
Battery capacity
?
Charging speed
?
Fast charging
yes
This smartphone supports fast charging. 93.2% of smartphones support fast charging.
GSMArena full wired charge time
?
Wireless charging
yes
This smartphone supports wireless charging. 25.1% of smartphones support wireless charging.
Show more
What reviewers say
Stereo speakers
yes
This smartphone includes stereo speakers. 64.3% of smartphones provide stereo audio.
3.5 mm headphone jack
no
This smartphone does not have a headphone jack. 45.1% of smartphones offer this.
Number of microphones
3
This smartphone includes 3 microphones, which is more than in 77.2% of smartphones and equal to the number in 19.7% of smartphones.
FM radio
no
This smartphone does not have an FM radio. 34.3% of smartphones offer this.
aptX Lossless
no
This smartphone does not support aptX Lossless Bluetooth audio. 12.5% of smartphones offer this.
Show more
Height
158.4 mm
This smartphone has a height of 158.4 mm which is shorter than 84.5% of smartphones and equal to that of 0.3% of smartphones.
Width
75.8 mm
This smartphone has a width of 75.8 mm which is narrower than 53.5% of smartphones and equal to that of 2.9% of smartphones.
Thickness
7.3 mm
This smartphone has a thickness of 7.3 mm which is thinner than 94% of smartphones and equal to that of 1.2% of smartphones.
Weight
?
Device volume
?
Show more
What reviewers say

Samsung Galaxy S25+ vs the average smartphone

246810TotalPerformanceSoftwareCameraConnectivityDisplayBatteryAudioDesign
  • 3 x higher optical zoom
    This smartphone offers stronger optical zoom than the average smartphone (3 x vs 0 x). The average smartphone's optical zoom is 0 x.
    3 x vs 0 x
  • 50% smaller process node
    This smartphone uses a smaller process node than the average smartphone (3 nm vs 6 nm). The average process node size is 6 nm.
    3 nm vs 6 nm
  • 86.3% higher CPU boost clock speed
    This smartphone has a higher CPU boost clock speed than the average smartphone (4.5 GHz vs 2.4 GHz). The average smartphone has a boost clock speed of 2.4 GHz.
    4.47 GHz vs 2.4 GHz
  • Supports wireless charging
    This smartphone supports wireless charging, the average smartphone does not. 25.1% of smartphones are wireless charging compatible.
  • Has optical image stabilization
    This smartphone has optical image stabilization (OIS), the average smartphone does not. 48.4% of smartphones feature OIS.
  • Better main camera video
    This smartphone records better main camera video than the average smartphone. 44.20x of smartphones support 4K or higher.
    4320x30 fps vs 2160x30 fps
  • 29.9% higher pixel density
    This smartphone has a higher pixel density than the average smartphone (513 ppi vs 395 ppi). The average smartphone has a pixel density of 395 ppi.
    513 ppi vs 395 ppi
  • 4 GB more RAM
    This smartphone has more RAM capacity than the average smartphone (12 GB vs 8 GB). The average smartphone has 8 GB of RAM.
    12 GB vs 8 GB
  • 15.1% higher review score
    Reviews score
    8.4/ 10
    ✕
    What it is
    Average grade from independent test sites, magazines and video reviewers, 1–10.
    How we count it
    Grades: Each review's own score is converted to 1–10; without one, we grade the review ourselves. Big test sites count more, short reviews half as much as full tests. A video review counts half.
    Score: The average grade is 80% of the review mark; the number of reviews is the other 20% (1 review = 5, the typical number in this category = 8, the most-reviewed model = 10).
    Enough data: With few reviews, the average grade is pulled toward the typical grade of this category. No reviews yet: 7.5 for now.
    Share: Reviews count 25% of the overall score.
    Score distribution
    ▼
    <55-66-77-88-99-10

    80%

    8.3

    Average grade

    20%

    9.1

    Popularity

    Grades by review (71)
    26 reviews: 18 with a printed score, 8 estimated from the review. 45 video reviews, each counting half as much as a written test. Reviews count 25% of the overall score.
    User ratings collected online are not part of this score.
    8.4 vs 7.3
  • 28.2% higher sentiment score
    10.0 vs 7.8
  • 6.5% higher list score
    List score
    8.2/ 10
    ✕
    What it is
    How often independent test sites, magazines and video reviewers put this model in their best-of lists for this category.
    How we count it
    Points: The model in the most lists of this category gets 10; the others get 8 to 10 in proportion. In no list yet: 7.5. Lists count 30% of the overall score.
    Enough data: Every list counts, even a single one. With fewer than 5 best-of lists in the category, this part is left out.
    Lists with this model (9)
    List score: in 9 of 228 lists (4%)
    8.2 vs 7.7
  • 2.7% better value for money
    Samsung Galaxy S25+ has better value for money than the average smartphone (7.87 vs 7.7).
    7.87 vs 7.66
  • 50% smaller process node
    This smartphone uses a smaller process node than the average smartphone (3 nm vs 6 nm). The average process node size is 6 nm.
    3 nm vs 6 nm
  • 86.3% higher CPU boost clock speed
    This smartphone has a higher CPU boost clock speed than the average smartphone (4.5 GHz vs 2.4 GHz). The average smartphone has a boost clock speed of 2.4 GHz.
    4.47 GHz vs 2.4 GHz
  • 4 GB more RAM
    This smartphone has more RAM capacity than the average smartphone (12 GB vs 8 GB). The average smartphone has 8 GB of RAM.
    12 GB vs 8 GB
  • Newer DDR memory version
    This smartphone supports a newer DDR version than the average smartphone (5 vs 4). The average DDR version is 4.
    5 vs 4
  • 2x more L3 cache
    This smartphone has more L3 cache than the average smartphone (8,192 KB vs 4,096 KB). The average L3 cache is 4,096 KB.
    8,192 KB vs 4,096 KB
  • Supports newer OpenCL version
    This smartphone supports a newer OpenCL version than the average smartphone (3 vs 2). The average version is 2.
    3 vs 2
  • Includes cross-site tracking protection
    This smartphone supports cross-site tracking prevention, the average smartphone does not. 31.9% of smartphones include this feature.
  • Supports desktop mode
    This smartphone includes desktop mode, the average smartphone does not. 9.4% of smartphones support desktop functionality.
  • 3 x higher optical zoom
    This smartphone offers stronger optical zoom than the average smartphone (3 x vs 0 x). The average smartphone's optical zoom is 0 x.
    3 x vs 0 x
  • Has optical image stabilization
    This smartphone has optical image stabilization (OIS), the average smartphone does not. 48.4% of smartphones feature OIS.
  • Better main camera video
    This smartphone records better main camera video than the average smartphone. 44.20x of smartphones support 4K or higher.
    4320x30 fps vs 2160x30 fps
  • Supports RAW photo capture
    This smartphone supports RAW photo capture, the average smartphone does not. 37.3% of smartphones allow RAW files.
  • Supports HDR10 video recording
    This smartphone supports HDR10 video recording, the average smartphone does not. 35.7% of smartphones support HDR10.
  • Newer USB version
    This smartphone supports a newer USB version than the average smartphone (3.2 vs 2). The average version is USB 2.
    3.2 vs 2
  • Supports eSIM
    Samsung Galaxy S25+ supports eSIM, while the average smartphone does not. 19.9% of smartphones support eSIM.
  • Newer Bluetooth version
    This smartphone supports a newer Bluetooth version than the average smartphone (5.4 vs 5.2). The average version is Bluetooth 5.2.
    5.4 vs 5.2
  • Has a barometer
    This smartphone features a barometer, the average smartphone does not. 19.7% of smartphones include a barometer.
  • 29.9% higher pixel density
    This smartphone has a higher pixel density than the average smartphone (513 ppi vs 395 ppi). The average smartphone has a pixel density of 395 ppi.
    513 ppi vs 395 ppi
  • Supports HDR10 support
    This smartphone supports HDR10, the average smartphone does not. 42.6% of smartphones are HDR10 compatible.
  • Has an always-on display
    This smartphone features an always-on display, the average smartphone does not. 49.1% of smartphones offer always-on functionality.
  • 0.03 inches inch larger screen size
    This smartphone has a larger screen size than the average smartphone (6.7 inches vs 6.67 inches). The average smartphone screen is 6.67 inches.
    6.7 inches vs 6.67 inches
  • Supports wireless charging
    This smartphone supports wireless charging, the average smartphone does not. 25.1% of smartphones are wireless charging compatible.
  • Supports reverse wireless charging
    This smartphone supports reverse wireless charging, the average smartphone does not. 23.4% of smartphones offer reverse wireless charging.
  • 1 more microphone/s
    This smartphone has more microphones than the average smartphone (3 vs 2). The average smartphone has 2 microphones.
    3 vs 2
  • 1.5 m deeper water resistance
    This smartphone has a deeper water resistance rating than the average smartphone (1.5 m vs 0 m). The average depth rating is 0 m.
    1.5 m vs 0 m
  • 1 mm thinner
    This smartphone is thinner than the average smartphone (7.3 mm vs 8.3 mm). The average smartphone thickness is 8.3 mm.
    7.3 mm vs 8.3 mm
  • 5.2 mm shorter
    This smartphone is shorter than the average smartphone (158.4 mm vs 163.6 mm). The average smartphone height is 163.6 mm.
    158.4 mm vs 163.6 mm
  • Better IP rating
    This smartphone has a better IP rating than the average smartphone (IP68 vs IP67). The average IP rating is IP67.
    IP68 vs IP67
  • No memory card slot
    This smartphone does not have a memory card slot, the average smartphone does. 53.7% of smartphones feature expandable storage.
  • No aptX HD
    This smartphone does not support aptX HD, the average smartphone does. 50.2% of smartphones support aptX HD.
  • No reverse wired charging
    This smartphone does not support reverse wired charging, the average smartphone does. 61.5% of smartphones support reverse wired charging.
  • 25% slower wireless charging speed
    This smartphone has a slower wireless charging speed than the average smartphone (15 W vs 20 W). The average smartphone wireless charging speed is 20 W.
    15 W vs 20 W
  • 2.85x more expensive
    Samsung Galaxy S25+ is more expensive than the average smartphone (£740 vs £260).
    £740 vs £260
  • 10% slower reverse wireless charging speed
    This smartphone has a slower reverse wireless charging speed than the average smartphone (4.5 W vs 5 W). The average smartphone speed is 5 W.
    4.5 W vs 5 W
  • 2.85x more expensive
    Samsung Galaxy S25+ is more expensive than the average smartphone (£740 vs £260).
    £740 vs £260
  • No memory card slot
    This smartphone does not have a memory card slot, the average smartphone does. 53.7% of smartphones feature expandable storage.
  • No reverse wired charging
    This smartphone does not support reverse wired charging, the average smartphone does. 61.5% of smartphones support reverse wired charging.
  • 25% slower wireless charging speed
    This smartphone has a slower wireless charging speed than the average smartphone (15 W vs 20 W). The average smartphone wireless charging speed is 20 W.
    15 W vs 20 W
  • 10% slower reverse wireless charging speed
    This smartphone has a slower reverse wireless charging speed than the average smartphone (4.5 W vs 5 W). The average smartphone speed is 5 W.
    4.5 W vs 5 W
  • No aptX HD
    This smartphone does not support aptX HD, the average smartphone does. 50.2% of smartphones support aptX HD.

Video reviews

Hands-on testing, unboxing, and real-world video evaluations

Not graded yet
Not graded yet
Not graded yet
Not graded yet
Not graded yet
Not graded yet
Not graded yet
Not graded yet
Not graded yet
Not graded yet
Not graded yet
Not graded yet

Third-party reviews

What customers like about Samsung Galaxy S25+

  • Vibrant and extremely bright 6.7-inch QHD+ AMOLED display with 2600 nits peak brightness
  • Blazing-fast performance powered by the Snapdragon 8 Elite processor and 12GB of RAM
  • Exceptional battery life that often outlasts the S25 Ultra in real-world endurance tests
  • Thinner and lighter design (approx. 190g) makes it more comfortable to hold than previous models
  • Industry-leading software commitment with seven years of OS and security updates
  • Practical Galaxy AI features like AI Select, Audio Eraser, and improved real-time translation
  • Consistent and reliable camera quality for everyday photography and 8K video recording

What customers don't like about Samsung Galaxy S25+

  • Highly iterative design and hardware specs that offer few major changes over the S24 Plus
  • Charging speed (45W) still lags significantly behind competitors like OnePlus
  • No major hardware upgrades to the camera sensors compared to the previous generation
  • Lacks the superior anti-reflective 'Gorilla Armor' glass found on the S25 Ultra
  • Pre-installed bloatware continues to be a point of frustration for many users
  • Missing specialized features like the S Pen or advanced periscope zoom found on the Ultra model
  • Ultra-wide camera lacks autofocus, limiting its versatility for macro or close-up shots

Verdict

The 513 ppi screen is the first thing you notice on the Samsung Galaxy S25+, with text and photos that look crisp. A 4.47 GHz processor on a 3 nm chip keeps apps and games quick, and 12 GB of RAM keeps many apps open at once. The 3 x optical zoom gets closer to distant subjects, and three microphones help voice and video sound clear. Wireless charging at 15 W is easy to use. The trade-off is reverse charging, which runs at only 4.5 W, so topping up a device on its back takes a while. eSIM support lets you add a plan without a card. It suits a buyer who wants a very sharp screen, strong performance and good zoom, and who does not expect much from reverse charging.

Compare Samsung Galaxy S25+ with other smartphones

1Product to compare no. 1
VS
2Product to compare no. 2
VS
3Product to compare no. 3 (optional)

Graphic comparison of Samsung Galaxy S25+ and other smartphones

No results found