Scored using Smartphones Methodology v3.0
Smartphones Methodology v3.0
Mathematical & Unbiased Scoring
Products in this category are scored under Frontum Smartphones Methodology v3.0: the technical score from the specifications is the base, and independent expert and video reviews (up to ±0.5 points), owner opinions (up to ±0.3) and best-of lists (up to +0.3) move it up or down.
Explore Smartphones Methodology v3.0

Oppo Reno8 4G (8GB + 256GB) review: 196 specs compared

Avg. price:~£210RAM capacity:8 GBInternal storage:256 GBScreen size:6.43 inchesMain camera megapixels:64 MP & 2 MP & 2 MP

Oppo Reno8 4G (8GB + 256GB) Review: Compare 196 technical specifications and 1 expert and video reviews to see how this product ranks in the Smartphones category and whether it is worth buying.
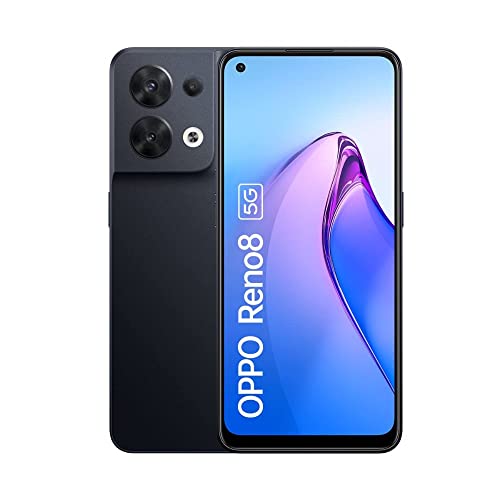
Oppo Reno8 4G (8GB + 256GB)
6.5/10

Overall score

Score
6.5/ 10
✕
What it is
Our main score for this model, 1–10. It combines specs, best-of lists, expert reviews and owners.
How we count it
Parts: Technical score 40%, List score 30%, Reviews score 25%, Sentiment score 5%
Marks: Each part gets a mark out of 10. For reviews, lists and owners, a typical model in this category gets about 8 and the best one gets 10.
No data yet: A part with no data shows "?". It counts as the mark of a weaker model in this category (4 in 5 models with data score higher). This way, models with reviews, lists and owners usually come out ahead.
Score distribution
â–¼
<55-66-77-88-99-10
Score components

40%

6.1

Technical score

30%

?

List scoreNot enough data yet, so we use 7.5, the mark of a weaker model in this category

25%

6.1

Reviews score

5%

5.5

Sentiment score

â–¼Worse than 86% of smartphones
7.4

Value for money

Value for money
7.4/ 10
✕
What it is
An indicator that combines the smartphone's overall rating with its cost.
When it matters
When you are looking for a smartphone with a good balance between quality and price.
Score distribution
â–¼
<55-66-77-88-99-10
Score components

70%

6.5

Overall score

30%

9.4

Price

â–¼Worse than 77%
6.1

Technical score

Technical score
6.1/ 10
✕
What it is
How good the specs are compared with the other models in this category, 1–10.
How we count it
Areas: We rate the specs in each area against the other models in this category.
Weighting: The areas that matter most to buyers count more. The shares are shown under Score components.
Share: The technical score is 40% of the overall score.
Score distribution
â–¼
<55-66-77-88-99-10
Score components

25%

6.0

Performance

18%

6.3

Camera

15%

5.2

Display

15%

5.7

Battery

10%

7.7

Software

10%

6.6

Connectivity

4%

4.7

Audio

3%

8.3

Design

â–¼Worse than 71%
6.1

Reviews score

Reviews score
6.1/ 10
✕
What it is
Average grade from independent test sites, magazines and video reviewers, 1–10.
How we count it
Grades: Each review's own score is converted to 1–10; without one, we grade the review ourselves. Big test sites count more, short reviews half as much as full tests. A video review counts half.
Score: The average grade is 80% of the review mark; the number of reviews is the other 20% (1 review = 5, the typical number in this category = 8, the most-reviewed model = 10).
Enough data: With few reviews, the average grade is pulled toward the typical grade of this category. No reviews yet: 7.5 for now.
Share: Reviews count 25% of the overall score.
Score distribution
â–¼
<55-66-77-88-99-10

6.1

Mark 7.2 is below the typical mark 7.9 of this category, so it cannot lift the score above the technical score

80%

7.7

Average grade

20%

5.0

Popularity

Grades by review (1)
1 video review, counting half as much as a written test. Reviews count 25% of the overall score.
User ratings collected online are not part of this score.
â–¼Worse than 82%
?

List score

List score
7.5/ 10
✕
What it is
How often independent test sites, magazines and video reviewers put this model in their best-of lists for this category.
How we count it
Points: The model in the most lists of this category gets 10; the others get 8 to 10 in proportion. In no list yet: 7.5. Lists count 30% of the overall score.
Enough data: Every list counts, even a single one. With fewer than 5 best-of lists in the category, this part is left out.
Lists with this model (0)
Not in any best-of list yet, so this part counts as 7.5. Models in a list get 8 to 10.
Not in any best-of list yet

What owners say about the Oppo Reno8 4G (8GB + 256GB)

Based on 82 owners sharing their experience in online comments

18%positive10%mixed72%negative

Owners praise battery life and casual gaming, but most are frustrated by consistently poor, blurry cameras and missing features.

What owners dislike

  • Owners who upgraded from a Reno 4, 5 or 6 say the Reno 8 takes worse photos than their old phone.13
  • Many owners say photos and videos look blurry and grainy, with speckled dots across the image.13
  • In dim or night conditions, photos and video calls turn noisy and blurry, with grainy speckles and dark results.10
  • Selfies look blurry and speckled, especially in dim light, and the front camera is slow to respond.9
  • Video calls look blurry and unnatural, with pale skin and dark lips or eyes, and they look worse at night.5
  • No ultra-wide camera and no Ultra Steady video stabilisation, and video feels unstable because the 30 and 60 fps modes are missing.5
  • Some owners say the battery runs out quickly and feels wasteful, even after only a couple of days of use.4
  • Photos and videos look sharp on the phone but turn blurry or pixelated after posting to Instagram or WhatsApp, or sending to another phone.4
  • Owners feel the specs do not match the price: the phone heats up and needs old apps and photos deleted to run well.4
  • Owners report frequent lag, apps closing on their own, and late notifications, and some say it lags after only a week.3

Points mentioned by at least 3 owners, most mentioned first.

Loading...
Loading category ranking...

Technical Specifications of smartphone Oppo Reno8 4G (8GB + 256GB)

Technical score
Technical score
6.1/ 10
✕
What it is
How good the specs are compared with the other models in this category, 1–10.
How we count it
Areas: We rate the specs in each area against the other models in this category.
Weighting: The areas that matter most to buyers count more. The shares are shown under Score components.
Share: The technical score is 40% of the overall score.
Score distribution
â–¼
<55-66-77-88-99-10
Score components:

25%

6.0

Performance

18%

6.3

Camera

15%

5.2

Display

15%

5.7

Battery

10%

7.7

Software

10%

6.6

Connectivity

4%

4.7

Audio

3%

8.3

Design

6.1
Reviews score
6.1
List score
?
Value for money
Value for money
7.4/ 10
✕
What it is
An indicator that combines the smartphone's overall rating with its cost.
When it matters
When you are looking for a smartphone with a good balance between quality and price.
Score distribution
â–¼
<55-66-77-88-99-10
Score components:

70%

6.5

Overall score

30%

9.4

Price

7.4
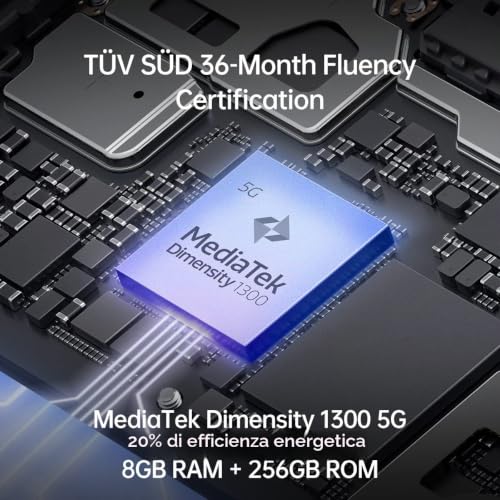
Processor model
Qualcomm Snapdragon 680 4G
This smartphone uses the Qualcomm Snapdragon 680 4G processor model which is slower than processors in 73.9% of smartphones and equal to processors in 1.5% of smartphones.
Storage type
?
RAM capacity
8 GB
This smartphone has a RAM capacity of 8 GB which is larger than the RAM capacity of 28.7% of smartphones and equal to that of 30.5% of smartphones.
Internal storage
256 GB
This smartphone has an internal storage capacity of 256 GB which is larger than the storage of 38.9% of smartphones and equal to that of 38.4% of smartphones.
CPU boost clock speed
2.4 GHz
The CPU boost clock speed of this smartphone is 2.4 GHz which is higher than the boost speed of 37.1% of smartphones and equal to that of 13.3% of smartphones.
Show more
Operating system
Android
This smartphone runs Android, which is more mainstream than the system in 4.8% of smartphones and the same as in 95.2% of smartphones.
Android 12
Android version
Android 12
This smartphone runs Android version Android 12 which is older than that found in 67.1% of smartphones and equal to that in 13.1% of smartphones.
Direct OS updates
no
This smartphone does not support direct OS updates. 20.1% of smartphones offer this.
Promised software updates
?
Open-source OS
yes
This smartphone runs an open-source operating system. 5.2% of smartphones offer this.
Show more
Multi-lens main camera
yes
This smartphone includes a multi-lens main camera system. 93.7% of smartphones include multi-lens setups.
Main camera megapixels
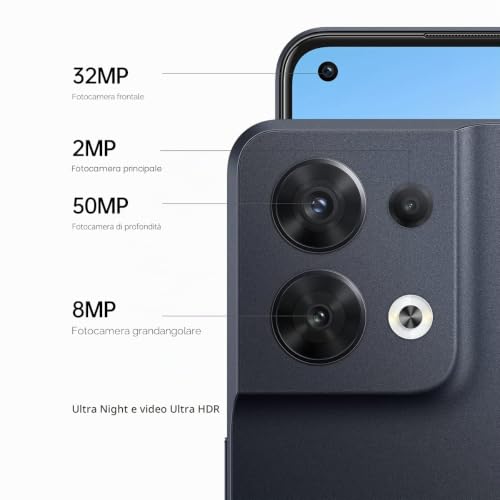
64 MP & 2 MP & 2 MP
This smartphone has a main camera resolution of 64 MP & 2 MP & 2 MP which is higher than that of 76.6% of smartphones and equal to that of 0.7% of smartphones.
Main camera aperture
f/1.7 & f/2.4 & f/3.3
This smartphone has a main camera aperture of f/1.7 & f/2.4 & f/3.3 which is wider than that of 82.1% of smartphones and equal to that of 0.2% of smartphones.
Main camera sensor area
31.4 mm²
This smartphone has a main camera sensor area of 31.4 mm² which is smaller than the main camera sensor area of 57.4% of smartphones and equal to that of 5.8% of smartphones.
Main camera pixel size
0.7 µm
This smartphone has a main camera pixel size of 0.7 µm which is smaller than in 64.6% of smartphones and equal to the size in 10.4% of smartphones.
1.4 binned
Show more
Number of SIM slots
2
This smartphone has 2 SIM slots, which is more than in 3.7% of smartphones and equal to the number in 96.2% of smartphones.
Cellular module
yes
This smartphone includes a cellular module. 100% of smartphones include cellular modules.
eSIM support
no
This smartphone does not have eSIM support. 19.9% of smartphones offer this.
5G connectivity
no
This smartphone does not have 5G connectivity. 66.7% of smartphones offer this.
LTE support
yes
This smartphone supports LTE. 99.7% of smartphones include LTE connectivity.
Show more
Screen size
6.43 inches
This smartphone has a screen size of 6.43 inches which is smaller than the screens of 85% of smartphones and equal to those of 1.4% of smartphones.
Screen resolution
1080x 2400 px
This smartphone has a screen resolution of 1080x2400 px which is higher than that of 36.3% of smartphones and equal to that of 20.4% of smartphones.
Pixel density
409 ppi
This smartphone has a pixel density of 409 ppi which is higher than that of 66.6% of smartphones and equal to that of 2.4% of smartphones.
Display type
OLED/AMOLED
This smartphone uses a OLED/AMOLED display type. 58.4% of smartphones use this display technology.
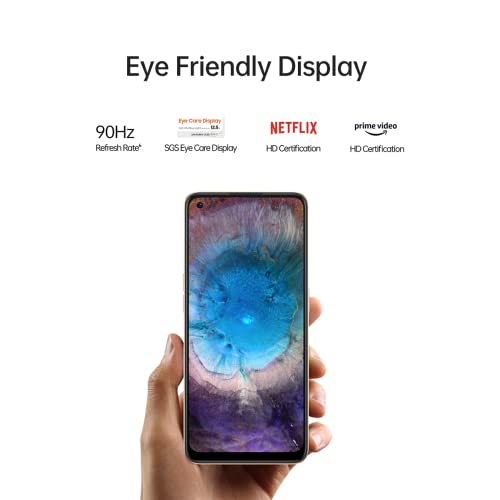
Refresh rate
90 Hz
This smartphone supports a refresh rate of 90 Hz which is lower than in 65.7% of smartphones and equal to that in 18.6% of smartphones.
Show more
Battery capacity
4,500 mAh
This smartphone has a battery capacity of 4,500 mAh which is smaller than the batteries in 78.6% of smartphones and equal to those in 5.9% of smartphones.
Charging speed
33 W
This smartphone supports charging speeds of 33 W which is faster than in 38.9% of smartphones and equal to speeds in 12% of smartphones.
Fast charging
yes
This smartphone supports fast charging. 93.2% of smartphones support fast charging.
GSMArena full wired charge time
?
Wireless charging
no
This smartphone does not support wireless charging. 25.1% of smartphones support wireless charging.
Show more
Stereo speakers
no
This smartphone does not have stereo speakers. 64.3% of smartphones offer this.
3.5 mm headphone jack
yes
This smartphone includes a 3.5 mm headphone jack. 45.1% of smartphones offer this port.
Number of microphones
2
This smartphone includes 2 microphones, which is more than in 10.3% of smartphones and equal to the number in 66.9% of smartphones.
FM radio
no
This smartphone does not have an FM radio. 34.3% of smartphones offer this.
aptX Lossless
no
This smartphone does not support aptX Lossless Bluetooth audio. 12.5% of smartphones offer this.
Show more
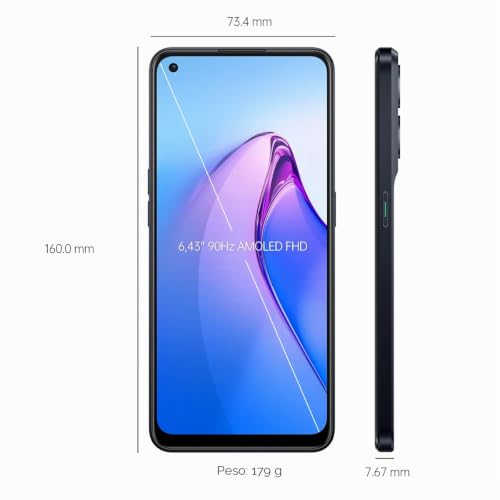
Height
159.9 mm
This smartphone has a height of 159.9 mm which is shorter than 80.5% of smartphones and equal to that of 0.7% of smartphones.
Width
73.2 mm
This smartphone has a width of 73.2 mm which is narrower than 89% of smartphones and equal to that of 0.6% of smartphones.
Thickness
7.7 mm
This smartphone has a thickness of 7.7 mm which is thinner than 82.1% of smartphones and equal to that of 2.8% of smartphones.
Weight
182 g
This smartphone weighs 182 g which is lighter than 83.3% of smartphones and equal to the weight of 0.8% of smartphones.
Device volume
90 cm³
This smartphone has a device volume of 90 cm³ which is smaller than 88.8% of smartphones and equal to that of 1% of smartphones.
Show more

Oppo Reno8 4G (8GB + 256GB) vs the average smartphone

246810TotalPerformanceSoftwareCameraConnectivityDisplayBatteryAudioDesign
  • Higher-resolution main camera
    This smartphone has a higher main camera resolution than the average smartphone (64 MP & 2 MP & 2 MP vs 50 MP & 8 MP). The average smartphone main camera has 50 MP & 8 MP megapixels.
    64 MP & 2 MP & 2 MP vs 50 MP & 8 MP
  • 3.5% higher pixel density
    This smartphone has a higher pixel density than the average smartphone (409 ppi vs 395 ppi). The average smartphone has a pixel density of 395 ppi.
    409 ppi vs 395 ppi
  • Higher front camera megapixels
    This smartphone has more front camera megapixels than the average smartphone (32 MP vs 16 MP). The average front camera has 16 MP megapixels.
    32 MP vs 16 MP
  • Has a 3.5 mm headphone jack
    This smartphone features a 3.5 mm headphone jack, the average smartphone does not. 45.1% of smartphones include a standard headphone jack.
  • 2.8 mm narrower
    This smartphone is narrower than the average smartphone (73.2 mm vs 76 mm). The average smartphone width is 76 mm.
    73.2 mm vs 76 mm
  • 7.2% lighter
    This smartphone is lighter than the average smartphone (182 g vs 196.2 g). The average smartphone weighs 196.2 g.
    182 g vs 196.2 g
  • 47.5% higher 3DMark Wild Life benchmark
    This smartphone scores higher in 3DMark Wild Life than the average smartphone (4,594 vs 3,115). The average smartphone scores 3,115.
    4,594 vs 3,115
  • Supports aptX
    This smartphone supports aptX, the average smartphone does not. 49.5% of smartphones are aptX compatible.
  • 47.5% higher 3DMark Wild Life benchmark
    This smartphone scores higher in 3DMark Wild Life than the average smartphone (4,594 vs 3,115). The average smartphone scores 3,115.
    4,594 vs 3,115
  • Higher CPU base clock speed
    This smartphone has a higher CPU base clock speed than the average smartphone (4x2.4 GHz & 4x1.9 GHz vs 2x2.2 GHz & 6x2 GHz). The average smartphone has a base clock speed of 2x2.2 GHz & 6x2 GHz.
    4x2.4 GHz & 4x1.9 GHz vs 2x2.2 GHz & 6x2 GHz
  • 25.5% higher Geekbench 6 multi-core benchmark score
    This smartphone scores better in Geekbench 6 multi-core than the average smartphone (3,180 vs 2,533). The average smartphone scores 2,533 in multi-core.
    3,180 vs 2,533
  • 18.8% higher 3DMark Wild Life Unlimited benchmark
    This smartphone scores higher in 3DMark Wild Life Unlimited than the average smartphone (4,547 vs 3,827). The average smartphone scores 3,827.
    4,547 vs 3,827
  • Higher-resolution main camera
    This smartphone has a higher main camera resolution than the average smartphone (64 MP & 2 MP & 2 MP vs 50 MP & 8 MP). The average smartphone main camera has 50 MP & 8 MP megapixels.
    64 MP & 2 MP & 2 MP vs 50 MP & 8 MP
  • Higher front camera megapixels
    This smartphone has more front camera megapixels than the average smartphone (32 MP vs 16 MP). The average front camera has 16 MP megapixels.
    32 MP vs 16 MP
  • Wider main camera aperture
    This smartphone has a wider main camera aperture than the average smartphone (f/1.7 & f/2.4 & f/3.3 vs f/1.8 & f/2.2 & f/2.4 & f/2.4). The average smartphone has a main camera aperture of f/1.8 & f/2.2 & f/2.4 & f/2.4.
    f/1.7 & f/2.4 & f/3.3 vs f/1.8 & f/2.2 & f/2.4 & f/2.4
  • 3.5% higher pixel density
    This smartphone has a higher pixel density than the average smartphone (409 ppi vs 395 ppi). The average smartphone has a pixel density of 395 ppi.
    409 ppi vs 395 ppi
  • Has a 3.5 mm headphone jack
    This smartphone features a 3.5 mm headphone jack, the average smartphone does not. 45.1% of smartphones include a standard headphone jack.
  • Supports aptX
    This smartphone supports aptX, the average smartphone does not. 49.5% of smartphones are aptX compatible.
  • 7.2% lighter
    This smartphone is lighter than the average smartphone (182 g vs 196.2 g). The average smartphone weighs 196.2 g.
    182 g vs 196.2 g
  • 2.8 mm narrower
    This smartphone is narrower than the average smartphone (73.2 mm vs 76 mm). The average smartphone width is 76 mm.
    73.2 mm vs 76 mm
  • 0.6 mm thinner
    This smartphone is thinner than the average smartphone (7.7 mm vs 8.3 mm). The average smartphone thickness is 8.3 mm.
    7.7 mm vs 8.3 mm
  • 11.8% smaller volume
    This smartphone has a smaller device volume than the average smartphone (90 cm³ vs 102 cm³). The average smartphone volume is 102 cm³.
    90 cm³ vs 102 cm³
  • 3.7 mm shorter
    This smartphone is shorter than the average smartphone (159.9 mm vs 163.6 mm). The average smartphone height is 163.6 mm.
    159.9 mm vs 163.6 mm
  • Worse processor
    This smartphone uses a worse processor than the average smartphone (Qualcomm Snapdragon 680 4G vs Qualcomm Snapdragon 7 Gen 3).
    Qualcomm Snapdragon 680 4G vs Qualcomm Snapdragon 7 Gen 3
  • No ultrawide rear camera
    This smartphone does not have an ultrawide rear camera, while the average smartphone does. 62.6% of smartphones offer this.
  • No 5G connectivity
    This smartphone does not support 5G connectivity, the average smartphone does. 66.6% of smartphones are 5G compatible.
  • Worse main camera video quality
    This smartphone records worse main camera video than the average smartphone. 11.80x of smartphones support 4K video recording.
    1080x30 fps vs 2160x30 fps
  • 25% lower refresh rate
    This smartphone has a lower refresh rate than the average smartphone (90 Hz vs 120 Hz). The average smartphone has a refresh rate of 120 Hz.
    90 Hz vs 120 Hz
  • No stereo speakers
    This smartphone does not have stereo speakers, the average smartphone does. 64.3% of smartphones feature stereo speakers.
  • 16.4% lower review score
    Reviews score
    6.1/ 10
    ✕
    What it is
    Average grade from independent test sites, magazines and video reviewers, 1–10.
    How we count it
    Grades: Each review's own score is converted to 1–10; without one, we grade the review ourselves. Big test sites count more, short reviews half as much as full tests. A video review counts half.
    Score: The average grade is 80% of the review mark; the number of reviews is the other 20% (1 review = 5, the typical number in this category = 8, the most-reviewed model = 10).
    Enough data: With few reviews, the average grade is pulled toward the typical grade of this category. No reviews yet: 7.5 for now.
    Share: Reviews count 25% of the overall score.
    Score distribution
    â–¼
    <55-66-77-88-99-10

    6.1

    Mark 7.2 is below the typical mark 7.9 of this category, so it cannot lift the score above the technical score

    80%

    7.7

    Average grade

    20%

    5.0

    Popularity

    Grades by review (1)
    1 video review, counting half as much as a written test. Reviews count 25% of the overall score.
    User ratings collected online are not part of this score.
    6.1 vs 7.3
  • 0.24 inches inch smaller screen size
    This smartphone has a smaller screen size than the average smartphone (6.4 inches vs 6.67 inches). The average smartphone has a screen size of 6.67 inches.
    6.43 inches vs 6.67 inches
  • 16.4% lower review score
    Reviews score
    6.1/ 10
    ✕
    What it is
    Average grade from independent test sites, magazines and video reviewers, 1–10.
    How we count it
    Grades: Each review's own score is converted to 1–10; without one, we grade the review ourselves. Big test sites count more, short reviews half as much as full tests. A video review counts half.
    Score: The average grade is 80% of the review mark; the number of reviews is the other 20% (1 review = 5, the typical number in this category = 8, the most-reviewed model = 10).
    Enough data: With few reviews, the average grade is pulled toward the typical grade of this category. No reviews yet: 7.5 for now.
    Share: Reviews count 25% of the overall score.
    Score distribution
    â–¼
    <55-66-77-88-99-10

    6.1

    Mark 7.2 is below the typical mark 7.9 of this category, so it cannot lift the score above the technical score

    80%

    7.7

    Average grade

    20%

    5.0

    Popularity

    Grades by review (1)
    1 video review, counting half as much as a written test. Reviews count 25% of the overall score.
    User ratings collected online are not part of this score.
    6.1 vs 7.3
  • 29.5% lower sentiment score
    5.5 vs 7.8
  • 4.1% worse value for money
    Oppo Reno8 4G (8GB + 256GB) has worse value for money than the average smartphone (7.36 vs 7.7).
    7.36 vs 7.66
  • Worse processor
    This smartphone uses a worse processor than the average smartphone (Qualcomm Snapdragon 680 4G vs Qualcomm Snapdragon 7 Gen 3).
    Qualcomm Snapdragon 680 4G vs Qualcomm Snapdragon 7 Gen 3
  • 42.9% lower maximum RAM capacity
    This smartphone supports less maximum RAM than the average smartphone (8 GB vs 14 GB). The average smartphone supports 14 GB of RAM.
    8 GB vs 14 GB
  • 11.1% slower GPU clock
    This smartphone has a lower GPU frequency than the average smartphone (845 MHz vs 950 MHz). The average smartphone has a GPU frequency of 950 MHz.
    845 MHz vs 950 MHz
  • 41.8% lower memory bandwidth
    This smartphone has lower memory bandwidth than the average smartphone (14.9 GB/s vs 25.6 GB/s). The average smartphone has a bandwidth of 25.6 GB/s.
    14.9 GB/s vs 25.6 GB/s
  • 22.4% slower memory speed
    This smartphone has a lower memory speed than the average smartphone (2,133 MHz vs 2,750 MHz). The average smartphone has a memory speed of 2,750 MHz.
    2,133 MHz vs 2,750 MHz
  • 2 year/s older release date
    This smartphone is an older model than the average smartphone (2022 vs 2024). 2.00% of smartphones were released more recently.
    August 2022
    2022 vs 2024
  • 50% fewer shader units
    This smartphone includes fewer shader units than the average smartphone (128 vs 256). The average smartphone has 256 shader units.
    128 vs 256
  • Lacks focus mode
    This smartphone does not have a focus mode, the average smartphone does. 60.8% of smartphones include a dedicated focus mode.
  • No Wi-Fi password sharing
    This smartphone does not support Wi-Fi password sharing, the average smartphone does. 58.3% of smartphones allow easy Wi-Fi sharing.
  • No battery health monitoring
    This smartphone lacks battery health monitoring, the average smartphone includes it. 67.2% of smartphones provide battery health stats.
  • Older Android version
    This smartphone runs an older Android version than the average smartphone (Android 12 vs Android 14). The average smartphone runs Android version Android 14.
    Android 12 vs Android 14
  • Lacks instant markup
    This smartphone does not support instant markup, the average smartphone does. 52.5% of smartphones include instant markup tools.
  • Does not allow app offloading
    This smartphone does not support app offloading, the average smartphone does. 52.5% of smartphones support app offloading to save space.
  • No ultrawide rear camera
    This smartphone does not have an ultrawide rear camera, while the average smartphone does. 62.6% of smartphones offer this.
  • Worse main camera video quality
    This smartphone records worse main camera video than the average smartphone. 11.80x of smartphones support 4K video recording.
    1080x30 fps vs 2160x30 fps
  • 0.1 µm smaller main camera pixel size
    This smartphone has a smaller main camera pixel size than the average smartphone (0.7 µm vs 0.8 µm). The average smartphone has a pixel size of 0.8 µm.
    1.4 binned
    0.7 µm vs 0.8 µm
  • Narrower front camera aperture
    This smartphone has a narrower front camera aperture than the average smartphone (f/2.4 vs f/2.2). The average smartphone front aperture is f/2.2.
    f/2.4 vs f/2.2
  • 1.9% smaller main camera sensor area
    This smartphone has a smaller main camera sensor area than the average smartphone (31.4 mm² vs 32 mm²). The average smartphone sensor area is 32 mm².
    31.4 mm² vs 32 mm²
  • No 5G connectivity
    This smartphone does not support 5G connectivity, the average smartphone does. 66.6% of smartphones are 5G compatible.
  • Older Bluetooth version
    This smartphone uses an older Bluetooth version than the average smartphone (5.1 vs 5.2). The average smartphone uses Bluetooth 5.2.
    5.1 vs 5.2
  • 25% lower refresh rate
    This smartphone has a lower refresh rate than the average smartphone (90 Hz vs 120 Hz). The average smartphone has a refresh rate of 120 Hz.
    90 Hz vs 120 Hz
  • 0.24 inches inch smaller screen size
    This smartphone has a smaller screen size than the average smartphone (6.4 inches vs 6.67 inches). The average smartphone has a screen size of 6.67 inches.
    6.43 inches vs 6.67 inches
  • 34.8% lower screen brightness
    This smartphone has a lower screen brightness than the average smartphone (430 nits vs 660 nits). The average smartphone has a brightness of 660 nits.
    430 nits vs 660 nits
  • Worse display glass type
    This smartphone uses a worse display glass type than the average smartphone (Panda Glass vs Corning Gorilla Glass 5). 0.00% of smartphones use the better glass type.
    Panda Glass vs Corning Gorilla Glass 5
  • 25% lower touch sampling rate
    This smartphone has a lower touch sampling rate than the average smartphone (180 Hz vs 240 Hz). The average smartphone has a sampling rate of 240 Hz.
    180 Hz vs 240 Hz
  • 200 nits lower peak brightness
    This smartphone has a lower peak brightness than the average smartphone (800 nits vs 1,000 nits). The average smartphone peak brightness is 1,000 nits.
    800 nits vs 1,000 nits
  • 10% smaller battery capacity
    This smartphone has a smaller battery capacity than the average smartphone (4,500 mAh vs 5,000 mAh). The average smartphone has a capacity of 5,000 mAh.
    4,500 mAh vs 5,000 mAh
  • No stereo speakers
    This smartphone does not have stereo speakers, the average smartphone does. 64.3% of smartphones feature stereo speakers.

Video reviews

Hands-on testing, unboxing, and real-world video evaluations

6.0
Obat Gaptek
≈ estimated
30/09/2022
Hands-on review · camera, speaker and design tests
Verdict
Oppo Reno8 4G wins on looks and quirky extras, but for performance and camera quality, a rival phone is the better pick.
Not graded
Overview video
Overview video
Overview video
Not graded

Third-party reviews

What customers like about Oppo Reno8 4G (8GB + 256GB)

  • Slim, light, and eye-catching design with a premium look (plastic build but feels robust).
  • Excellent, vibrant AMOLED display with good brightness and contrast.
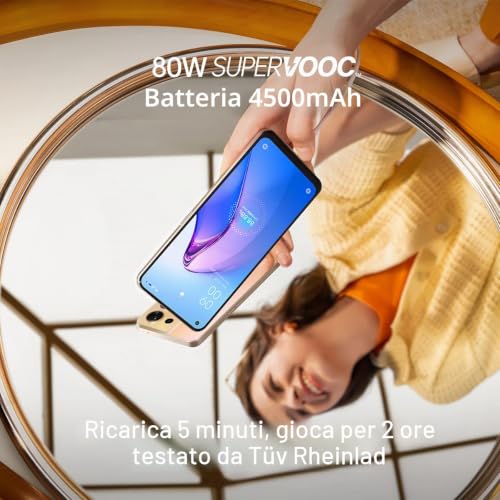
  • Very fast 80W SuperVOOC charging, capable of a full charge in around 45 minutes.
  • Dependable battery life that generally lasts a full day or more with moderate use.
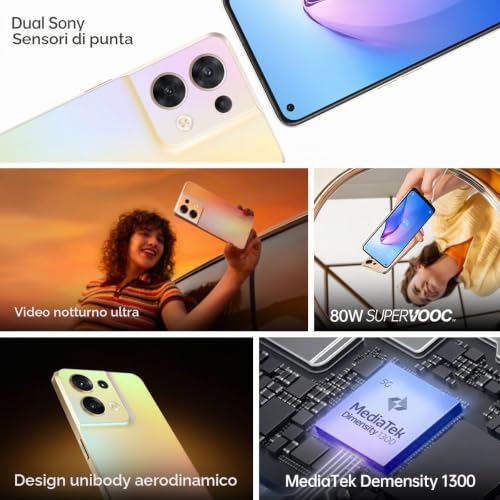
  • Solid main 50MP camera (Sony IMX766 sensor) that performs well, especially in good lighting.
  • Impressive 32MP selfie camera (Sony IMX709 sensor), praised for its quality and detail.
  • Snappy and reliable day-to-day performance with the MediaTek Dimensity 1300 chipset and 8GB RAM.
  • ColorOS is noted as being user-friendly, highly customizable, and having useful features like split-screen multitasking.
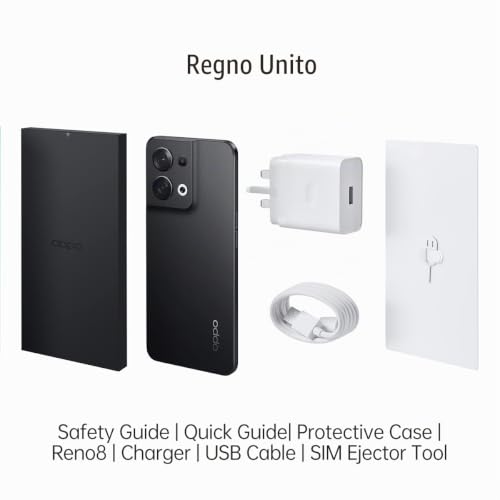
  • Comes with an 80W charger and a protective case in the box.
  • Ample storage, with the UK version offering 256GB, which is more than many competitors.
  • Under-display fingerprint sensor is fast and reliable.

What customers don't like about Oppo Reno8 4G (8GB + 256GB)

  • No Optical Image Stabilization (OIS) on the main camera, which can lead to blurry action shots or shaky zoomed-in photos.
  • Only a 90Hz display refresh rate, when many similarly priced competitors offer 120Hz.
  • Lacks stereo speakers, using a single bottom-firing speaker, which is a downside compared to some rivals.
  • The flat, angular design can make the phone uncomfortable to hold for long periods without a case.
  • Significant amount of pre-installed bloatware/junk apps upon initial setup.
  • No 3.5mm headphone jack or a microSD card slot for expandable storage.
  • Ultrawide and macro cameras are considered basic and underwhelming.
  • Video recording has limitations, such as not being able to switch between lenses mid-recording.
  • Haptics/vibration motor can feel non-premium and loud when typing.
  • Only offers two years of OS updates and three years of security updates, which is less than some competitors like Samsung.

Verdict

The OPPO Reno8 4G is a mid-range smartphone featuring the Qualcomm Snapdragon 680 processor, 8GB of RAM, and 256GB of internal UFS 2.2 storage, which is expandable via a card slot. A main characteristic is its sleek, lightweight design and a vibrant 6.43-inch, 90Hz AMOLED display protected by Panda Glass. The device is equipped with a versatile 64MP main rear camera system (plus 2MP macro and depth lenses) and a 32MP selfie camera, capable of good performance in adequate lighting. A key pro is its reliable all-day 4,500mAh battery life with very fast 33W SUPERVOOC charging included in the box. Cons include the use of a dated Snapdragon 680 chipset compared to competitors at the time of its release, the absence of stereo speakers and OIS (optical image stabilization) on the camera, and an official IP54 rating for splash resistance rather than full waterproofing.

Compare Oppo Reno8 4G (8GB + 256GB) with other smartphones

1Product to compare no. 1
VS
2Product to compare no. 2
VS
3Product to compare no. 3 (optional)

Graphic comparison of Oppo Reno8 4G (8GB + 256GB) and other smartphones

No results found