Scored using Smartphones Methodology v3.0
Smartphones Methodology v3.0
Mathematical & Unbiased Scoring
Products in this category are scored under Frontum Smartphones Methodology v3.0: the technical score from the specifications is the base, and independent expert and video reviews (up to ±0.5 points), owner opinions (up to ±0.3) and best-of lists (up to +0.3) move it up or down.
Explore Smartphones Methodology v3.0

Blackview Fort 2 review: 196 specs compared

Avg. price:~£210RAM capacity:24 GBInternal storage:128 GBScreen size:6.56 inchesMain camera megapixels:16 MP

Blackview Fort 2 Review: Compare 196 technical specifications and 2 expert and video reviews to see how this product ranks in the Smartphones category and whether it is worth buying.
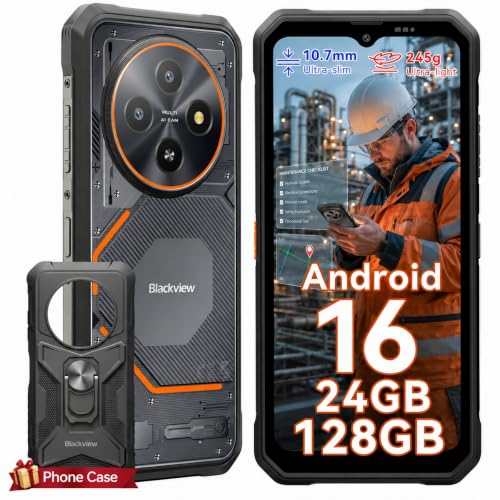
Blackview Fort 2
6.5/10

Overall score

Score
6.5/ 10
✕
What it is
Our main score for this model, 1–10. It combines specs, best-of lists, expert reviews and owners.
How we count it
Parts: Technical score 40%, List score 30%, Reviews score 25%, Sentiment score 5%
Marks: Each part gets a mark out of 10. For reviews, lists and owners, a typical model in this category gets about 8 and the best one gets 10.
No data yet: A part with no data shows "?". It counts as the mark of a weaker model in this category (4 in 5 models with data score higher). This way, models with reviews, lists and owners usually come out ahead.
Score distribution
â–¼
<55-66-77-88-99-10
Score components

40%

6.1

Technical score

30%

?

List scoreNot enough data yet, so we use 7.5, the mark of a weaker model in this category

25%

6.1

Reviews score

5%

?

Sentiment scoreNot enough data yet, so we use 6.1, the mark of a weaker model in this category

â–¼Worse than 82% of smartphones
7.4

Value for money

Value for money
7.4/ 10
✕
What it is
An indicator that combines the smartphone's overall rating with its cost.
When it matters
When you are looking for a smartphone with a good balance between quality and price.
Score distribution
â–¼
<55-66-77-88-99-10
Score components

70%

6.5

Overall score

30%

9.4

Price

â–¼Worse than 75%
6.1

Technical score

Technical score
6.1/ 10
✕
What it is
How good the specs are compared with the other models in this category, 1–10.
How we count it
Areas: We rate the specs in each area against the other models in this category.
Weighting: The areas that matter most to buyers count more. The shares are shown under Score components.
Share: The technical score is 40% of the overall score.
Score distribution
â–¼
<55-66-77-88-99-10
Score components

25%

6.8

Performance

18%

5.9

Camera

15%

4.8

Display

15%

5.7

Battery

10%

8.3

Software

10%

6.5

Connectivity

4%

2.3

Audio

3%

6.5

Design

â–¼Worse than 72%
6.1

Reviews score

Reviews score
6.1/ 10
✕
What it is
Average grade from independent test sites, magazines and video reviewers, 1–10.
How we count it
Grades: Each review's own score is converted to 1–10; without one, we grade the review ourselves. Big test sites count more, short reviews half as much as full tests. A video review counts half.
Score: The average grade is 80% of the review mark; the number of reviews is the other 20% (1 review = 5, the typical number in this category = 8, the most-reviewed model = 10).
Enough data: With few reviews, the average grade is pulled toward the typical grade of this category. No reviews yet: 7.5 for now.
Share: Reviews count 25% of the overall score.
Score distribution
â–¼
<55-66-77-88-99-10

6.1

Mark 7.4 is below the typical mark 7.9 of this category, so it cannot lift the score above the technical score

80%

7.9

Average grade

20%

5.7

Popularity

Grades by review (2)
2 video reviews, each counting half as much as a written test. Reviews count 25% of the overall score.
User ratings collected online are not part of this score.
â–¼Worse than 82%
?

Sentiment score

Sentiment score
6.1/ 10
✕
What it is
How positive owners are about this model in their comments under video reviews and on forums. We read each comment, keep only people who say they own the model, and sort them into positive, mixed or negative.
How we count it
Score: We compare how satisfied this model’s owners are with the other models in this category: the typical model gets 8, the most satisfied tenth 10, the least satisfied 4. This is 80% of the owner mark; the number of owners is the other 20%.
Enough data: A model counts with 10+ owners from 4+ different discussions. With fewer, the owner part changes nothing.
Share: Owners count 5% of the overall score (left out in categories where fewer than 10 models have enough owner comments).
Score distribution
â–¼
<55-66-77-88-99-10
Owners (0)
Not enough owner comments yet (10+ owners from 4+ discussions needed), so the owner part changes nothing.
Our own analysis of online owner opinions, not a rating from any website.
Not enough owner comments yet
?

List score

List score
7.5/ 10
✕
What it is
How often independent test sites, magazines and video reviewers put this model in their best-of lists for this category.
How we count it
Points: The model in the most lists of this category gets 10; the others get 8 to 10 in proportion. In no list yet: 7.5. Lists count 30% of the overall score.
Enough data: Every list counts, even a single one. With fewer than 5 best-of lists in the category, this part is left out.
Lists with this model (0)
Not in any best-of list yet, so this part counts as 7.5. Models in a list get 8 to 10.
Not in any best-of list yet
Loading...
Loading category ranking...

Technical Specifications of smartphone Blackview Fort 2

Technical score
Technical score
6.1/ 10
✕
What it is
How good the specs are compared with the other models in this category, 1–10.
How we count it
Areas: We rate the specs in each area against the other models in this category.
Weighting: The areas that matter most to buyers count more. The shares are shown under Score components.
Share: The technical score is 40% of the overall score.
Score distribution
â–¼
<55-66-77-88-99-10
Score components:

25%

6.8

Performance

18%

5.9

Camera

15%

4.8

Display

15%

5.7

Battery

10%

8.3

Software

10%

6.5

Connectivity

4%

2.3

Audio

3%

6.5

Design

6.1
Reviews score
6.1
Sentiment score
?
List score
?
Value for money
Value for money
7.4/ 10
✕
What it is
An indicator that combines the smartphone's overall rating with its cost.
When it matters
When you are looking for a smartphone with a good balance between quality and price.
Score distribution
â–¼
<55-66-77-88-99-10
Score components:

70%

6.5

Overall score

30%

9.4

Price

7.4
Processor model
?
Storage type
eMMC
This smartphone uses eMMC storage, which is slower than the storage in 82% of smartphones and the same as in 18% of smartphones.
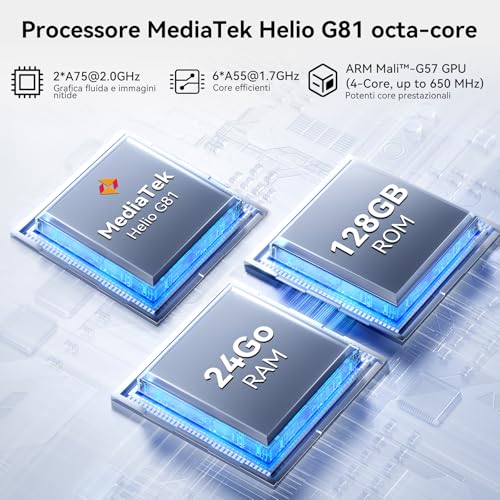
RAM capacity
24 GB
This smartphone has a RAM capacity of 24 GB which is larger than the RAM capacity of 96.7% of smartphones and equal to that of 2% of smartphones.
Internal storage
128 GB
This smartphone has an internal storage capacity of 128 GB which is smaller than the storage of 60.5% of smartphones and equal to that of 28.2% of smartphones.
CPU boost clock speed
2 GHz
The CPU boost clock speed of this smartphone is 2 GHz which is lower than the boost speed of 83.1% of smartphones and equal to that of 8.6% of smartphones.
Show more
Operating system
Android
This smartphone runs Android, which is more mainstream than the system in 4.9% of smartphones and the same as in 95.1% of smartphones.
Android version
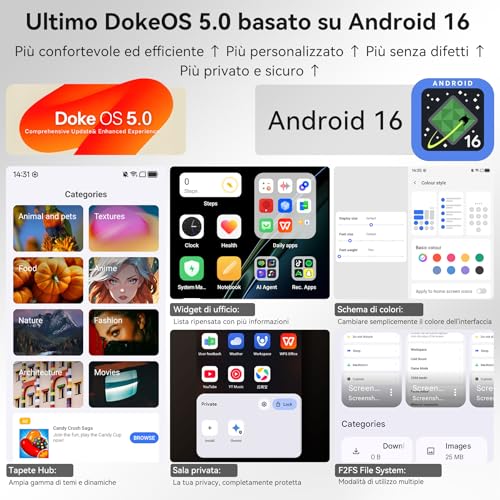
Android 15
This smartphone runs Android version Android 15 which is newer than that found in 69.4% of smartphones and equal to that in 24.9% of smartphones.
Direct OS updates
no
This smartphone does not support direct OS updates. 19.8% of smartphones offer this.
Promised software updates
?
Open-source OS
yes
This smartphone runs an open-source operating system. 5.3% of smartphones offer this.
Show more
Multi-lens main camera
yes
This smartphone includes a multi-lens main camera system. 93.9% of smartphones include multi-lens setups.
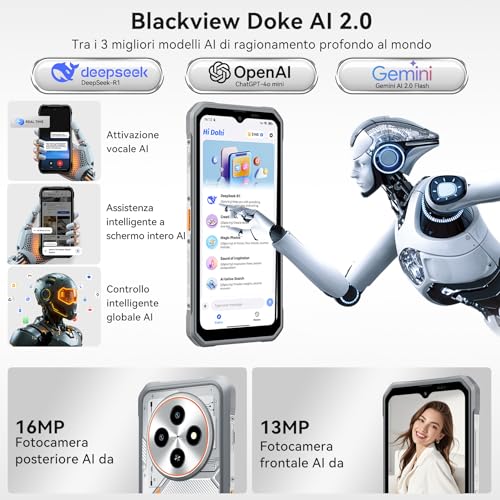
Main camera megapixels
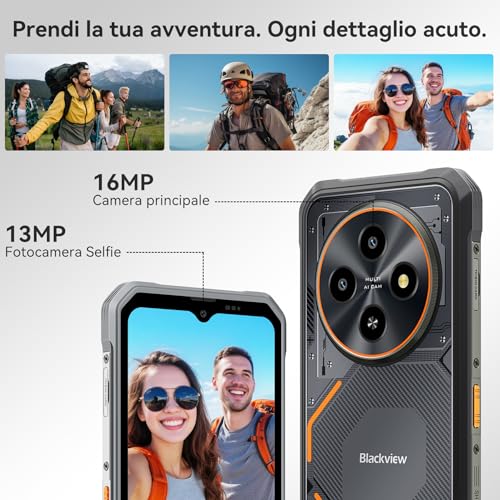
16 MP
This smartphone has a main camera resolution of 16 MP which is lower than that of 87.2% of smartphones and equal to that of 0.6% of smartphones.
Main camera aperture
?
Main camera sensor area
?
Main camera pixel size
?
Show more
Number of SIM slots
2
This smartphone has 2 SIM slots, which is more than in 3.6% of smartphones and equal to the number in 96.3% of smartphones.
Cellular module
yes
This smartphone includes a cellular module. 100% of smartphones include cellular modules.
eSIM support
no
This smartphone does not have eSIM support. 20.6% of smartphones offer this.
5G connectivity
no
This smartphone does not have 5G connectivity. 65.8% of smartphones offer this.
LTE support
yes
This smartphone supports LTE. 99.7% of smartphones include LTE connectivity.
Show more
Screen size
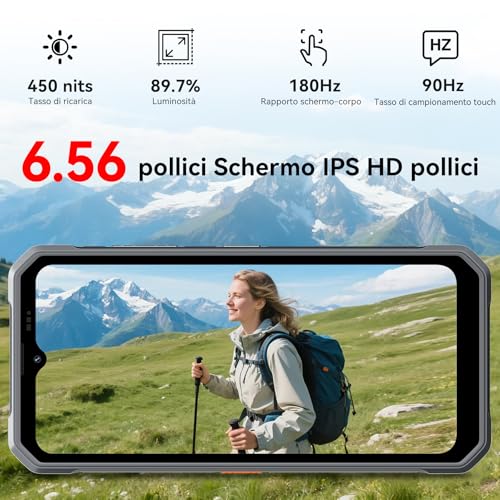
6.56 inches
This smartphone has a screen size of 6.56 inches which is smaller than the screens of 71.7% of smartphones and equal to those of 3.9% of smartphones.
Screen resolution
720x 1612 px
This smartphone has a screen resolution of 720x1612 px which is lower than that of 78.4% of smartphones and equal to that of 5.3% of smartphones.
Pixel density
269 ppi
This smartphone has a pixel density of 269 ppi which is lower than that of 79.3% of smartphones and equal to that of 5.5% of smartphones.
Display type
IPS LCD
This smartphone uses a IPS LCD display type. 0% of smartphones use this display technology.
Refresh rate
90 Hz
This smartphone supports a refresh rate of 90 Hz which is lower than in 65.2% of smartphones and equal to that in 18.6% of smartphones.
Show more
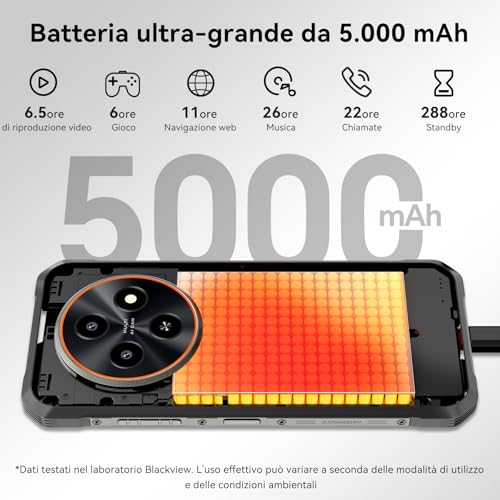
Battery capacity
5,000 mAh
This smartphone has a battery capacity of 5,000 mAh which is larger than the batteries in 28.7% of smartphones and equal to those in 28.5% of smartphones.
Charging speed
18 W
This smartphone supports charging speeds of 18 W which is slower than in 75.3% of smartphones and equal to speeds in 12.1% of smartphones.
Fast charging
yes
This smartphone supports fast charging. 93.4% of smartphones support fast charging.
GSMArena full wired charge time
?
Wireless charging
no
This smartphone does not support wireless charging. 24.8% of smartphones support wireless charging.
Show more
Stereo speakers
no
This smartphone does not have stereo speakers. 63.7% of smartphones offer this.
3.5 mm headphone jack
no
This smartphone does not have a headphone jack. 45.3% of smartphones offer this.
Number of microphones
?
FM radio
yes
This smartphone includes an FM radio. 34.9% of smartphones offer FM radio functionality.
aptX Lossless
no
This smartphone does not support aptX Lossless Bluetooth audio. 12.1% of smartphones offer this.
Show more
Height
175 mm
This smartphone has a height of 175 mm which is taller than 95.1% of smartphones and equal to that of 0.1% of smartphones.
Width
83 mm
This smartphone has a width of 83 mm which is wider than 93.6% of smartphones and equal to that of 0.3% of smartphones.
Thickness
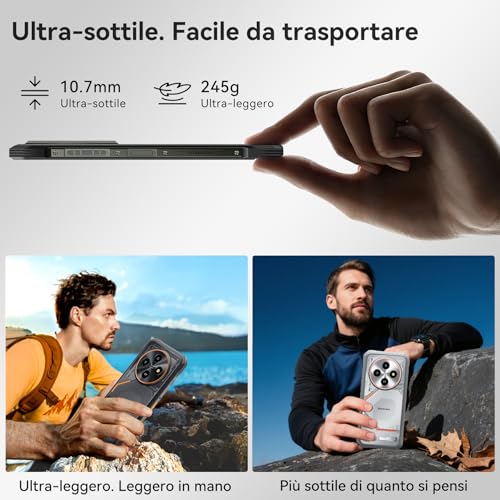
10.7 mm
This smartphone has a thickness of 10.7 mm which is thicker than 89.6% of smartphones and equal to that of 0.1% of smartphones.
Weight
245.3 g
This smartphone weighs 245.3 g which is heavier than 89.2% of smartphones.
Device volume
155,417.5 cm³
This smartphone has a device volume of 155,417.5 cm³ which is larger than 99.5% of smartphones.
Show more

Blackview Fort 2 vs the average smartphone

246810TotalPerformanceSoftwareCameraConnectivityDisplayBatteryAudioDesign
  • 16 GB more RAM
    This smartphone has more RAM capacity than the average smartphone (24 GB vs 8 GB). The average smartphone has 8 GB of RAM.
    24 GB vs 8 GB
  • Better IP rating
    This smartphone has a better IP rating than the average smartphone (IP68/IP69K vs IP67). The average IP rating is IP67.
    IP68/IP69K vs IP67
  • 1.5 m deeper water resistance
    This smartphone has a deeper water resistance rating than the average smartphone (1.5 m vs 0 m). The average depth rating is 0 m.
    1.5 m vs 0 m
  • Has FM radio
    This smartphone features an FM radio, the average smartphone does not. 34.9% of smartphones include an FM tuner.
  • Newer Android version
    This smartphone features a newer Android version than the average smartphone (Android 15 vs Android 14). The average version is Android 14.
    Android 15 vs Android 14
  • 1 year/s newer release date
    This smartphone has a newer release date than the average smartphone (2025 vs 2024). 1.00% of smartphones are released annually.
    2025 vs 2024
  • 16 GB more RAM
    This smartphone has more RAM capacity than the average smartphone (24 GB vs 8 GB). The average smartphone has 8 GB of RAM.
    24 GB vs 8 GB
  • 1 year/s newer release date
    This smartphone has a newer release date than the average smartphone (2025 vs 2024). 1.00% of smartphones are released annually.
    2025 vs 2024
  • Newer Android version
    This smartphone features a newer Android version than the average smartphone (Android 15 vs Android 14). The average version is Android 14.
    Android 15 vs Android 14
  • Has FM radio
    This smartphone features an FM radio, the average smartphone does not. 34.9% of smartphones include an FM tuner.
  • Better IP rating
    This smartphone has a better IP rating than the average smartphone (IP68/IP69K vs IP67). The average IP rating is IP67.
    IP68/IP69K vs IP67
  • 1.5 m deeper water resistance
    This smartphone has a deeper water resistance rating than the average smartphone (1.5 m vs 0 m). The average depth rating is 0 m.
    1.5 m vs 0 m
  • Inferior display type
    This smartphone has an inferior display type compared to the average smartphone (IPS LCD vs OLED/AMOLED). 0.00% of smartphones use the superior display type.
    IPS LCD vs OLED/AMOLED
  • Slower storage type
    This smartphone has slower storage than the average smartphone (eMMC vs UFS 3.1).
    eMMC vs UFS 3.1
  • No ultrawide rear camera
    This smartphone does not have an ultrawide rear camera, while the average smartphone does. 61.9% of smartphones offer this.
  • 2x larger process node
    This smartphone is manufactured on a larger process node than the average smartphone (12 nm vs 6 nm). The average smartphone uses a 6 nm process.
    12 nm vs 6 nm
  • No 5G connectivity
    This smartphone does not support 5G connectivity, the average smartphone does. 65.8% of smartphones are 5G compatible.
  • Worse main camera video quality
    This smartphone records worse main camera video than the average smartphone. 11.80x of smartphones support 4K video recording.
    1080x30 fps vs 2160x30 fps
  • 25% lower refresh rate
    This smartphone has a lower refresh rate than the average smartphone (90 Hz vs 120 Hz). The average smartphone has a refresh rate of 120 Hz.
    90 Hz vs 120 Hz
  • 31.6% slower GPU clock
    This smartphone has a lower GPU frequency than the average smartphone (650 MHz vs 950 MHz). The average smartphone has a GPU frequency of 950 MHz.
    650 MHz vs 950 MHz
  • 16.4% lower review score
    Reviews score
    6.1/ 10
    ✕
    What it is
    Average grade from independent test sites, magazines and video reviewers, 1–10.
    How we count it
    Grades: Each review's own score is converted to 1–10; without one, we grade the review ourselves. Big test sites count more, short reviews half as much as full tests. A video review counts half.
    Score: The average grade is 80% of the review mark; the number of reviews is the other 20% (1 review = 5, the typical number in this category = 8, the most-reviewed model = 10).
    Enough data: With few reviews, the average grade is pulled toward the typical grade of this category. No reviews yet: 7.5 for now.
    Share: Reviews count 25% of the overall score.
    Score distribution
    â–¼
    <55-66-77-88-99-10

    6.1

    Mark 7.4 is below the typical mark 7.9 of this category, so it cannot lift the score above the technical score

    80%

    7.9

    Average grade

    20%

    5.7

    Popularity

    Grades by review (2)
    2 video reviews, each counting half as much as a written test. Reviews count 25% of the overall score.
    User ratings collected online are not part of this score.
    6.1 vs 7.3
  • 3.3% worse value for money
    Blackview Fort 2 has worse value for money than the average smartphone (7.39 vs 7.6).
    7.39 vs 7.63
  • Slower storage type
    This smartphone has slower storage than the average smartphone (eMMC vs UFS 3.1).
    eMMC vs UFS 3.1
  • 2x larger process node
    This smartphone is manufactured on a larger process node than the average smartphone (12 nm vs 6 nm). The average smartphone uses a 6 nm process.
    12 nm vs 6 nm
  • 31.6% slower GPU clock
    This smartphone has a lower GPU frequency than the average smartphone (650 MHz vs 950 MHz). The average smartphone has a GPU frequency of 950 MHz.
    650 MHz vs 950 MHz
  • 50% less storage
    This smartphone offers less internal storage than the average smartphone (128 GB vs 256 GB). The average smartphone includes 256 GB of internal storage.
    128 GB vs 256 GB
  • 16.7% lower CPU boost clock speed
    This smartphone has a lower CPU boost clock speed than the average smartphone (2 GHz vs 2.4 GHz). The average smartphone has a boost clock speed of 2.4 GHz.
    2 GHz vs 2.4 GHz
  • No ultrawide rear camera
    This smartphone does not have an ultrawide rear camera, while the average smartphone does. 61.9% of smartphones offer this.
  • Worse main camera video quality
    This smartphone records worse main camera video than the average smartphone. 11.80x of smartphones support 4K video recording.
    1080x30 fps vs 2160x30 fps
  • Lower-resolution main camera
    This smartphone has a lower-resolution main camera than the average smartphone (16 MP vs 50 MP & 8 MP). The average smartphone has a 50 MP & 8 MP main camera.
    16 MP vs 50 MP & 8 MP
  • Lower front camera megapixels
    This smartphone has lower front camera megapixels than the average smartphone (13 MP vs 16 MP). The average smartphone has a 16 MP front camera.
    13 MP vs 16 MP
  • No 5G connectivity
    This smartphone does not support 5G connectivity, the average smartphone does. 65.8% of smartphones are 5G compatible.
  • Older Bluetooth version
    This smartphone uses an older Bluetooth version than the average smartphone (5 vs 5.2). The average smartphone uses Bluetooth 5.2.
    5 vs 5.2
  • Inferior display type
    This smartphone has an inferior display type compared to the average smartphone (IPS LCD vs OLED/AMOLED). 0.00% of smartphones use the superior display type.
    IPS LCD vs OLED/AMOLED
  • 25% lower refresh rate
    This smartphone has a lower refresh rate than the average smartphone (90 Hz vs 120 Hz). The average smartphone has a refresh rate of 120 Hz.
    90 Hz vs 120 Hz
  • 31.9% lower pixel density
    This smartphone has a lower pixel density than the average smartphone (269 ppi vs 395 ppi). The average smartphone has a pixel density of 395 ppi.
    269 ppi vs 395 ppi
  • Lower screen resolution
    This smartphone has a lower screen resolution than the average smartphone (720x1612 px vs 1080x2400 px). The average smartphone has a resolution of 1080x2400 px.
    720x1612 px vs 1080x2400 px
  • 550 nits lower peak brightness
    This smartphone has a lower peak brightness than the average smartphone (450 nits vs 1,000 nits). The average smartphone peak brightness is 1,000 nits.
    450 nits vs 1,000 nits
  • 0.11 inches inch smaller screen size
    This smartphone has a smaller screen size than the average smartphone (6.6 inches vs 6.67 inches). The average smartphone has a screen size of 6.67 inches.
    6.56 inches vs 6.67 inches
  • 45.5% slower charging speed
    This smartphone has a slower charging speed than the average smartphone (18 W vs 33 W). The average smartphone charges at 33 W.
    18 W vs 33 W
  • No stereo speakers
    This smartphone does not have stereo speakers, the average smartphone does. 63.6% of smartphones feature stereo speakers.
  • No LDAC support
    This smartphone does not support LDAC, the average smartphone does. 59% of smartphones support LDAC.
  • 24.6% heavier
    This smartphone is heavier than the average smartphone (245.3 g vs 196.8 g). The average smartphone weighs 196.8 g.
    245.3 g vs 196.8 g
  • 7 mm wider
    This smartphone is wider than the average smartphone (83 mm vs 76 mm). The average smartphone has a width of 76 mm.
    83 mm vs 76 mm
  • 1,508.91x larger volume
    This smartphone has a larger volume than the average smartphone (155,417.5 cm³ vs 103 cm³). The average smartphone volume is 103 cm³.
    155,417.5 cm³ vs 103 cm³
  • 2.4 mm thicker
    This smartphone is thicker than the average smartphone (10.7 mm vs 8.3 mm). The average smartphone has a thickness of 8.3 mm.
    10.7 mm vs 8.3 mm
  • 11.4 mm taller
    This smartphone is taller than the average smartphone (175 mm vs 163.6 mm). The average smartphone has a height of 163.6 mm.
    175 mm vs 163.6 mm

Video reviews

Hands-on testing, unboxing, and real-world video evaluations

8.0
Gadget Sidekick
≈ estimated
20/07/2026
Hands-on review · camera, gaming and speaker tests
Verdict
The Blackview Fort 2 is a good rugged phone with a strong processor, held back by its camera and speaker.
7.0
OSReviews
≈ estimated
03/06/2026
Hands-on review · durability, software, camera and gaming tests
Verdict
The Blackview Fort 2 gets the basics right for rugged buyers, but it is not an ambitious phone.
Overview video
Overview video
Shop video

Third-party reviews

What customers like about Blackview Fort 2

  • The 24 GB of RAM keeps several apps open at once.
  • The 90 Hz refresh rate makes scrolling feel smooth.
  • A 5000 mAh battery covers a normal day of calls and messages.
  • The 13 MP front camera is good enough for video calls.
  • Wi-Fi, GPS and LTE are all on board.
  • 128 GB of storage holds a fair stock of photos and apps.

What customers don't like about Blackview Fort 2

  • The 18 W charging is slow, so a flat battery takes a while to refill.
  • The 450 nit screen looks dim in bright sun.
  • At 245.3 g it feels heavy in the hand.
  • No 5G means slower downloads on mobile networks.
  • There is no ultrawide rear camera, so wide group shots are harder.

Verdict

If your phone use is mostly messages, calls and video at home, the Blackview Fort 2 covers the basics. The 6.56 inch screen runs at 90 Hz, so scrolling is smooth enough for everyday use. The 24 GB of RAM helps keep several apps open, and the 128 GB of storage holds plenty of photos. The 5000 mAh battery is decent for a day, but 18 W charging is slow, and the 450 nit screen looks dim outdoors. The processor is a 12 nm chip boosting to 2 GHz, so heavy games and many open apps will feel slow. The trade-off is that this is not a gaming phone, with a 650 MHz GPU and a soft 269 ppi screen. It suits a buyer who wants a plain phone for calls and messages, with no interest in games.

Compare Blackview Fort 2 with other smartphones

1Product to compare no. 1
VS
2Product to compare no. 2
VS
3Product to compare no. 3 (optional)

Graphic comparison of Blackview Fort 2 and other smartphones

No results found