Scored using Graphics cards Methodology v3.0
Graphics cards Methodology v3.0
Mathematical & Unbiased Scoring
Products in this category are scored under Frontum Graphics cards Methodology v3.0: the technical score from the specifications is the base, and independent expert and video reviews (up to ±0.5 points), owner opinions (up to ±0.3) and best-of lists (up to +0.3) move it up or down.
Explore Graphics cards Methodology v3.0

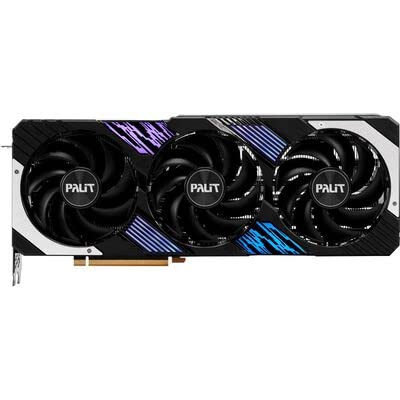
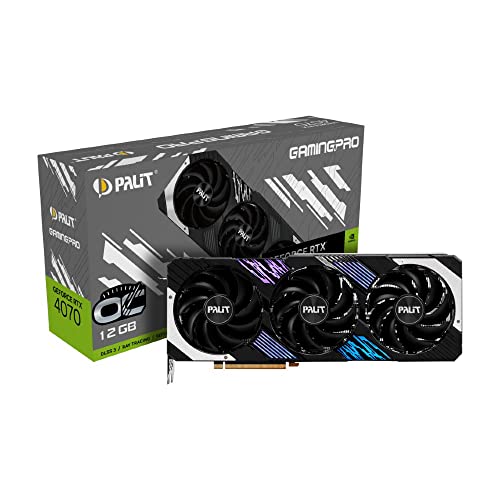
Palit GeForce RTX 4070 GamingPro OC review: 117 specs compared

Avg. price:~£560VRAM:12 GBMemory bus width:192 bitThermal Design Power (TDP):215 W

Palit GeForce RTX 4070 GamingPro OC Review: Compare 117 technical specifications and 1 expert and video reviews to see how this product ranks in the Graphics cards category and whether it is worth buying.
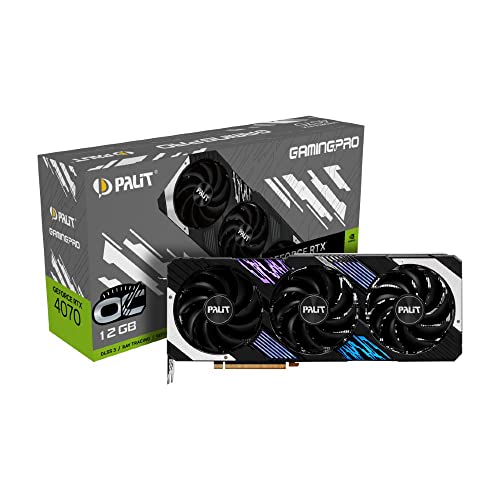
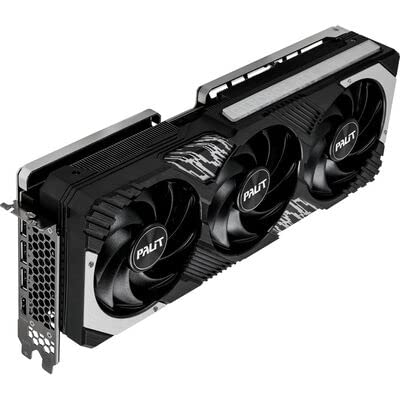
Palit GeForce RTX 4070 GamingPro OC
7.6/10

Overall score

Score
7.6/ 10
✕
What it is
Our main score for this model, 1–10. It combines specs, expert reviews, best-of lists and owners.
How we count it
Parts: Technical score 40%, Reviews score 25%, List score 25%, Sentiment score 10%
Marks: Each part gets a mark out of 10. For reviews, lists and owners, a typical model in this category gets about 8 and the best one gets 10.
No data yet: A part with no data shows "?". It counts as the mark of a weaker model in this category (4 in 5 models with data score higher). This way, models with reviews, lists and owners usually come out ahead.
Score distribution
â–¼
<55-66-77-88-99-10
Score components

40%

7.4

Technical score

25%

7.4

Reviews score

25%

?

List scoreNot enough data yet, so we use 7.5, the mark of a weaker model in this category

10%

9.3

Sentiment score

â–²Better than 56% of graphics cards
7.6

Value for money

Value for money
7.6/ 10
✕
What it is
An indicator that combines the graphics card's overall rating with its cost.
When it matters
When you are looking for a graphics card that offers a strong balance of performance, features, and price.
Score distribution
â–¼
<55-66-77-88-99-10
Score components

70%

7.6

Overall score

30%

7.6

Price

â–²Better than 62%
7.4

Technical score

Technical score
7.4/ 10
✕
What it is
How good the specs are compared with the other models in this category, 1–10.
How we count it
Areas: We rate the specs in each area against the other models in this category.
Weighting: The areas that matter most to buyers count more. The shares are shown under Score components.
Share: The technical score is 40% of the overall score.
Score distribution
â–¼
<55-66-77-88-99-10
Score components

44%

6.9

Performance

24%

6.2

Memory

12%

8.4

Power

11%

9.7

Features

5%

7.3

Design

4%

9.6

Connectivity

â–²Better than 57%
7.4

Reviews score

Reviews score
7.4/ 10
✕
What it is
Average grade from independent test sites, magazines and video reviewers, 1–10.
How we count it
Grades: Each review's own score is converted to 1–10; without one, we grade the review ourselves. Big test sites count more, short reviews half as much as full tests. A video review counts half.
Score: The average grade is 80% of the review mark; the number of reviews is the other 20% (1 review = 5, the typical number in this category = 8, the most-reviewed model = 10).
Enough data: With few reviews, the average grade is pulled toward the typical grade of this category. No reviews yet: 7.6 for now.
Share: Reviews count 25% of the overall score.
Score distribution
â–¼
<55-66-77-88-99-10

7.4

Mark 7.5 is below the typical mark 7.9 of this category, so it cannot lift the score above the technical score

80%

8.1

Average grade

20%

5.0

Popularity

Grades by review (1)
1 video review, counting half as much as a written test. Reviews count 25% of the overall score.
User ratings collected online are not part of this score.
â–¼Worse than 65%
?

List score

List score
7.5/ 10
✕
What it is
How often independent test sites, magazines and video reviewers put this model in their best-of lists for this category.
How we count it
Points: The model in the most lists of this category gets 10; the others get 8 to 10 in proportion. In no list yet: 7.5. Lists count 25% of the overall score.
Enough data: Every list counts, even a single one. With fewer than 5 best-of lists in the category, this part is left out.
Lists with this model (0)
Not in any best-of list yet, so this part counts as 7.5. Models in a list get 8 to 10.
Not in any best-of list yet
  • palit-geforce-rtx-4070-gamingpro-oc
  • palit-geforce-rtx-4070-gamingpro-oc
  • palit-geforce-rtx-4070-gamingpro-oc
  • palit-geforce-rtx-4070-gamingpro-oc
  • palit-geforce-rtx-4070-gamingpro-oc
palit-geforce-rtx-4070-gamingpro-oc
Where to buy
*As an Amazon Associate, we earn from qualifying purchases.

What owners say about the Palit GeForce RTX 4070 GamingPro OC

Based on 202 owners sharing their experience in online comments

80%positive10%mixed10%negative

Owners praise its fast, efficient gaming and DLSS gains, while VRAM limits and uneven results remain the main frustrations.

What owners dislike

  • Some owners find it can't hold 60 fps at max settings with ray tracing in demanding AAA games, especially at 4K or in Cyberpunk Overdrive.4
  • Owners say the 8GB limit causes memory shortfalls in some games, and 12GB can limit 4K in newer AAA titles, so DLSS helps.3
  • Some owners report hotspot near 95°C at 4K, memory near 100°C on some cards, and laptop versions throttling in thin chassis.3

Points mentioned by at least 3 owners, most mentioned first.

Loading...
Loading category ranking...

Technical Specifications of graphics card Palit GeForce RTX 4070 GamingPro OC

Technical score
Technical score
7.4/ 10
✕
What it is
How good the specs are compared with the other models in this category, 1–10.
How we count it
Areas: We rate the specs in each area against the other models in this category.
Weighting: The areas that matter most to buyers count more. The shares are shown under Score components.
Share: The technical score is 40% of the overall score.
Score distribution
â–¼
<55-66-77-88-99-10
Score components:

44%

6.9

Performance

24%

6.2

Memory

12%

8.4

Power

11%

9.7

Features

5%

7.3

Design

4%

9.6

Connectivity

7.4
Reviews score
7.4
List score
?
Value for money
Value for money
7.6/ 10
✕
What it is
An indicator that combines the graphics card's overall rating with its cost.
When it matters
When you are looking for a graphics card that offers a strong balance of performance, features, and price.
Score distribution
â–¼
<55-66-77-88-99-10
Score components:

70%

7.6

Overall score

30%

7.6

Price

7.6
3DMark Time Spy benchmark score
21,600 points
This graphics card scores 21,600 points in 3DMark Time Spy, which is higher than 70.1% of graphics cards and equal to 0.1% of graphics cards.
3DMark Port Royal score
11,900 points
This graphics card scores 11,900 points in 3DMark Port Royal, which is higher than 61.3% of graphics cards.
PassMark (G3D) result
26,918 points
This graphics card scores 26,918 points in PassMark G3D, which is higher than 63% of graphics cards and equal to 0.6% of graphics cards.
PassMark (DirectCompute) result
14,671 points
This graphics card scores 14,671 points in PassMark DirectCompute, which is higher than 59.5% of graphics cards and equal to 0.1% of graphics cards.
FP32 performance
30.03 TFLOPS
This graphics card delivers 30.03 TFLOPS FP32 performance, which is higher than that of 60.2% of graphics cards and equal to that of 0.2% of graphics cards.
Show more
VRAM
12 GB
This graphics card has 12 GB of VRAM, which is more than 46% of graphics cards and equal to 16% of graphics cards.
Memory type
GDDR6X
This graphics card uses GDDR6X memory, which is newer than on 57.1% of graphics cards and equal to 22.4% of graphics cards.
Memory bus width
192 bit
This graphics card uses a 192 bit memory bus, which is wider than that of 31.9% of graphics cards and equal to that of 18.7% of graphics cards.
Maximum memory bandwidth
504 GB/s
This graphics card reaches 504 GB/s memory bandwidth, which is higher than that of 54.6% of graphics cards and equal to that of 2% of graphics cards.
Effective memory speed
21,000 MHz
This graphics card reaches an effective memory speed of 21,000 MHz, which is faster than that of 61.2% of graphics cards and equal to that of 12.4% of graphics cards.
Show more
PCI Express (PCIe) version
4
This graphics card supports PCIe 4, which is newer than on 22.5% of graphics cards and equal to 50.5% of graphics cards.
PCIe lanes
x16
This graphics card uses x16 PCIe lanes, which is more than 24.1% of graphics cards and equal to 75.9% of graphics cards.
DirectX version
12 Ultimate
This graphics card supports DirectX 12 Ultimate, which is more advanced than on 22.8% of graphics cards and equal to 77.2% of graphics cards.
Vulkan version
1.4
This graphics card supports Vulkan 1.4, which is more advanced than on 20.8% of graphics cards and equal to 79.2% of graphics cards.
OpenGL version
4.6
This graphics card supports OpenGL 4.6, which is more advanced than on 2% of graphics cards and equal to 98% of graphics cards.
Show more
Max displays supported
4
This graphics card supports up to 4 displays, which is more than 9% of graphics cards and equal to 88.2% of graphics cards.
Max digital resolution
7680x4320
This graphics card supports a maximum digital resolution of 7680x4320, which is higher than that of 9.2% of graphics cards and equal to that of 90.9% of graphics cards.
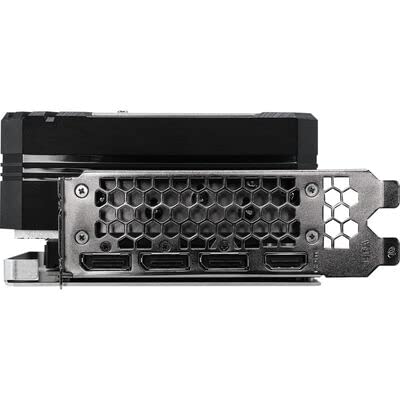
DisplayPort outputs
3
This graphics card offers 3 DisplayPort outputs, which is more than 21.7% of graphics cards and equal to 76% of graphics cards.
DisplayPort version
1.4a
This graphics card supports DisplayPort 1.4a, which is more advanced than on 19.3% of graphics cards and equal to 46.3% of graphics cards.
DisplayPort link rates
20 Gbps
This graphics card supports DisplayPort link rates up to 20 Gbps, which is slower than on 50.4% of graphics cards and equal to 7.2% of graphics cards.
Show more
Thermal Design Power (TDP)
215 W
This graphics card has a TDP of 215 W, which is lower than that of 49.2% of graphics cards and equal to that of 1.2% of graphics cards.
Power consumption while under peak load
215 W
This graphics card draws 215 W under peak load, which is lower than 51.7% of graphics cards and equal to 1.2% of graphics cards.
Recommended PSU wattage
750 W
This graphics card recommends a 750 W PSU, which is higher than that of 65.4% of graphics cards and equal to that of 16.8% of graphics cards.
Board power limit
215 W
This graphics card has a board power limit of 215 W, which is lower than that of 53.6% of graphics cards and equal to that of 0.7% of graphics cards.
PCIe power spec
215 W
Show more
Size
328.9x 132.9x 63.4 mm
Length
328.9 mm
This graphics card is 328.9 mm long, which is longer than 80.5% of graphics cards and equal in length to 0.5% of graphics cards.
Height
132.9 mm
This graphics card is 132.9 mm tall, which is taller than 66.5% of graphics cards and equal in height to 0.2% of graphics cards.
Slot width
2 slot/s
This graphics card occupies 2 slot/s, which is slimmer than 52.4% of graphics cards and equal in width to 43.4% of graphics cards.
Weight
1,000 g
This graphics card weighs 1,000 g, which is lighter than 50.9% of Graphics cards and equal to 3.3% of Graphics cards.
Show more

Palit GeForce RTX 4070 GamingPro OC vs the average graphics card

246810TotalPerformanceMemoryFeaturesConnectivityPowerDesign
  • 3.6% higher boost clock speed
    This graphics card has a higher boost GPU clock than the average graphics card (2,595 MHz vs 2,505 MHz). The average graphics card has a boost GPU clock of 2,505 MHz.
    2,595 MHz vs 2,505 MHz
  • 0.5 slot/s slimmer design
    This graphics card occupies fewer slots than the average graphics card (2 slot/s vs 2.5 slot/s). The average graphics card occupies 2.5 slot/s.
    2 slot/s vs 2.5 slot/s
  • 10.5% faster memory speed
    This graphics card has a higher effective memory speed than the average graphics card (21,000 MHz vs 19,000 MHz). The average graphics card reaches an effective memory speed of 19,000 MHz.
    21,000 MHz vs 19,000 MHz
  • 26.3% higher texture rate
    This graphics card has a higher texture rate than the average graphics card (477.5 GTexel/s vs 378 GTexel/s). The average graphics card has a texture rate of 378 GTexel/s.
    477.5 GTexel/s vs 378 GTexel/s
  • 12.5% higher memory bandwidth
    This graphics card has a higher memory bandwidth than the average graphics card (504 GB/s vs 448 GB/s). The average graphics card has a memory bandwidth of 448 GB/s.
    504 GB/s vs 448 GB/s
  • 19.2% higher sentiment score
    9.3 vs 7.8
  • 46.2% higher gaming score
    This graphics card has a higher gaming score than the average graphics card (21,600 points vs 14,779 points). The average graphics card has a gaming score of 14,779 points.
    21,600 points vs 14,779 points
  • 32.9% higher FP32 performance
    This graphics card has a higher FP32 performance than the average graphics card (30 TFLOPS vs 22.6 TFLOPS). The average graphics card has FP32 performance of 22.6 TFLOPS.
    30.03 TFLOPS vs 22.6 TFLOPS
  • 19.2% higher sentiment score
    9.3 vs 7.8
  • 3.6% higher boost clock speed
    This graphics card has a higher boost GPU clock than the average graphics card (2,595 MHz vs 2,505 MHz). The average graphics card has a boost GPU clock of 2,505 MHz.
    2,595 MHz vs 2,505 MHz
  • 26.3% higher texture rate
    This graphics card has a higher texture rate than the average graphics card (477.5 GTexel/s vs 378 GTexel/s). The average graphics card has a texture rate of 378 GTexel/s.
    477.5 GTexel/s vs 378 GTexel/s
  • 46.2% higher gaming score
    This graphics card has a higher gaming score than the average graphics card (21,600 points vs 14,779 points). The average graphics card has a gaming score of 14,779 points.
    21,600 points vs 14,779 points
  • 32.9% higher FP32 performance
    This graphics card has a higher FP32 performance than the average graphics card (30 TFLOPS vs 22.6 TFLOPS). The average graphics card has FP32 performance of 22.6 TFLOPS.
    30.03 TFLOPS vs 22.6 TFLOPS
  • 40 more AI cores
    This graphics card has more AI cores than the average graphics card (184 vs 144). The average graphics card has 144 AI cores.
    184 vs 144
  • 6 more compute units
    This graphics card has more compute units than the average graphics card (46 vs 40). The average graphics card has 40 compute units.
    46 vs 40
  • 10.5% faster memory speed
    This graphics card has a higher effective memory speed than the average graphics card (21,000 MHz vs 19,000 MHz). The average graphics card reaches an effective memory speed of 19,000 MHz.
    21,000 MHz vs 19,000 MHz
  • 12.5% higher memory bandwidth
    This graphics card has a higher memory bandwidth than the average graphics card (504 GB/s vs 448 GB/s). The average graphics card has a memory bandwidth of 448 GB/s.
    504 GB/s vs 448 GB/s
  • 50% larger L2 cache
    This graphics card has more L2 cache than the average graphics card (36 MB vs 24 MB). The average graphics card has 24 MB L2 cache.
    36 MB vs 24 MB
  • 4x higher HDMI bandwidth
    This graphics card has a higher HDMI bandwidth than the average graphics card (48 Gbps vs 12 Gbps). The average graphics card has HDMI bandwidth of 12 Gbps.
    48 Gbps vs 12 Gbps
  • 0.5 slot/s slimmer design
    This graphics card occupies fewer slots than the average graphics card (2 slot/s vs 2.5 slot/s). The average graphics card occupies 2.5 slot/s.
    2 slot/s vs 2.5 slot/s
  • No dual BIOS
    This graphics card does not include dual BIOS, the average graphics card does.
  • Less advanced frame generation
    This graphics card has less advanced frame generation than the average graphics card (frame generation vs multi frame generation).
    frame generation vs multi frame generation
  • 46.7 mm longer card length
    This graphics card is longer than the average graphics card (328.9 mm vs 282.2 mm). The average graphics card has a length of 282.2 mm.
    328.9 mm vs 282.2 mm
  • 25% slower VRAM clock
    This graphics card has a lower VRAM clock than the average graphics card (1,313 MHz vs 1,750 MHz). The average graphics card runs its VRAM at 1,750 MHz.
    1,313 MHz vs 1,750 MHz
  • 15.4% higher PSU requirement
    This graphics card has a higher PSU requirement than the average graphics card (750 W vs 650 W). The average graphics card has a PSU requirement of 650 W.
    750 W vs 650 W
  • 7.9 mm higher card profile
    This graphics card is taller than the average graphics card (132.9 mm vs 125 mm). The average graphics card has a height of 125 mm.
    132.9 mm vs 125 mm
  • 2 fewer monitors per output type
    This graphics card supports fewer monitors per output type than the average graphics card (1 vs 3). The average graphics card supports 3 monitors per output type.
    1 vs 3
  • 5 °C lower thermal ceiling
    This graphics card has a lower thermal ceiling than the average graphics card (100 °C vs 95 °C). The average graphics card has a thermal ceiling of 95 °C.
    100 °C vs 95 °C
  • 25% slower VRAM clock
    This graphics card has a lower VRAM clock than the average graphics card (1,313 MHz vs 1,750 MHz). The average graphics card runs its VRAM at 1,750 MHz.
    1,313 MHz vs 1,750 MHz
  • Less advanced frame generation
    This graphics card has less advanced frame generation than the average graphics card (frame generation vs multi frame generation).
    frame generation vs multi frame generation
  • 2 fewer monitors per output type
    This graphics card supports fewer monitors per output type than the average graphics card (1 vs 3). The average graphics card supports 3 monitors per output type.
    1 vs 3
  • Older NVDEC generation
    This graphics card has a lower NVDEC generation than the average graphics card (5 vs 6). The average graphics card offers NVDEC generation 6.
    5 vs 6
  • No dual BIOS
    This graphics card does not include dual BIOS, the average graphics card does.
  • 15.4% higher PSU requirement
    This graphics card has a higher PSU requirement than the average graphics card (750 W vs 650 W). The average graphics card has a PSU requirement of 650 W.
    750 W vs 650 W
  • 5 °C lower thermal ceiling
    This graphics card has a lower thermal ceiling than the average graphics card (100 °C vs 95 °C). The average graphics card has a thermal ceiling of 95 °C.
    100 °C vs 95 °C
  • 46.7 mm longer card length
    This graphics card is longer than the average graphics card (328.9 mm vs 282.2 mm). The average graphics card has a length of 282.2 mm.
    328.9 mm vs 282.2 mm
  • 7.9 mm higher card profile
    This graphics card is taller than the average graphics card (132.9 mm vs 125 mm). The average graphics card has a height of 125 mm.
    132.9 mm vs 125 mm

Video reviews

Hands-on testing, unboxing, and real-world video evaluations

8.0
MeyneX One
≈ estimated
07/05/2023
Unboxing and first check · size, power and connections
Verdict
Palit GeForce RTX 4070 GamingPro OC is a small card that fits any case and needs one 8-pin plug; thumbs up, though the price could drop.

Third-party reviews

What customers like about Palit GeForce RTX 4070 GamingPro OC

  • Efficient triple-fan Gale Hunter cooling system maintains low temperatures under load.
  • Excellent noise-normalized thermal performance, ranking among the quietest in its class.
  • Semi-passive '0-dB TECH' keeps fans off during light tasks for silent operation.
  • Includes a dedicated 5V ARGB header for easy synchronization with other lighting devices.
  • Sizable factory overclock provides a performance edge over base reference models.
  • High build quality with a protective metal backplate and rigid industrial design.

What customers don't like about Palit GeForce RTX 4070 GamingPro OC

  • The 33cm length and triple-slot thickness may not fit in smaller PC cases.
  • Conservative power limits restrict high-end manual overclocking potential compared to some rivals.
  • Industrial aesthetic with heavy RGB on the front shroud may be considered 'busy' or excessive by some.
  • Lacks a dual BIOS switch, a feature common on other premium board partner models.
  • Software control via ThunderMaster is required for advanced lighting customization, though basic ARGB sync is hardware-based.

Verdict

The Palit GeForce RTX 4070 GamingPro OC is a high-performance graphics card built on the NVIDIA Ada Lovelace architecture, featuring 5,888 CUDA cores, a factory-overclocked boost clock of 2,595 MHz, and 12 GB of GDDR6X memory on a 192-bit interface with a 504 GB/s bandwidth. It is characterized by its rigid iron-black and silver-grey industrial design, a triple-fan cooling system with Gale Hunter Fans and Y Formula Fins, and customizable ARGB lighting that can be synced via a dedicated header. Main pros include exceptional 1440p gaming performance, support for DLSS 3 and advanced ray tracing, high energy efficiency with a 215W TDP, and a quiet thermal module that features idle fan-stop technology. Available cons include its large physical footprint, requiring approximately 3.1 slots and a length of 329 mm, and the use of the 16-pin 12VHPWR power connector which may require an adapter for older power supplies.

Compare Palit GeForce RTX 4070 GamingPro OC with other products in the Graphics cards category

1Product to compare no. 1
VS
2Product to compare no. 2
VS
3Product to compare no. 3 (optional)

Graphic comparison of Palit GeForce RTX 4070 GamingPro OC and other products in the Graphics cards category

No results found