Scored using Graphics cards Methodology v3.0
Graphics cards Methodology v3.0
Mathematical & Unbiased Scoring
Products in this category are scored under Frontum Graphics cards Methodology v3.0: the technical score from the specifications is the base, and independent expert and video reviews (up to ±0.5 points), owner opinions (up to ±0.3) and best-of lists (up to +0.3) move it up or down.
Explore Graphics cards Methodology v3.0

ASRock Radeon RX 7900 XTX Taichi OC review: 117 specs compared

Avg. price:~£840VRAM:24 GBMemory bus width:384 bitThermal Design Power (TDP):355 W

ASRock Radeon RX 7900 XTX Taichi OC Review: Compare 117 technical specifications and 2 expert and video reviews to see how this product ranks in the Graphics cards category and whether it is worth buying.
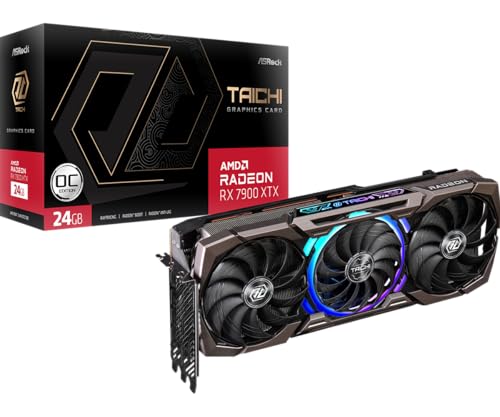
ASRock Radeon RX 7900 XTX Taichi OC
8.3/10

Overall score

Score
8.3/ 10
✕
What it is
Our main score for this model, 1–10. It combines specs, expert reviews, best-of lists and owners.
How we count it
Parts: Technical score 40%, Reviews score 25%, List score 25%, Sentiment score 10%
Marks: Each part gets a mark out of 10. For reviews, lists and owners, a typical model in this category gets about 8 and the best one gets 10.
No data yet: A part with no data shows "?". It counts as the mark of a weaker model in this category (4 in 5 models with data score higher). This way, models with reviews, lists and owners usually come out ahead.
Score distribution
â–¼
<55-66-77-88-99-10
Score components

40%

9.0

Technical score

25%

8.1

Reviews score

25%

?

List scoreNot enough data yet, so we use 7.5, the mark of a weaker model in this category

10%

8.5

Sentiment score

â–²Better than 89% of graphics cards
7.7

Value for money

Value for money
7.7/ 10
✕
What it is
An indicator that combines the graphics card's overall rating with its cost.
When it matters
When you are looking for a graphics card that offers a strong balance of performance, features, and price.
Score distribution
â–¼
<55-66-77-88-99-10
Score components

70%

8.3

Overall score

30%

6.1

Price

â–²Better than 75%
9.0

Technical score

Technical score
9.0/ 10
✕
What it is
How good the specs are compared with the other models in this category, 1–10.
How we count it
Areas: We rate the specs in each area against the other models in this category.
Weighting: The areas that matter most to buyers count more. The shares are shown under Score components.
Share: The technical score is 40% of the overall score.
Score distribution
â–¼
<55-66-77-88-99-10
Score components

44%

9.5

Performance

24%

9.2

Memory

12%

7.5

Power

11%

9.2

Features

5%

5.4

Design

4%

9.7

Connectivity

â–²Better than 82%
8.1

Reviews score

Reviews score
8.1/ 10
✕
What it is
Average grade from independent test sites, magazines and video reviewers, 1–10.
How we count it
Grades: Each review's own score is converted to 1–10; without one, we grade the review ourselves. Big test sites count more, short reviews half as much as full tests. A video review counts half.
Score: The average grade is 80% of the review mark; the number of reviews is the other 20% (1 review = 5, the typical number in this category = 8, the most-reviewed model = 10).
Enough data: With few reviews, the average grade is pulled toward the typical grade of this category. No reviews yet: 7.6 for now.
Share: Reviews count 25% of the overall score.
Score distribution
â–¼
<55-66-77-88-99-10

80%

8.5

Average grade

20%

6.5

Popularity

Grades by review (2)
1 review, with a printed score. 1 video review, counting half as much as a written test. Reviews count 25% of the overall score.
User ratings collected online are not part of this score.
â–²Better than 60%
?

List score

List score
7.5/ 10
✕
What it is
How often independent test sites, magazines and video reviewers put this model in their best-of lists for this category.
How we count it
Points: The model in the most lists of this category gets 10; the others get 8 to 10 in proportion. In no list yet: 7.5. Lists count 25% of the overall score.
Enough data: Every list counts, even a single one. With fewer than 5 best-of lists in the category, this part is left out.
Lists with this model (0)
Not in any best-of list yet, so this part counts as 7.5. Models in a list get 8 to 10.
Not in any best-of list yet
  • asrock-radeon-rx-7900-xtx-taichi-oc
  • asrock-radeon-rx-7900-xtx-taichi-oc
  • asrock-radeon-rx-7900-xtx-taichi-oc
  • asrock-radeon-rx-7900-xtx-taichi-oc
  • asrock-radeon-rx-7900-xtx-taichi-oc
asrock-radeon-rx-7900-xtx-taichi-oc
Where to buy
*As an Amazon Associate, we earn from qualifying purchases.

What owners say about the ASRock Radeon RX 7900 XTX Taichi OC

Based on 281 owners sharing their experience in online comments

73%positive15%mixed12%negative

Owners praise fast high-resolution gaming and ample memory, while power draw, heat, and weaker ray tracing cause complaints.

What owners dislike

  • Some owners report driver crashes, DirectX 12 errors, and screen corruption, and found older driver versions more stable.5
  • Some cards hit 110°C and throttle right away, and high GPU hotspot temperatures sometimes needed the thermal paste reapplied.3
  • Ray tracing costs a lot of frame rate, with some owners seeing drops from 120 fps to 20 to 30 fps in Diablo 4 on medium RT.3
  • Under load the card often pulls 350 to 465 watts, with spikes near 600 watts, so owners may need a 1000-watt power supply.3

Points mentioned by at least 3 owners, most mentioned first.

Loading...
Loading category ranking...

Technical Specifications of graphics card ASRock Radeon RX 7900 XTX Taichi OC

Technical score
Technical score
9.0/ 10
✕
What it is
How good the specs are compared with the other models in this category, 1–10.
How we count it
Areas: We rate the specs in each area against the other models in this category.
Weighting: The areas that matter most to buyers count more. The shares are shown under Score components.
Share: The technical score is 40% of the overall score.
Score distribution
â–¼
<55-66-77-88-99-10
Score components:

44%

9.5

Performance

24%

9.2

Memory

12%

7.5

Power

11%

9.2

Features

5%

5.4

Design

4%

9.7

Connectivity

9.0
Reviews score
8.1
List score
?
Value for money
Value for money
7.7/ 10
✕
What it is
An indicator that combines the graphics card's overall rating with its cost.
When it matters
When you are looking for a graphics card that offers a strong balance of performance, features, and price.
Score distribution
â–¼
<55-66-77-88-99-10
Score components:

70%

8.3

Overall score

30%

6.1

Price

7.7
3DMark Time Spy benchmark score
40,610 points
This graphics card scores 40,610 points in 3DMark Time Spy, which is higher than 97.9% of graphics cards and equal to 0.1% of graphics cards.
3DMark Port Royal score
16,029 points
This graphics card scores 16,029 points in 3DMark Port Royal, which is higher than 76.1% of graphics cards and equal to 0.1% of graphics cards.
PassMark (G3D) result
31,290 points
This graphics card scores 31,290 points in PassMark G3D, which is higher than 73.7% of graphics cards.
PassMark (DirectCompute) result
28,995 points
This graphics card scores 28,995 points in PassMark DirectCompute, which is higher than 93% of graphics cards and equal to 2.2% of graphics cards.
FP32 performance
65.86 TFLOPS
This graphics card delivers 65.86 TFLOPS FP32 performance, which is higher than that of 94.1% of graphics cards and equal to that of 0.1% of graphics cards.
Show more
VRAM
24 GB
This graphics card has 24 GB of VRAM, which is more than 91.2% of graphics cards and equal to 5.5% of graphics cards.
Memory type
GDDR6
This graphics card uses GDDR6 memory, which is newer than on 16.4% of graphics cards and equal to 40.3% of graphics cards.
Memory bus width
384 bit
This graphics card uses a 384 bit memory bus, which is wider than that of 89.7% of graphics cards and equal to that of 7% of graphics cards.
Maximum memory bandwidth
960 GB/s
This graphics card reaches 960 GB/s memory bandwidth, which is higher than that of 88.3% of graphics cards and equal to that of 5.7% of graphics cards.
Effective memory speed
20,000 MHz
This graphics card reaches an effective memory speed of 20,000 MHz, which is faster than that of 53.4% of graphics cards and equal to that of 7.5% of graphics cards.
Show more
PCI Express (PCIe) version
4
This graphics card supports PCIe 4, which is newer than on 22.5% of graphics cards and equal to 50.5% of graphics cards.
PCIe lanes
x16
This graphics card uses x16 PCIe lanes, which is more than 24.1% of graphics cards and equal to 75.9% of graphics cards.
DirectX version
12
This graphics card supports DirectX 12, which is older than on 81.8% of graphics cards and equal to 17% of graphics cards.
Vulkan version
1.3
This graphics card supports Vulkan 1.3, which is older than on 79.2% of graphics cards and equal to 15.6% of graphics cards.
OpenGL version
4.6
This graphics card supports OpenGL 4.6, which is more advanced than on 2% of graphics cards and equal to 98% of graphics cards.
Show more
Max displays supported
4
This graphics card supports up to 4 displays, which is more than 9% of graphics cards and equal to 88.2% of graphics cards.
Max digital resolution
7680x4320
This graphics card supports a maximum digital resolution of 7680x4320, which is higher than that of 9.2% of graphics cards and equal to that of 90.9% of graphics cards.
DisplayPort outputs
3
This graphics card offers 3 DisplayPort outputs, which is more than 21.7% of graphics cards and equal to 76% of graphics cards.
DisplayPort version
2.1
This graphics card supports DisplayPort 2.1, which is more advanced than on 66.4% of graphics cards and equal to 7.7% of graphics cards.
DisplayPort link rates
10 Gbps
This graphics card supports DisplayPort link rates up to 10 Gbps, which is slower than on 63.5% of graphics cards and equal to 1.6% of graphics cards.
Show more
Thermal Design Power (TDP)
355 W
This graphics card has a TDP of 355 W, which is higher than that of 87.9% of graphics cards and equal to that of 1.1% of graphics cards.
Power consumption while under peak load
432 W
This graphics card draws 432 W under peak load, which is higher than 93.3% of graphics cards and equal to 0.1% of graphics cards.
Recommended PSU wattage
1,000 W
This graphics card recommends a 1,000 W PSU, which is higher than that of 95.9% of graphics cards and equal to that of 3.8% of graphics cards.
Board power limit
355 W
This graphics card has a board power limit of 355 W, which is higher than that of 83.9% of graphics cards and equal to that of 0.4% of graphics cards.
PCIe power spec
355 W
Show more
Size
345x 140x 61 mm
Length
345 mm
This graphics card is 345 mm long, which is longer than 94.6% of graphics cards and equal in length to 0.1% of graphics cards.
Height
140 mm
This graphics card is 140 mm tall, which is taller than 79.5% of graphics cards and equal in height to 5.4% of graphics cards.
Slot width
3 slot/s
This graphics card occupies 3 slot/s, which is wider than 70.7% of graphics cards and equal in width to 16.8% of graphics cards.
Weight
1,772 g
This graphics card weighs 1,772 g, which is heavier than 83.2% of Graphics cards.
Show more

ASRock Radeon RX 7900 XTX Taichi OC vs the average graphics card

246810TotalPerformanceMemoryFeaturesConnectivityPowerDesign
  • 56 more compute units
    This graphics card has more compute units than the average graphics card (96 vs 40). The average graphics card has 40 compute units.
    96 vs 40
  • 56 more ray tracing cores
    This graphics card has more ray tracing cores than the average graphics card (96 vs 40). The average graphics card has 40 ray tracing cores.
    96 vs 40
  • 128 more ROPs
    This graphics card has more ROPs than the average graphics card (192 vs 64). The average graphics card has 64 ROPs.
    192 vs 64
  • 12 GB more VRAM
    This graphics card has more VRAM than the average graphics card (24 GB vs 12 GB). The average graphics card has 12 GB VRAM.
    24 GB vs 12 GB
  • 7% higher boost clock speed
    This graphics card has a higher boost GPU clock than the average graphics card (2,680 MHz vs 2,505 MHz). The average graphics card has a boost GPU clock of 2,505 MHz.
    2,680 MHz vs 2,505 MHz
  • 2.14x higher memory bandwidth
    This graphics card has a higher memory bandwidth than the average graphics card (960 GB/s vs 448 GB/s). The average graphics card has a memory bandwidth of 448 GB/s.
    960 GB/s vs 448 GB/s
  • 192 bit wider memory bus
    This graphics card has a wider memory bus than the average graphics card (384 bit vs 192 bit). The average graphics card has a memory bus width of 192 bit.
    384 bit vs 192 bit
  • 2.72x higher texture rate
    This graphics card has a higher texture rate than the average graphics card (1,29.1 GTexel/s vs 378 GTexel/s). The average graphics card has a texture rate of 378 GTexel/s.
    1,029.1 GTexel/s vs 378 GTexel/s
  • 12.5% higher review score
    Reviews score
    8.1/ 10
    ✕
    What it is
    Average grade from independent test sites, magazines and video reviewers, 1–10.
    How we count it
    Grades: Each review's own score is converted to 1–10; without one, we grade the review ourselves. Big test sites count more, short reviews half as much as full tests. A video review counts half.
    Score: The average grade is 80% of the review mark; the number of reviews is the other 20% (1 review = 5, the typical number in this category = 8, the most-reviewed model = 10).
    Enough data: With few reviews, the average grade is pulled toward the typical grade of this category. No reviews yet: 7.6 for now.
    Share: Reviews count 25% of the overall score.
    Score distribution
    â–¼
    <55-66-77-88-99-10

    80%

    8.5

    Average grade

    20%

    6.5

    Popularity

    Grades by review (2)
    1 review, with a printed score. 1 video review, counting half as much as a written test. Reviews count 25% of the overall score.
    User ratings collected online are not part of this score.
    8.1 vs 7.2
  • 56 more compute units
    This graphics card has more compute units than the average graphics card (96 vs 40). The average graphics card has 40 compute units.
    96 vs 40
  • 56 more ray tracing cores
    This graphics card has more ray tracing cores than the average graphics card (96 vs 40). The average graphics card has 40 ray tracing cores.
    96 vs 40
  • 128 more ROPs
    This graphics card has more ROPs than the average graphics card (192 vs 64). The average graphics card has 64 ROPs.
    192 vs 64
  • 7% higher boost clock speed
    This graphics card has a higher boost GPU clock than the average graphics card (2,680 MHz vs 2,505 MHz). The average graphics card has a boost GPU clock of 2,505 MHz.
    2,680 MHz vs 2,505 MHz
  • 2.72x higher texture rate
    This graphics card has a higher texture rate than the average graphics card (1,29.1 GTexel/s vs 378 GTexel/s). The average graphics card has a texture rate of 378 GTexel/s.
    1,029.1 GTexel/s vs 378 GTexel/s
  • 200 more TMUs
    This graphics card has more TMUs than the average graphics card (384 vs 184). The average graphics card has 184 TMUs.
    384 vs 184
  • 2.97x higher pixel rate
    This graphics card has a higher pixel rate than the average graphics card (479.6 GPixel/s vs 161.3 GPixel/s). The average graphics card has a pixel rate of 161.3 GPixel/s.
    479.6 GPixel/s vs 161.3 GPixel/s
  • 2.91x higher FP32 performance
    This graphics card has a higher FP32 performance than the average graphics card (65.9 TFLOPS vs 22.6 TFLOPS). The average graphics card has FP32 performance of 22.6 TFLOPS.
    65.86 TFLOPS vs 22.6 TFLOPS
  • 2.75x higher gaming score
    This graphics card has a higher gaming score than the average graphics card (40,610 points vs 14,779 points). The average graphics card has a gaming score of 14,779 points.
    40,610 points vs 14,779 points
  • 75.2% higher ray tracing score
    This graphics card has a higher ray tracing score than the average graphics card (16,029 points vs 9,148 points). The average graphics card has a ray tracing score of 9,148 points.
    16,029 points vs 9,148 points
  • 10.4% higher base clock speed
    This graphics card has a higher base GPU clock than the average graphics card (2,119 MHz vs 1920 MHz). The average graphics card has a base GPU clock of 1920 MHz.
    2,119 MHz vs 1,920 MHz
  • 38.2% higher PassMark score
    This graphics card has a higher PassMark score than the average graphics card (31,290 points vs 22,638 points). The average graphics card has a PassMark score of 22,638 points.
    31,290 points vs 22,638 points
  • 48 more AI cores
    This graphics card has more AI cores than the average graphics card (192 vs 144). The average graphics card has 144 AI cores.
    192 vs 144
  • 4x higher FP64 performance
    This graphics card has a higher FP64 performance than the average graphics card (1.9 TFLOPS vs 0.48 TFLOPS). The average graphics card has FP64 performance of 0.48 TFLOPS.
    1.92 TFLOPS vs 0.48 TFLOPS
  • 4.46x higher FP16 performance
    This graphics card has a higher FP16 performance than the average graphics card (131.7 TFLOPS vs 29.5 TFLOPS). The average graphics card has FP16 performance of 29.5 TFLOPS.
    131.7 TFLOPS vs 29.5 TFLOPS
  • 2.4x higher compute score
    This graphics card has a higher compute score than the average graphics card (28,995 points vs 12,70.5 points). The average graphics card has a compute score of 12,070.5 points.
    28,995 points vs 12,070.5 points
  • 3.46x higher BF16 performance
    This graphics card has a higher BF16 performance than the average graphics card (122.8 TFLOPS vs 35.48 TFLOPS). The average graphics card has BF16 performance of 35.48 TFLOPS.
    122.8 TFLOPS vs 35.48 TFLOPS
  • 12 GB more VRAM
    This graphics card has more VRAM than the average graphics card (24 GB vs 12 GB). The average graphics card has 12 GB VRAM.
    24 GB vs 12 GB
  • 2.14x higher memory bandwidth
    This graphics card has a higher memory bandwidth than the average graphics card (960 GB/s vs 448 GB/s). The average graphics card has a memory bandwidth of 448 GB/s.
    960 GB/s vs 448 GB/s
  • 192 bit wider memory bus
    This graphics card has a wider memory bus than the average graphics card (384 bit vs 192 bit). The average graphics card has a memory bus width of 192 bit.
    384 bit vs 192 bit
  • 42.9% faster VRAM clock
    This graphics card has a higher VRAM clock than the average graphics card (2,500 MHz vs 1,750 MHz). The average graphics card runs its VRAM at 1,750 MHz.
    2,500 MHz vs 1,750 MHz
  • 24x more Infinity Cache
    This graphics card has more Infinity Cache than the average graphics card (96 MB vs 4 MB). The average graphics card has 4 MB Infinity Cache.
    96 MB vs 4 MB
  • 2x larger L1 cache
    This graphics card has more L1 cache than the average graphics card (256 KB vs 128 KB). The average graphics card has 128 KB L1 cache.
    256 KB vs 128 KB
  • 2.52x more transistors
    This graphics card has more transistors than the average graphics card (57,700 million vs 22,900 million). The average graphics card has 22,900 million transistors.
    57,700 million vs 22,900 million
  • Newer DisplayPort version
    This graphics card supports a newer DisplayPort version than the average graphics card (2.1 vs 1.4a).
    2.1 vs 1.4a
  • 11 °C lower load temperature
    This graphics card has a lower load temperature than the average graphics card (56 °C vs 67 °C). The average graphics card has a load temperature of 67 °C.
    56 °C vs 67 °C
  • No CUDA support
    This graphics card does not support CUDA, the average graphics card does.
  • No DLSS support
    This graphics card does not support DLSS, the average graphics card does.
  • 65.1% higher TDP
    This graphics card has a higher TDP than the average graphics card (355 W vs 215 W). The average graphics card has a TDP of 215 W.
    355 W vs 215 W
  • Less advanced frame generation
    This graphics card has less advanced frame generation than the average graphics card (frame generation vs multi frame generation).
    frame generation vs multi frame generation
  • 53.8% higher PSU requirement
    This graphics card has a higher PSU requirement than the average graphics card (1,000 W vs 650 W). The average graphics card has a PSU requirement of 650 W.
    1,000 W vs 650 W
  • 62.8 mm longer card length
    This graphics card is longer than the average graphics card (345 mm vs 282.2 mm). The average graphics card has a length of 282.2 mm.
    345 mm vs 282.2 mm
  • 15 mm higher card profile
    This graphics card is taller than the average graphics card (140 mm vs 125 mm). The average graphics card has a height of 125 mm.
    140 mm vs 125 mm
  • 61.4% higher board power limit
    This graphics card has a higher board power limit than the average graphics card (355 W vs 220 W). The average graphics card has a board power limit of 220 W.
    355 W vs 220 W
  • 61.5% more expensive
    ASRock Radeon RX 7900 XTX Taichi OC is more expensive than the average graphics card (£840 vs £520).
    £840 vs £520
  • No CUDA support
    This graphics card does not support CUDA, the average graphics card does.
  • 1 years older
    This graphics card was released earlier than the average graphics card (2022 vs 2023).
    December 2022
    2022 vs 2023
  • 75% smaller L2 cache
    This graphics card has fewer L2 cache than the average graphics card (6 MB vs 24 MB). The average graphics card has 24 MB L2 cache.
    6 MB vs 24 MB
  • No DLSS support
    This graphics card does not support DLSS, the average graphics card does.
  • Less advanced frame generation
    This graphics card has less advanced frame generation than the average graphics card (frame generation vs multi frame generation).
    frame generation vs multi frame generation
  • Older Vulkan version
    This graphics card supports an older Vulkan version than the average graphics card (1.3 vs 1.4).
    1.3 vs 1.4
  • Older DirectX version
    This graphics card supports an older DirectX version than the average graphics card (12 vs 12 Ultimate).
    12 vs 12 Ultimate
  • 79.9% larger GPU die
    This graphics card has a higher GPU die size than the average graphics card (529 mm² vs 294 mm²). The average graphics card has a GPU die size of 294 mm².
    529 mm² vs 294 mm²
  • Older OpenCL version
    This graphics card supports an older OpenCL version than the average graphics card (2.1 vs 3).
    2.1 vs 3
  • Older HDMI version
    This graphics card supports an older HDMI version than the average graphics card (2.1 vs 2.1a).
    2.1 vs 2.1a
  • 65.1% higher TDP
    This graphics card has a higher TDP than the average graphics card (355 W vs 215 W). The average graphics card has a TDP of 215 W.
    355 W vs 215 W
  • 53.8% higher PSU requirement
    This graphics card has a higher PSU requirement than the average graphics card (1,000 W vs 650 W). The average graphics card has a PSU requirement of 650 W.
    1,000 W vs 650 W
  • 61.4% higher board power limit
    This graphics card has a higher board power limit than the average graphics card (355 W vs 220 W). The average graphics card has a board power limit of 220 W.
    355 W vs 220 W
  • 15 °C lower thermal ceiling
    This graphics card has a lower thermal ceiling than the average graphics card (110 °C vs 95 °C). The average graphics card has a thermal ceiling of 95 °C.
    110 °C vs 95 °C
  • 2.33x higher idle power draw
    This graphics card has a higher idle power draw than the average graphics card (28 W vs 12 W). The average graphics card has an idle power draw of 12 W.
    28 W vs 12 W
  • 96.4% higher peak power draw
    This graphics card has a higher peak power draw than the average graphics card (432 W vs 220 W). The average graphics card has a peak power draw of 220 W.
    432 W vs 220 W
  • 62.8 mm longer card length
    This graphics card is longer than the average graphics card (345 mm vs 282.2 mm). The average graphics card has a length of 282.2 mm.
    345 mm vs 282.2 mm
  • 15 mm higher card profile
    This graphics card is taller than the average graphics card (140 mm vs 125 mm). The average graphics card has a height of 125 mm.
    140 mm vs 125 mm
  • 0.5 slot/s wider design
    This graphics card occupies more slots than the average graphics card (3 slot/s vs 2.5 slot/s). The average graphics card occupies 2.5 slot/s.
    3 slot/s vs 2.5 slot/s
  • 74.8% heavier
    This graphics card is heavier than the average graphics card (1,772 g vs 1,014 g). The average graphics card weighs 1,014 g.
    1,772 g vs 1,014 g

Video reviews

Hands-on testing, unboxing, and real-world video evaluations

9.5
DasMonty
≈ estimated
03/06/2023
Hands-on review · performance, noise and temperature tests
Verdict
The ASRock Radeon RX 7900 XTX Taichi OC is very fast, very quiet and eye-catching, though it costs more and draws more power than standard versions.

Expert reviews

In-depth analysis and verdict from leading tech publications

10
techpowerup.com
✓ explicit
16/05/2023
Product review · All-white edition
Verdict
The ASRock RX 7900 XTX Taichi White is the gray Taichi OC in an all-white design, with the same factory overclock and stock memory.

Third-party reviews

What customers like about ASRock Radeon RX 7900 XTX Taichi OC

  • Exceptional rasterization performance, often surpassing the RTX 4080 in non-ray tracing titles
  • Superior cooling solution that maintains low GPU temperatures and offers an extremely quiet BIOS mode
  • High power headroom with 3x 8-pin power connectors, enabling better overclocking stability
  • Excellent build quality featuring a reinforced metal frame and backplate to prevent GPU sag
  • Aesthetic appeal, particularly the pearlescent white coating on the White OC edition
  • Generous 24 GB VRAM for longevity and 4K gaming readiness
  • Useful physical features like a dedicated hardware switch for RGB and an ARGB pin-header

What customers don't like about ASRock Radeon RX 7900 XTX Taichi OC

  • Significantly higher power consumption than the reference design, especially in multi-monitor setups
  • Common reports of audible coil whine, particularly when running at high frame rates
  • Ray tracing performance remains considerably lower than competing NVIDIA RTX 4080 cards
  • Large physical footprint requiring a spacious case (triple-slot design)
  • Higher price point compared to MSRP, often making it a 'tough sell' against NVIDIA's offerings
  • Complex overclocking process with diminishing returns for average users
  • Potential for high 'hotspot' temperatures if thermal pad application or case airflow is not optimal

Verdict

The ASRock Radeon RX 7900 XTX Taichi OC is a high-performance flagship graphics card based on the RDNA 3 architecture, featuring a massive 24GB of GDDR6 memory on a 384-bit bus and 96 compute units. This factory-overclocked model boasts an impressive boost clock of up to 2680 MHz and a 22-phase power design, supported by three 8-pin power connectors for a maximum input of 525W. Its main advantages include superior rasterization performance that often surpasses competing high-end cards, a highly efficient Taichi 3X cooling system with triple 110mm striped ring fans, and a premium build featuring a reinforced metal frame and dual BIOS. However, it suffers from a significant increase in power consumption compared to reference designs, notably lower ray tracing performance than its direct competitors, and high power draw during idle or multi-monitor setups.

Compare ASRock Radeon RX 7900 XTX Taichi OC with other products in the Graphics cards category

1Product to compare no. 1
VS
2Product to compare no. 2
VS
3Product to compare no. 3 (optional)

Graphic comparison of ASRock Radeon RX 7900 XTX Taichi OC and other products in the Graphics cards category

No results found