Scored using Fitness trackers Methodology v3.0
Fitness trackers Methodology v3.0
Mathematical & Unbiased Scoring
Products in this category are scored under Frontum Fitness trackers Methodology v3.0: the technical score from the specifications is the base, and independent expert and video reviews (up to ±0.5 points), owner opinions (up to ±0.3) and best-of lists (up to +0.3) move it up or down.
Explore Fitness trackers Methodology v3.0

Nilox ONAIR review: 163 specs compared

Avg. price:~£25Battery life:25 daysScreen size:N/A inchHeart rate monitor:yesGPS:noWaterproof depth rating:1.5 m

Nilox ONAIR Review: Compare 168 technical specifications and 1 best-of list to see how this product ranks in the Fitness trackers category and whether it is worth buying.
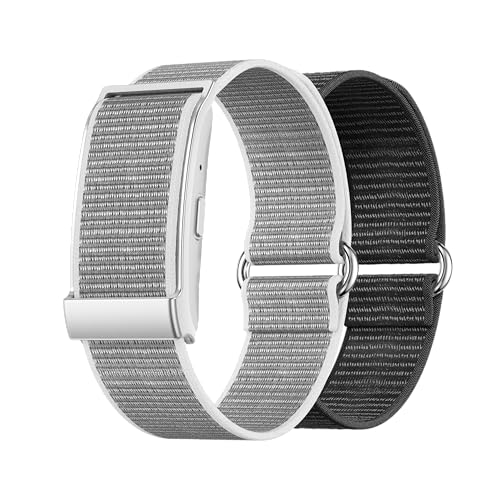
Nilox ONAIR
7.4/10

Overall score

Score
7.4/ 10
✕
What it is
Our main score for this model, 1–10. It combines specs, best-of lists, expert reviews and owners.
How we count it
Parts: Technical score 35%, List score 30%, Reviews score 25%, Sentiment score 10%
Marks: Each part gets a mark out of 10. For reviews, lists and owners, a typical model in this category gets about 8 and the best one gets 10.
No data yet: A part with no data shows "?". It counts as the mark of a weaker model in this category (4 in 5 models with data score higher). This way, models with reviews, lists and owners usually come out ahead.
Score distribution
▼
<55-66-77-88-99-10
Score components

35%

7.6

Technical score

30%

7.6

List score

25%

?

Reviews scoreNot enough data yet, so we use 7.2, the mark of a weaker model in this category

10%

?

Sentiment scoreNot enough data yet, so we use 7.1, the mark of a weaker model in this category

▲Better than 62% of fitness trackers
8.2

Value for money

Value for money
8.2/ 10
✕
What it is
An indicator that combines the fitness tracker's overall rating with its cost.
When it matters
When you are looking for a fitness tracker with a good balance between quality and price.
Score distribution
▼
<55-66-77-88-99-10
Score components

70%

7.4

Overall score

30%

10

Price

▲Better than 61%
7.6

Technical score

Technical score
7.6/ 10
✕
What it is
How good the specs are compared with the other models in this category, 1–10.
How we count it
Areas: We rate the specs in each area against the other models in this category.
Weighting: The areas that matter most to buyers count more. The shares are shown under Score components.
Share: The technical score is 35% of the overall score.
Score distribution
▼
<55-66-77-88-99-10
Score components

20%

7.9

Sports

20%

8.3

Battery

18%

8.9

Health

18%

4.0

Display

8%

7.8

Smart functions

8%

9.2

Wellness

4%

7.7

Connectivity

4%

8.6

Design

▲Better than 77%
?

Reviews score

Reviews score
✕
What it is
Average grade from independent test sites, magazines and video reviewers, 1–10.
How we count it
Grades: Each review's own score is converted to 1–10; without one, we grade the review ourselves. Big test sites count more, short reviews half as much as full tests. A video review counts half.
Score: The average grade is 80% of the review mark; the number of reviews is the other 20% (1 review = 5, the typical number in this category = 8, the most-reviewed model = 10).
Enough data: With few reviews, the average grade is pulled toward the typical grade of this category. No reviews yet: 7.2 for now.
Share: Reviews count 25% of the overall score.
Score distribution
▼
<55-66-77-88-99-10
Grades by review (0)
We have not found an independent test of this model yet. Until we do, its review part counts as 7.2.
User ratings collected online are not part of this score.
No expert tests yet
7.6

List score

List score
7.6/ 10
✕
What it is
How often independent test sites, magazines and video reviewers put this model in their best-of lists for this category.
How we count it
Points: The model in the most lists of this category gets 10; the others get 8 to 10 in proportion. In no list yet: 7.5. Lists count 30% of the overall score.
Enough data: Every list counts, even a single one. With fewer than 5 best-of lists in the category, this part is left out.
Lists with this model (1)
List score: in 1 of 65 lists (2%)
▲Better than 73%
  • nilox-onair
  • nilox-onair
  • nilox-onair
  • nilox-onair
  • nilox-onair
  • nilox-onair
  • nilox-onair
  • nilox-onair
  • nilox-onair
nilox-onair
nilox-onair
nilox-onair
nilox-onair
nilox-onair
nilox-onair
nilox-onair
nilox-onair
nilox-onair
Best prices
*As an Amazon Associate, we earn from qualifying purchases.
Best rankings
Available: ranking among products currently available (including other versions of this product).All: ranking among all products in the database.
Loading...
Loading category ranking...

Fitness trackers model ranking

Ranked #73 of 238 models in Fitness trackers (Overall score)

Technical Specifications of fitness tracker Nilox ONAIR

Technical score
Technical score
7.6/ 10
✕
What it is
How good the specs are compared with the other models in this category, 1–10.
How we count it
Areas: We rate the specs in each area against the other models in this category.
Weighting: The areas that matter most to buyers count more. The shares are shown under Score components.
Share: The technical score is 35% of the overall score.
Score distribution
▼
<55-66-77-88-99-10
Score components:

20%

7.9

Sports

20%

8.3

Battery

18%

8.9

Health

18%

4.0

Display

8%

7.8

Smart functions

8%

9.2

Wellness

4%

7.7

Connectivity

4%

8.6

Design

7.6
Reviews score
7.2
List score
7.6
Value for money
Value for money
8.2/ 10
✕
What it is
An indicator that combines the fitness tracker's overall rating with its cost.
When it matters
When you are looking for a fitness tracker with a good balance between quality and price.
Score distribution
▼
<55-66-77-88-99-10
Score components:

70%

7.4

Overall score

30%

10

Price

8.2
Heart rate monitor
yes
This fitness tracker supports heart rate monitoring. 36.2% of fitness trackers support heart rate monitoring.
Resting heart rate
yes
This fitness tracker supports Resting heart rate. 47.5% of fitness trackers support Resting heart rate.
Fast/slow heart rate alerts
no
This fitness tracker does not support high and low heart rate alerts. 36.5% of fitness trackers support high and low heart rate alerts.
Irregular heart rate alerts
no
This fitness tracker does not support irregular heart rate alerts. 13.7% of fitness trackers support irregular heart rate alerts.
Blood oxygen sensor
yes
This fitness tracker has a blood oxygen sensor. 68.2% of fitness trackers have a blood oxygen sensor.
Show more
GPS
no
This fitness tracker does not have GPS. 12.7% of fitness trackers have GPS.
Satellite systems supported
no
This fitness tracker supports no satellite systems which is less versatile than that of 14.4% of fitness trackers and the same as that of 85.6% of fitness trackers.
GNSS bands supported
N/A
Galileo support
N/A
Acquires GPS faster
N/A
Show more
Notifications
yes
This fitness tracker supports notifications. 27.8% of fitness trackers support notifications.
Vibrating alerts
yes
This fitness tracker supports vibration alerts. 14.3% of fitness trackers support vibration alerts.
Call control
?
Call answering
no
This fitness tracker does not support call answering. 0.9% of fitness trackers support call answering.
Calendar sync
no
This fitness tracker does not support calendar sync. 20.5% of fitness trackers support calendar sync.
Show more
Activity reports
yes
This fitness tracker supports activity reports. 5% of fitness trackers support activity reports.
Goal setting
yes
This fitness tracker supports goal setting. 2.5% of fitness trackers support goal setting.
Achievements
?
Inactivity alerts
yes
This fitness tracker supports inactivity alerts. 21.4% of fitness trackers support inactivity alerts.
Coaching
yes
This fitness tracker supports coaching. 64% of fitness trackers support coaching.
Show more
Bluetooth version
?
Maximum Bluetooth range
?
NFC
no
This fitness tracker does not have NFC. 11.8% of fitness trackers have NFC.
Wi-Fi connectivity
no
This fitness tracker does not support Wi-Fi. 2.5% of fitness trackers support Wi-Fi.
Wi-Fi version
no
This fitness tracker does not support modern Wi-Fi. 0.9% of fitness trackers support modern Wi-Fi.
Show more
Battery life
25 days
This fitness tracker offers a battery life of 25 days which is longer than that of 85.1% of fitness trackers and equal to that of 0.4% of fitness trackers.
Battery life with GPS on
N/A
Battery life in training mode
?
Power-saving battery life
?
Battery capacity
180 mAh
This fitness tracker has a battery capacity of 180 mAh which is higher than that of 64.1% of fitness trackers and equal to that of 7.1% of fitness trackers.
Show more
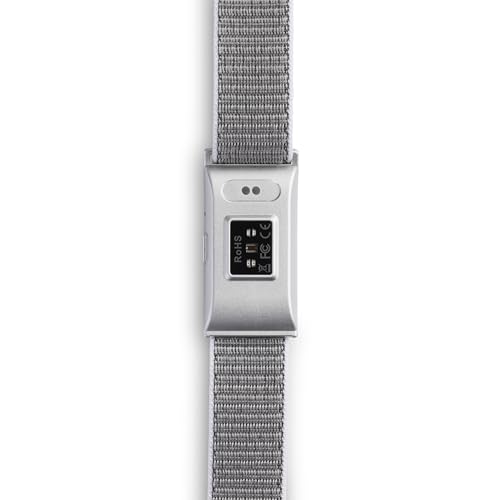
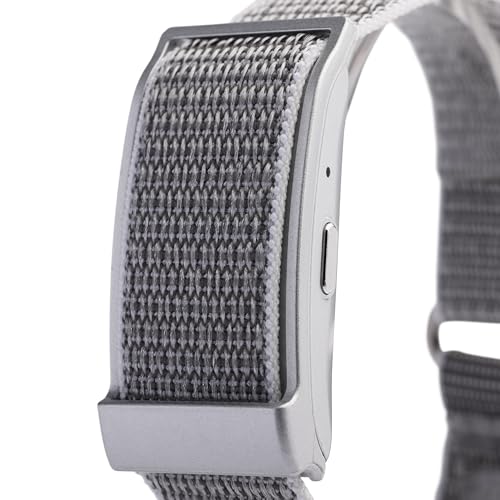
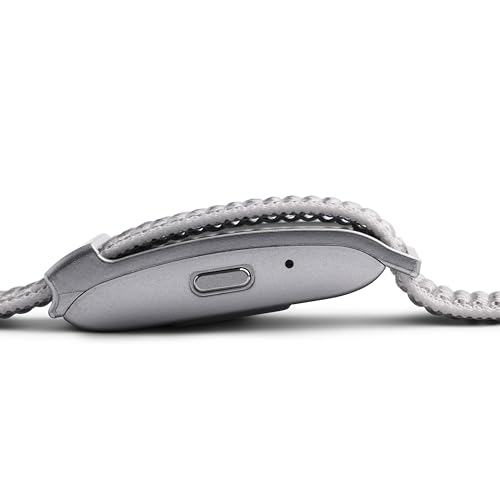
Display
no
This fitness tracker does not have a display. 74.2% of fitness trackers have a display.
Screen size
N/A
Display type
N/A
Screen resolution
N/A
Pixel density
N/A
Show more
Form factor
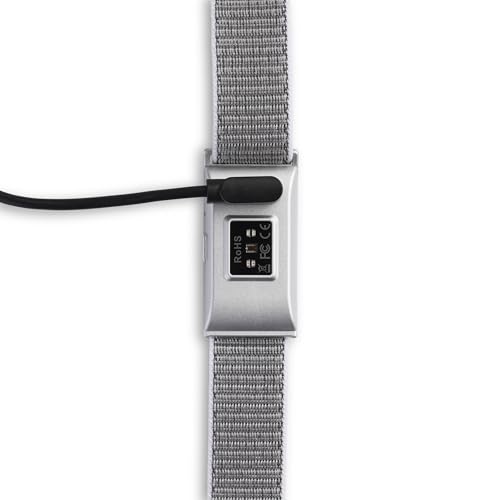
wristband
Hybrid design
no
This fitness tracker does not support Hybrid design. 2.1% of fitness trackers support Hybrid design.
Designed for kids
no
This fitness tracker is not designed for kids. 3.3% of fitness trackers are designed for kids.
Replaceable watch band
yes
This fitness tracker has a replaceable watch band. 23.4% of fitness trackers have a replaceable watch band.
Band width
?
Show more

Nilox ONAIR vs the average fitness tracker

246810TotalHealthSportsBatteryDisplayConnectivitySmart functionsDesignWellness
  • 15 days longer battery life
    This fitness tracker has a higher battery life than the average fitness tracker (25 days vs 10 days). The average fitness tracker has 10 days of battery life.
    25 days vs 10 days
  • Blood oxygen monitoring
    This fitness tracker has a blood oxygen sensor, while the average fitness tracker does not. 32.1% of fitness trackers have a blood oxygen sensor.
  • Tracks HRV
    This fitness tracker supports HRV tracking, while the average fitness tracker does not. 15.1% of fitness trackers support HRV tracking.
  • Smart alarm
    This fitness tracker supports a smart alarm, while the average fitness tracker does not. 30.8% of fitness trackers support a smart alarm.
  • Multi-sport mode
    This fitness tracker supports multi-sport mode, while the average fitness tracker does not. 14.5% of fitness trackers support multi-sport mode.
  • Coaching features
    This fitness tracker supports coaching, while the average fitness tracker does not. 36.3% of fitness trackers support coaching.
  • Continuous SpO₂ monitoring
    This fitness tracker supports continuous SpO₂ monitoring, while the average fitness tracker does not. 16.3% of fitness trackers support continuous SpO₂ monitoring.
  • Built-in temperature sensor
    This fitness tracker has a temperature sensor, while the average fitness tracker does not. 13.4% of fitness trackers have a temperature sensor.
  • 2.8x cheaper
    Nilox ONAIR is cheaper than the average fitness tracker (£25 vs £70).
    £25 vs £70
  • Blood oxygen monitoring
    This fitness tracker has a blood oxygen sensor, while the average fitness tracker does not. 32.1% of fitness trackers have a blood oxygen sensor.
  • Tracks HRV
    This fitness tracker supports HRV tracking, while the average fitness tracker does not. 15.1% of fitness trackers support HRV tracking.
  • Continuous SpO₂ monitoring
    This fitness tracker supports continuous SpO₂ monitoring, while the average fitness tracker does not. 16.3% of fitness trackers support continuous SpO₂ monitoring.
  • Built-in temperature sensor
    This fitness tracker has a temperature sensor, while the average fitness tracker does not. 13.4% of fitness trackers have a temperature sensor.
  • Tracks skin temperature
    This fitness tracker supports skin temperature tracking, while the average fitness tracker does not. 15.3% of fitness trackers support skin temperature tracking.
  • Tracks menstrual cycle
    This fitness tracker supports menstrual cycle tracking, while the average fitness tracker does not. 45.2% of fitness trackers support menstrual cycle tracking.
  • Period notifications
    This fitness tracker has period notifications, while the average fitness tracker does not. 34.6% of fitness trackers have period notifications.
  • Ovulation prediction
    This fitness tracker predicts ovulation, while the average fitness tracker does not. 44.1% of fitness trackers predict ovulation.
  • Cycle start prediction
    This fitness tracker predicts the start date, while the average fitness tracker does not. 45.8% of fitness trackers predict the start date.
  • Blood pressure monitoring
    This fitness tracker supports blood pressure monitoring, while the average fitness tracker does not. 5% of fitness trackers support blood pressure monitoring.
  • Multi-sport mode
    This fitness tracker supports multi-sport mode, while the average fitness tracker does not. 14.5% of fitness trackers support multi-sport mode.
  • Built-in gyroscope
    This fitness tracker has a gyroscope, while the average fitness tracker does not. 28.7% of fitness trackers have a gyroscope.
  • 91.5 more exercise modes
    This fitness tracker has more exercise modes than the average fitness tracker (100 vs 8.5). The average fitness tracker offers 8.5 exercise modes.
    100 vs 8.5
  • 15 days longer battery life
    This fitness tracker has a higher battery life than the average fitness tracker (25 days vs 10 days). The average fitness tracker has 10 days of battery life.
    25 days vs 10 days
  • 44% larger battery capacity
    This fitness tracker has a higher battery capacity than the average fitness tracker (180 mAh vs 125 mAh). The average fitness tracker has 125 mAh of battery capacity.
    180 mAh vs 125 mAh
  • Smart alarm
    This fitness tracker supports a smart alarm, while the average fitness tracker does not. 30.8% of fitness trackers support a smart alarm.
  • Camera remote control
    This fitness tracker supports camera remote control, while the average fitness tracker does not. 40.6% of fitness trackers support camera remote control.
  • 37.5% lighter
    This fitness tracker is lighter than the average fitness tracker (15 g vs 24 g). The average fitness tracker weighs 24 g.
    15 g vs 24 g
  • Coaching features
    This fitness tracker supports coaching, while the average fitness tracker does not. 36.3% of fitness trackers support coaching.
  • 48.5 m lower waterproof depth rating
    This fitness tracker has a lower waterproof depth rating than the average fitness tracker (1.5 m vs 50 m). The average fitness tracker has a waterproof depth rating of 50 m.
    1.5 m vs 50 m
  • Not compatible with smart scales
    This fitness tracker is not compatible with smart scales, while the average fitness tracker is. 64.9% of fitness trackers are compatible with smart scales.
  • 5.0% lower list score
    List score
    7.6/ 10
    ✕
    What it is
    How often independent test sites, magazines and video reviewers put this model in their best-of lists for this category.
    How we count it
    Points: The model in the most lists of this category gets 10; the others get 8 to 10 in proportion. In no list yet: 7.5. Lists count 30% of the overall score.
    Enough data: Every list counts, even a single one. With fewer than 5 best-of lists in the category, this part is left out.
    Lists with this model (1)
    List score: in 1 of 65 lists (2%)
    7.6 vs 8.0
  • No display
    This fitness tracker does not have a display, while the average fitness tracker does. 73.9% of fitness trackers have a display.
  • 5.0% lower list score
    List score
    7.6/ 10
    ✕
    What it is
    How often independent test sites, magazines and video reviewers put this model in their best-of lists for this category.
    How we count it
    Points: The model in the most lists of this category gets 10; the others get 8 to 10 in proportion. In no list yet: 7.5. Lists count 30% of the overall score.
    Enough data: Every list counts, even a single one. With fewer than 5 best-of lists in the category, this part is left out.
    Lists with this model (1)
    List score: in 1 of 65 lists (2%)
    7.6 vs 8.0
  • No display
    This fitness tracker does not have a display, while the average fitness tracker does. 73.9% of fitness trackers have a display.
  • 48.5 m lower waterproof depth rating
    This fitness tracker has a lower waterproof depth rating than the average fitness tracker (1.5 m vs 50 m). The average fitness tracker has a waterproof depth rating of 50 m.
    1.5 m vs 50 m
  • Not compatible with smart scales
    This fitness tracker is not compatible with smart scales, while the average fitness tracker is. 64.9% of fitness trackers are compatible with smart scales.

Third-party reviews

What we like about Nilox ONAIR

  • 25 days of battery life means very few charges.
  • At 15 g it is light enough to forget on the wrist.
  • Continuous SpO₂ monitoring tracks blood oxygen over time.
  • IP68 and 1.5 m depth cover rain and a pool session.
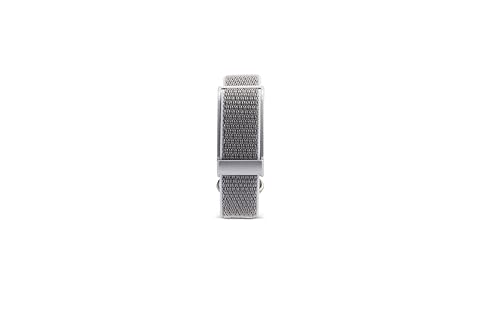
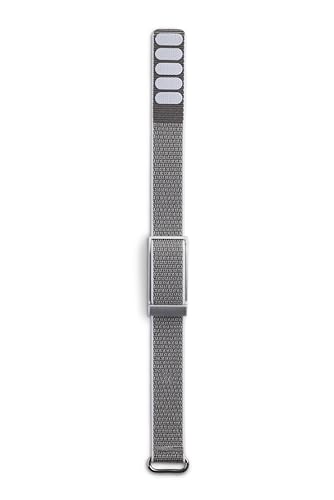
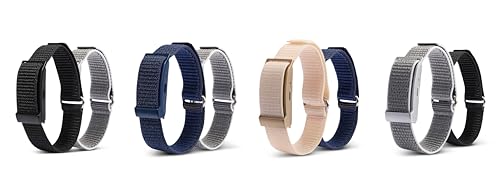
  • The band can be replaced when you want a new look.
  • A gyroscope and accelerometer track movement.

What we don't like about Nilox ONAIR

  • There is no display, so readings sit only in the app.
  • There is no GPS and no satellite support for outdoor routes.
  • The 1.5 m depth rating rules out diving.
  • 0.064 GB of internal storage leaves little room for music.

Verdict

Anyone who wants a tracker they forget about should look at the Nilox ONAIR. At 15 g and 11 mm thick, it sits lightly on the wrist, and the band can be replaced. Battery life is 25 days, so charging is rare. It tracks steps, sleep and heart rate, and adds continuous SpO₂ monitoring, HRV and a blood pressure reading for a fuller picture. A gyroscope and accelerometer pick up movement, and a multi-sport mode covers several workouts. It is rated IP68 to 1.5 m, so rain and a pool session are no problem. The trade-off is the screen. There is no display, so you check your numbers in the app. It suits someone who wants a light tracker for sleep and daily activity and does not need a screen.

Compare Nilox ONAIR with other products in the Fitness trackers category

1Product to compare no. 1
VS
2Product to compare no. 2
VS
3Product to compare no. 3 (optional)

Graphic comparison of Nilox ONAIR and other products in the Fitness trackers category

No results found