Scored using Tablets Methodology v3.0
Tablets Methodology v3.0
Mathematical & Unbiased Scoring
Products in this category are scored under Frontum Tablets Methodology v3.0: the technical score from the specifications is the base, and independent expert and video reviews (up to ±0.5 points), owner opinions (up to ±0.3) and best-of lists (up to +0.3) move it up or down.
Explore Tablets Methodology v3.0

TCL NXTPAPER WiFi (4GB + 64GB) review: 168 specs compared

Avg. price:~£140RAM capacity:4 GBInternal storage:64 GBScreen size:8.88 inchesChipset:MediaTek MT8768

TCL NXTPAPER WiFi (4GB + 64GB) Review: Compare 168 technical specifications to see how this product ranks in the Tablets category and whether it is worth buying.
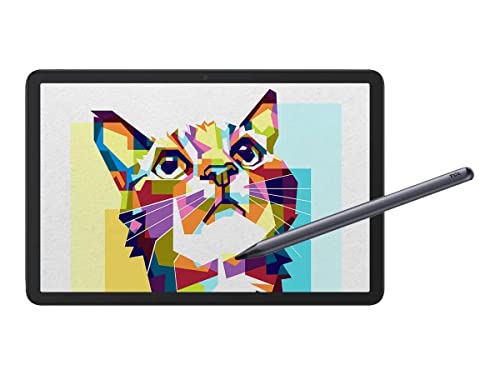
TCL NXTPAPER WiFi (4GB + 64GB)
7.2/10

Overall score

Score
7.2/ 10
✕
What it is
Our main score for this model, 1–10. It combines specs, best-of lists, expert reviews and owners.
How we count it
Parts: Technical score 35%, List score 30%, Reviews score 25%, Sentiment score 10%
Marks: Each part gets a mark out of 10. For reviews, lists and owners, a typical model in this category gets about 8 and the best one gets 10.
No data yet: A part with no data shows "?". It counts as the mark of a weaker model in this category (4 in 5 models with data score higher). This way, models with reviews, lists and owners usually come out ahead.
Score distribution
â–¼
<55-66-77-88-99-10
Score components

35%

6.4

Technical score

30%

?

List scoreNot enough data yet, so we use 7.5, the mark of a weaker model in this category

25%

?

Reviews scoreNot enough data yet, so we use 7.4, the mark of a weaker model in this category

10%

8.5

Sentiment score

â–²Better than 60% of tablets
8.0

Value for money

Value for money
8.0/ 10
✕
What it is
An indicator that combines the tablet's overall rating with its cost.
When it matters
When you are looking for a tablet with a good balance between quality and price.
Score distribution
â–¼
<55-66-77-88-99-10
Score components

70%

7.2

Overall score

30%

9.8

Price

â–²Better than 80%
6.4

Technical score

Technical score
6.4/ 10
✕
What it is
How good the specs are compared with the other models in this category, 1–10.
How we count it
Areas: We rate the specs in each area against the other models in this category.
Weighting: The areas that matter most to buyers count more. The shares are shown under Score components.
Share: The technical score is 35% of the overall score.
Score distribution
â–¼
<55-66-77-88-99-10
Score components

22%

5.7

Performance

20%

5.8

Display

16%

7.1

Camera

14%

5.5

Battery

12%

7.2

Connectivity

8%

8.2

Software

5%

8.3

Design

3%

6.4

Audio

â–²Better than 58%
?

Reviews score

Reviews score
✕
What it is
Average grade from independent test sites, magazines and video reviewers, 1–10.
How we count it
Grades: Each review's own score is converted to 1–10; without one, we grade the review ourselves. Big test sites count more, short reviews half as much as full tests. A video review counts half.
Score: The average grade is 80% of the review mark; the number of reviews is the other 20% (1 review = 5, the typical number in this category = 8, the most-reviewed model = 10).
Enough data: With few reviews, the average grade is pulled toward the typical grade of this category. No reviews yet: 7.4 for now.
Share: Reviews count 25% of the overall score.
Score distribution
â–¼
<55-66-77-88-99-10
Grades by review (0)
We have not found an independent test of this model yet. Until we do, its review part counts as 7.4.
User ratings collected online are not part of this score.
No expert tests yet
?

List score

List score
7.5/ 10
✕
What it is
How often independent test sites, magazines and video reviewers put this model in their best-of lists for this category.
How we count it
Points: The model in the most lists of this category gets 10; the others get 8 to 10 in proportion. In no list yet: 7.5. Lists count 30% of the overall score.
Enough data: Every list counts, even a single one. With fewer than 5 best-of lists in the category, this part is left out.
Lists with this model (0)
Not in any best-of list yet, so this part counts as 7.5. Models in a list get 8 to 10.
Not in any best-of list yet

What owners say about the TCL NXTPAPER WiFi (4GB + 64GB)

Based on 162 owners sharing their experience in online comments

57%positive0%mixed43%negative

Owners praise the eye-friendly screen, smooth performance, and value, while battery life and software limitations frustrate many.

What owners dislike

  • Owners say the battery drains fast when the screen shows full color or is used normally, and some report it charges slowly.13
  • Owners say it lacks a gallery app, audio recorder, app lock, split screen, private folder and per-app data limits, plus handwriting-to-text in some languages.9
  • Owners report constant lag and stuttering, slow app response and trouble playing 1080p video smoothly.7
  • Owners say the camera often fails to focus unless the screen is tapped several times, and photos look poor in WhatsApp and at night.7
  • Owners sensitive to flicker say the temporal dithering causes eye strain and headaches, and on the 70 Pro it cannot be turned off.4
  • Owners say the phone gets warm during normal use like video calls or browsing, and some report heat while charging; one says an update helped.4
  • Owners say the speakers sound tinny, and calls are hard to hear unless on speakerphone.4
  • Owners report the screen scratches within days and that it cracked or broke after a single drop.4
  • Some buyers say the case and stylus were missing in their country, so they had to buy a case separately and wait for the pen.4
  • Owners say whites look too bright in normal mode even at low brightness, and text contrast looks blurry, especially when viewed head-on.3

Points mentioned by at least 3 owners, most mentioned first.

Loading...
Loading category ranking...

Technical Specifications of tablet TCL NXTPAPER WiFi (4GB + 64GB)

Technical score
Technical score
6.4/ 10
✕
What it is
How good the specs are compared with the other models in this category, 1–10.
How we count it
Areas: We rate the specs in each area against the other models in this category.
Weighting: The areas that matter most to buyers count more. The shares are shown under Score components.
Share: The technical score is 35% of the overall score.
Score distribution
â–¼
<55-66-77-88-99-10
Score components:

22%

5.7

Performance

20%

5.8

Display

16%

7.1

Camera

14%

5.5

Battery

12%

7.2

Connectivity

8%

8.2

Software

5%

8.3

Design

3%

6.4

Audio

6.4
Reviews score
7.4
List score
?
Value for money
Value for money
8.0/ 10
✕
What it is
An indicator that combines the tablet's overall rating with its cost.
When it matters
When you are looking for a tablet with a good balance between quality and price.
Score distribution
â–¼
<55-66-77-88-99-10
Score components:

70%

7.2

Overall score

30%

9.8

Price

8.0
RAM capacity
4 GB
This tablet has 4 GB of RAM, which is more than 47.2% of tablets and equal to 17.8% of tablets.
Process node
12 nm
This tablet is built on a 12 nm process, which is smaller than 53.2% of tablets and equal to 13.9% of tablets.
Internal storage
64 GB
This tablet has 64 GB of internal storage, which is more than 39.1% of tablets and equal to 17% of tablets.
Geekbench 6 single-core score
317 points
This tablet scores 317 points in single-core tests, which is lower than 84.1% of tablets and equal to 0.4% of tablets.
Chipset
MediaTek MT8768
This tablet runs on MediaTek MT8768, which is less advanced than 85.5% of tablets and equal to 1% of tablets.
Show more
Screen resolution
1440×1080
This tablet has a 1440×1080 screen, which is less sharp than 64.1% of tablets.
Refresh rate
60 Hz
This tablet has a 60 Hz screen, which is smoother than 0.1% of tablets and equal to 73.4% of tablets.
Display type
IPS LCD
This tablet uses a IPS LCD display type. 17% of tablets use this display technology.
Pixel density
203 ppi
This tablet has a pixel density of 203 ppi, which is lower than 62.8% of tablets and equal to 0.6% of tablets.
Display glass type
Tempered Glass
This tablet protects its screen with Tempered Glass, which is less durable than 78% of tablets and the same as 19.6% of tablets.
Show more
Optical image stabilization
no
This tablet does not support optical stabilisation. 0.4% of tablets offer this.
Main camera megapixels
8 MP
This tablet has a rear camera with 8 MP resolution, which is higher than 36.4% of tablets and equal to 31.9% of tablets.
Front camera megapixels
5 MP
This tablet has a front camera with 5 MP resolution, which is higher than 48.6% of tablets and equal to 19.7% of tablets.
Main camera aperture
f/2.0
This tablet has a main camera aperture of f/2.0, which is wider than 57.4% of tablets and equal to 24.7% of tablets.
Optical zoom
1xxx
This tablet has 1xx optical zoom, which is stronger than 18.2% of tablets and equal to 80.9% of tablets.
Show more
Battery capacity
8,000 mAh
This tablet has 8,000 mAh battery capacity, which is larger than 70.2% of tablets and equal to 4% of tablets.
Charging speed
18 W
This tablet charges at 18 W, which is faster than 48% of tablets and equal to 12.3% of tablets.
Battery life
8 hours
This tablet has a battery life of 8 hours, which is shorter than that of 72.2% of tablets and equal to that of 11.9% of tablets.
video playback
Wireless charging
no
This tablet does not support wireless charging. 1.5% of tablets offer this.
Fast charging
yes
This tablet supports fast charging. 43.2% of tablets offer this.
Show more
LTE support
no
This tablet does not have built-in LTE. 42.9% of tablets offer this.
Wi-Fi connectivity
yes
This tablet connects to Wi-Fi. 0.2% of tablets offer this.
GPS
yes
This tablet has built-in GPS. 17.1% of tablets offer this.
5G connectivity
no
This tablet does not support 5G. 8.1% of tablets offer this.
NFC
no
This tablet does not include NFC. 10.8% of tablets offer this.
Show more
Operating system
Android
This tablet uses the Android operating system, which is more advanced than the one used by 23.2%.
Update support duration
short
This tablet offers short update support, which is shorter than the support period of 52.4% of tablets and equal to that of 47.6% of tablets.
Direct OS updates
yes
This tablet supports direct OS updates. 20.3% of tablets offer this.
On-device AI
yes
This tablet supports on-device AI. 71.7% of tablets support this capability.
App tracking protection
yes
This tablet supports app tracking protection. 71.6% of tablets offer this.
Show more
IP rating
?
Weight
316 g
This tablet weighs 316 g, which is lighter than 89.7% of tablets and equal to 0.3% of tablets.
Backlit keyboard
yes
This tablet supports a backlit keyboard. 90.4% of tablets support backlit keyboards.
Keyboard accessory
yes
This tablet supports a keyboard accessory. 15.8% of tablets support this option.
Pen latency
?
Show more
Number of microphones
2
This tablet has a microphone array of 2, which is more than 55.1% of tablets and equal to 32.7% of tablets.
aptX Adaptive
no
This tablet does not support aptX Adaptive. 6.9% of tablets offer this.
Dolby Atmos support
no
This tablet does not support Dolby Atmos. 31.3% of tablets support Dolby Atmos.
N. of speakers
4
This tablet includes 4 speakers, which is more than in 70.8% of tablets and equal to the number in 22.9% of tablets.
FM radio
yes
This tablet includes an FM radio. 81.1% of tablets offer this.
Show more

TCL NXTPAPER WiFi (4GB + 64GB) vs the average tablet

246810TotalPerformanceDisplayCameraBatteryConnectivitySoftwareDesignAudio
  • Wider color gamut
    This tablet supports a wider color gamut than the average tablet (DCI-P3 vs sRGB). The average tablet covers sRGB color gamut.
    96% DCI-P3 coverage reported.
    DCI-P3 vs sRGB
  • More vivid contrast
    This tablet has more contrast than the average tablet (1591:1 vs 1015:1). The average tablet has a contrast ratio of 1015:1.
    1,591:1 vs 1,015:1
  • 2 more speakers
    This tablet has more speakers than the average tablet (4 vs 2). The average tablet has 2 speakers.
    4 vs 2
  • Supports eSIM
    This tablet supports eSIM, the average tablet does not. 11.3% of tablets support eSIM.
  • 35.5% lighter
    This tablet is lighter than the average tablet (316 g vs 490 g). The average tablet weighs 490 g.
    316 g vs 490 g
  • Supports manual shutter speed
    This tablet supports manual shutter speed, while the average tablet does not. 21.8% of tablets support manual shutter speed.
  • Includes anti-reflection coating
    This tablet has anti-reflection coating, the average tablet does not. 24.6% of tablets use anti-reflection coating.
  • Wider front camera aperture
    This tablet has a wider front camera aperture than the average tablet (f/2 vs f/2.2). The average tablet's front camera aperture is f/2.2.
    f/2.0 vs f/2.2
  • 85.7% cheaper
    TCL NXTPAPER WiFi (4GB + 64GB) is cheaper than the average tablet (£140 vs £260).
    £140 vs £260
  • 13.3% higher sentiment score
    8.5 vs 7.5
  • 5.8% better value for money
    TCL NXTPAPER WiFi (4GB + 64GB) has better value for money than the average tablet (7.99 vs 7.6).
    7.99 vs 7.55
  • More advanced memory type
    This tablet uses more advanced memory than the average tablet (LPDDR4X vs LPDDR3).
    LPDDR4X vs LPDDR3
  • 14.3% smaller process node
    This tablet has a smaller process node than the average tablet (12 nm vs 14 nm). The average tablet is built on 14 nm.
    12 nm vs 14 nm
  • Wider color gamut
    This tablet supports a wider color gamut than the average tablet (DCI-P3 vs sRGB). The average tablet covers sRGB color gamut.
    96% DCI-P3 coverage reported.
    DCI-P3 vs sRGB
  • More vivid contrast
    This tablet has more contrast than the average tablet (1591:1 vs 1015:1). The average tablet has a contrast ratio of 1015:1.
    1,591:1 vs 1,015:1
  • Includes anti-reflection coating
    This tablet has anti-reflection coating, the average tablet does not. 24.6% of tablets use anti-reflection coating.
  • 99 nits brighter screen
    This tablet is brighter than the average tablet (500 nits vs 401 nits). The average tablet reaches 401 nits.
    500 nits vs 401 nits
  • Supports manual shutter speed
    This tablet supports manual shutter speed, while the average tablet does not. 21.8% of tablets support manual shutter speed.
  • Wider front camera aperture
    This tablet has a wider front camera aperture than the average tablet (f/2 vs f/2.2). The average tablet's front camera aperture is f/2.2.
    f/2.0 vs f/2.2
  • Wider main camera aperture
    This tablet has a wider main camera aperture than the average tablet (f/2 vs f/2.2). The average tablet's main camera aperture is f/2.2.
    f/2.0 vs f/2.2
  • 21.2% larger battery capacity
    This tablet has a larger battery capacity than the average tablet (8,000 mAh vs 6,600 mAh). The average tablet offers 6,600 mAh of battery capacity.
    8,000 mAh vs 6,600 mAh
  • Supports reverse wireless charging
    This tablet supports reverse wireless charging, while the average tablet does not. 4.1% of tablets support reverse wireless charging.
  • Supports eSIM
    This tablet supports eSIM, the average tablet does not. 11.3% of tablets support eSIM.
  • Includes on-device AI
    This tablet includes on-device AI, the average tablet does not. 28.3% of tablets include on-device AI.
  • Supports app tracking protection
    This tablet supports app tracking protection, while the average tablet does not. 28.4% of tablets offer this.
  • Supports extra dim mode
    This tablet supports extra dim mode, while the average tablet does not. 35.9% of tablets offer this.
  • Includes clipboard warnings
    This tablet has clipboard warnings, the average tablet does not. 40.3% of tablets include clipboard warnings.
  • 35.5% lighter
    This tablet is lighter than the average tablet (316 g vs 490 g). The average tablet weighs 490 g.
    316 g vs 490 g
  • Supports drawing
    This tablet is suitable for drawing, while the average tablet is not. 40% of tablets are suitable for drawing.
  • Includes backlit keyboard
    This tablet has a backlit keyboard, the average tablet does not. 9.6% of tablets offer a backlit keyboard.
  • 2 more speakers
    This tablet has more speakers than the average tablet (4 vs 2). The average tablet has 2 speakers.
    4 vs 2
  • 1 more microphones
    This tablet has more microphones than the average tablet (2 vs 1). The average tablet's microphone count is 1.
    2 vs 1
  • Shorter update support
    This tablet offers shorter update support than the average tablet (short vs medium). The average tablet gets medium of update support.
    short vs medium
  • 2 hours shorter battery life
    This tablet offers shorter battery life than the average tablet (8 hours vs 10 hours). The average tablet offers 10 hours of battery life.
    video playback
    8 hours vs 10 hours
  • Less durable glass
    This tablet has less durable glass than the average tablet (Tempered Glass vs Corning Gorilla Glass). The average tablet uses Corning Gorilla Glass.
    Tempered Glass vs Corning Gorilla Glass
  • No manual white balance
    This tablet does not support manual white balance, while the average tablet does. 51.5% of tablets support manual white balance.
  • 56.5% lower single-core score
    This tablet has a lower single-core score than the average tablet (317 points vs 729 points). The average tablet scores 729 points in single-core tests.
    317 points vs 729 points
  • No headphone jack
    This tablet does not include a 3.5 mm headphone jack, while the average tablet does. 72.8% of tablets offer this.
  • More basic graphics
    This tablet has less advanced graphics than the average tablet (PowerVR GE8320 vs Mali-G51).
    PowerVR GE8320 vs Mali-G51
  • 1.22 inches smaller screen
    This tablet has a smaller screen than the average tablet (8.9 inches vs 10.1 inches). The average tablet measures 10.1 inches.
    8.88 inches vs 10.1 inches
  • 56.5% lower single-core score
    This tablet has a lower single-core score than the average tablet (317 points vs 729 points). The average tablet scores 729 points in single-core tests.
    317 points vs 729 points
  • More basic graphics
    This tablet has less advanced graphics than the average tablet (PowerVR GE8320 vs Mali-G51).
    PowerVR GE8320 vs Mali-G51
  • 14.1% less memory bandwidth
    This tablet has less memory bandwidth than the average tablet (12.8 GB/s vs 14.9 GB/s). The average tablet has 14.9 GB/s of memory bandwidth.
    12.8 GB/s vs 14.9 GB/s
  • Less durable glass
    This tablet has less durable glass than the average tablet (Tempered Glass vs Corning Gorilla Glass). The average tablet uses Corning Gorilla Glass.
    Tempered Glass vs Corning Gorilla Glass
  • 1.22 inches smaller screen
    This tablet has a smaller screen than the average tablet (8.9 inches vs 10.1 inches). The average tablet measures 10.1 inches.
    8.88 inches vs 10.1 inches
  • 8.1% softer screen detail
    This tablet has softer screen detail than the average tablet (203 ppi vs 221 ppi). The average tablet has a pixel density of 221 ppi.
    203 ppi vs 221 ppi
  • Less sharp display
    This tablet has a less sharp screen than the average tablet (1440×1080 vs 1920×1200).
    1,440×1,080 vs 1,920×1,200
  • No manual white balance
    This tablet does not support manual white balance, while the average tablet does. 51.5% of tablets support manual white balance.
  • 2 hours shorter battery life
    This tablet offers shorter battery life than the average tablet (8 hours vs 10 hours). The average tablet offers 10 hours of battery life.
    video playback
    8 hours vs 10 hours
  • Shorter update support
    This tablet offers shorter update support than the average tablet (short vs medium). The average tablet gets medium of update support.
    short vs medium
  • No headphone jack
    This tablet does not include a 3.5 mm headphone jack, while the average tablet does. 72.8% of tablets offer this.

Video reviews

Hands-on testing, unboxing, and real-world video evaluations
Shop video

Third-party reviews

What customers like about TCL NXTPAPER WiFi (4GB + 64GB)

  • Innovative matte display that effectively reduces glare and eye strain
  • Paper-like screen texture provides a unique reading and writing experience
  • Excellent battery life, especially when using power-saving reading modes
  • Quality quad-speaker setup with loud and clear audio output
  • Affordable price point compared to high-end tablets and specialized e-readers
  • Near-stock Android experience with minimal pre-installed bloatware
  • Good build quality that feels premium for a budget device

What customers don't like about TCL NXTPAPER WiFi (4GB + 64GB)

  • Sluggish overall performance due to a low-to-midrange processor
  • Screen can appear dim, fuzzy, or muted compared to traditional vivid LCD/OLED panels
  • Slow Wi-Fi 5 connectivity leads to longer download times and browsing lag
  • Poor camera quality, particularly in low-light indoor environments
  • Limited long-term software support with few promised Android version updates
  • Long charging times (often over 3 hours) using the included 18W adapter
  • Lack of advanced biometric security beyond basic (and sometimes inconsistent) face unlock

Verdict

The TCL NXTPAPER 10s WiFi (4GB + 64GB) is a specialized 10.1-inch tablet featuring a unique matte-finish IPS display (1920 x 1200 resolution) designed with 10 protective layers to replicate a paper-like feel while reducing blue light emission and glare. It is powered by a MediaTek MT8768 octa-core processor and an 8000mAh battery, supporting 18W fast charging and basic productivity via an included stylus. Main pros include its exceptional eye comfort for long reading sessions, impressive battery life of up to 15 hours for movie playback, and a durable build that includes a 3.5mm headphone jack. However, the screen's matte layers result in lower contrast and muted colors compared to standard LCDs, and the device can feel sluggish during intensive multitasking or web browsing due to its entry-level hardware.

Compare TCL NXTPAPER WiFi (4GB + 64GB) with other tablets

1Product to compare no. 1
VS
2Product to compare no. 2
VS
3Product to compare no. 3 (optional)

Graphic comparison of TCL NXTPAPER WiFi (4GB + 64GB) and other tablets

No results found