Scored using Tablets Methodology v1.0
Tablets Methodology v1.0
Mathematical & Unbiased Scoring
Products in this category are scored under Frontum Tablets Methodology v1.0: technical specifications plus authentic consumer ratings, with 0% commercial bias.
Explore Tablets Methodology v1.0

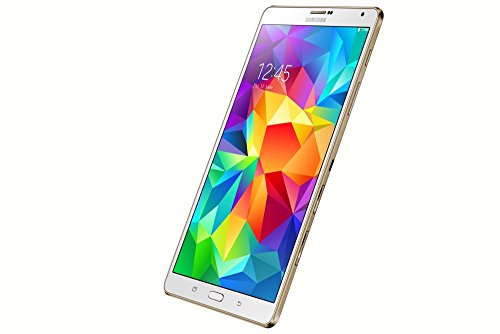
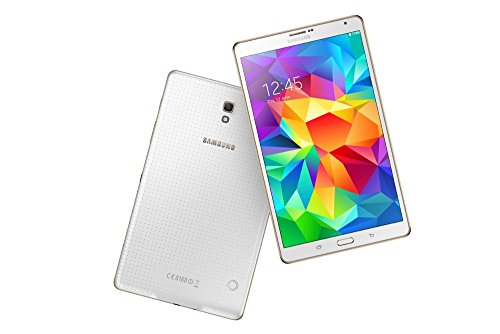
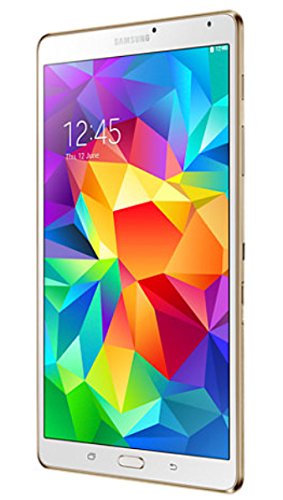
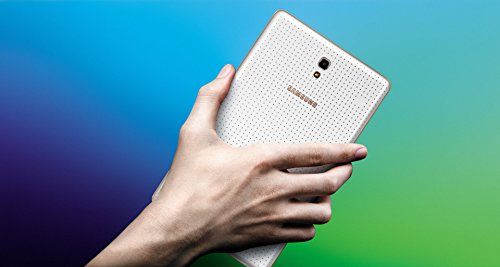
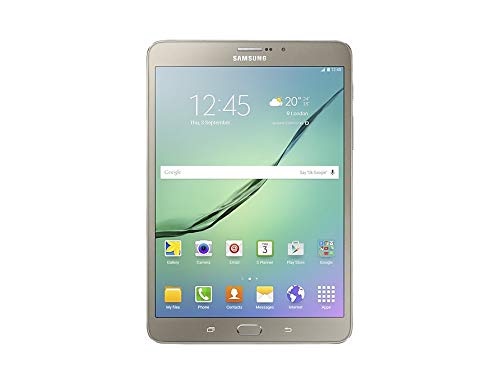
Samsung Galaxy Tab S 8 4 4G (3GB + 16GB) Review | 168 Data compared

Avg. price:~£440RAM capacity:3 GBInternal storage:16 GBScreen size:8.4 inchesChipset:Exynos 5

Samsung Galaxy Tab S 8 4 4G (3GB + 16GB) Review: Compare 168 technical specifications and user reviews to see how this product ranks in the Tablets category and whether it is worth buying.
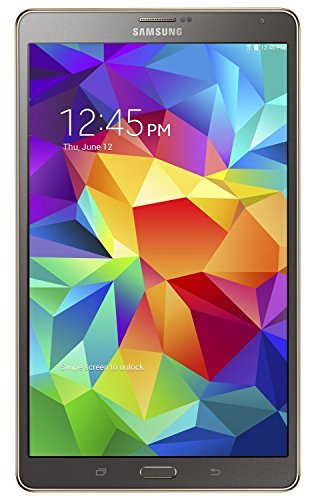
Samsung Galaxy Tab S 8 4 4G (3GB + 16GB)
6.0/10

Overall score

Score
6.0/ 10
✕
What it is
An overall evaluation of the smartphone's quality, based on technical analyses and user reviews.
When it matters
When you need a quick reference to identify the best Tablets on the market.
Score distribution
â–¼
<55-66-77-88-99-10
Score components

90%

5.9

Technical score

10%

7.2

User score

â–¼Worse than 57% of tablets
6.7

Value for money

Value for money
6.7/ 10
✕
What it is
An indicator that combines the smartphone's overall rating with its cost.
When it matters
When you are looking for a smartphone with a good balance between quality and price.
Score distribution
â–¼
<55-66-77-88-99-10
Score components

70%

6.0

Overall score

30%

8.2

Price

â–¼Worse than 67%
5.9

Technical score

Technical score
5.9/ 10
✕
What it is
An assessment of the smartphone's technical performance, covering eight key areas: performance & hardware, software, camera, connectivity, display, battery, audio, and design.
When it matters
When you want to compare Tablets based on technical performance and available features.
Score distribution
â–¼
<55-66-77-88-99-10
Score components

22%

5.8

Performance

20%

6.5

Display

16%

6.5

Camera

14%

3.2

Battery

12%

6.6

Connectivity

8%

6.5

Software & Features

5%

6.8

Design

3%

5.7

Audio & Multimedia

â–¼Worse than 56%
7.2

User score

User score
7.2/ 10
✕
What it is
A rating that combines user reviews and the total number of reviews received by the smartphone
When it matters
When you want to know how a smartphone handles daily tasks and how reliable it remains over time according to user feedback.
Score distribution
â–¼
<55-66-77-88-99-10
Score components

70%

7.8

User ratings

30%

5.6

Number of reviews

Based on ratings from across the web.
â–¼Worse than 82%
  • samsung-galaxy-tab-s-8-4-3gb-16gb-4g
  • samsung-galaxy-tab-s-8-4-3gb-16gb-4g
  • samsung-galaxy-tab-s-8-4-3gb-16gb-4g
  • samsung-galaxy-tab-s-8-4-3gb-16gb-4g
  • samsung-galaxy-tab-s-8-4-3gb-16gb-4g
samsung-galaxy-tab-s-8-4-3gb-16gb-4g
Where to buy
*As an Amazon Associate, we earn from qualifying purchases.
Best rankings
Available: ranking among products currently available (including other versions of this product).All: ranking among all products in the database.
Available versions:
3GB + 16GB
Other versions:
Loading...
Loading category ranking...

Technical Specifications of tablet Samsung Galaxy Tab S 8 4 4G (3GB + 16GB)

Technical score
Technical score
5.9/ 10
✕
What it is
An assessment of the smartphone's technical performance, covering eight key areas: performance & hardware, software, camera, connectivity, display, battery, audio, and design.
When it matters
When you want to compare Tablets based on technical performance and available features.
Score distribution
â–¼
<55-66-77-88-99-10
Score components:

22%

5.8

Performance

20%

6.5

Display

16%

6.5

Camera

14%

3.2

Battery

12%

6.6

Connectivity

8%

6.5

Software & Features

5%

6.8

Design

3%

5.7

Audio & Multimedia

5.9
User score
User score
7.2/ 10
✕
What it is
A rating that combines user reviews and the total number of reviews received by the smartphone
When it matters
When you want to know how a smartphone handles daily tasks and how reliable it remains over time according to user feedback.
Score distribution
â–¼
<55-66-77-88-99-10
Score components

70%

7.8

User ratings

30%

5.6

Number of reviews

Based on ratings from across the web.
7.2
Popularity
Popularity
5.6/ 10
✕
What it is
An indicator based on the number of reviews received by the smartphone.
When it matters
When you prefer to purchase a product chosen and reviewed by many other consumers.
Score distribution
â–¼
<55-66-77-88-99-10
Popularity:
Samsung Galaxy Tab S 8 4 4G (3GB + 16GB) has a user popularity of 5.6 points, which is lower than 55.6% of Tablets.
5.6
Value for money
Value for money
6.7/ 10
✕
What it is
An indicator that combines the smartphone's overall rating with its cost.
When it matters
When you are looking for a smartphone with a good balance between quality and price.
Score distribution
â–¼
<55-66-77-88-99-10
Score components:

70%

6.0

Overall score

30%

8.2

Price

6.7
RAM capacity
3 GB
This tablet has a RAM capacity of 3 GB which is smaller than the RAM capacity of 52.4% of tablets and equal to that of 8.5% of tablets.
Process node
28 nm
This tablet is built on a 28 nm process node, which is larger than the node size used in 64.7% of tablets and equal to the node used in 17.8% of tablets.
Internal storage
16 GB
This tablet has an internal storage capacity of 16 GB which is smaller than the storage of 78.5% of tablets and equal to that of 15% of tablets.
Geekbench 6 single-core benchmark score
?
Chipset
Exynos 5
This tablet uses the Exynos 5 chipset, which is more advanced than the chipsets in 55.9% of tablets and equal to those in 0.1% of tablets.
Show more
Screen resolution
2560×1600
This tablet has a screen resolution of 2560×1600 which is higher than that of 77.6% of tablets and equal to that of 10.1% of tablets.
Refresh rate
60 Hz
This tablet supports a refresh rate of 60 Hz which is equal to that in 73.8% of tablets.
Display type
OLED/AMOLED
This tablet uses a OLED/AMOLED display type. 92.5% of tablets use this display technology.
Pixel density
359 ppi
This tablet has a pixel density of 359 ppi which is higher than that of 98.5% of tablets and equal to that of 1% of tablets.
Display glass type
Corning Gorilla Glass 3
This tablet uses Corning Gorilla Glass 3 display glass which is stronger than that on 80.1% of tablets and equal to that on 11.2% of tablets.
Show more
Optical image stabilization
no
This tablet does not support optical image stabilization. 0.4% of tablets include OIS.
Main camera megapixels
8 MP
This tablet has a main camera resolution of 8 MP which is higher than that of 36.5% of tablets and equal to that of 31.8% of tablets.
Front camera megapixels
2.1 MP
This tablet has a front camera resolution of 2.1 MP which is lower than in 52.4% of tablets and equal to that in 1.2% of tablets.
Main camera aperture
f/2.4
This tablet has a main camera aperture of f/2.4 which is narrower than that of 69.8% of tablets and equal to that of 17.6% of tablets.
Optical zoom
N/A
Show more
Battery capacity
4,900 mAh
This tablet has a battery capacity of 4,900 mAh which is smaller than the batteries in 72.3% of tablets and equal to those in 0.4% of tablets.
Charging speed
10 W
This tablet supports charging speeds of 10 W which is slower than in 61% of tablets and equal to speeds in 33.2% of tablets.
Battery life
8 hours
This tablet has a battery life of 8 hours, which is shorter than that of 72.2% of tablets and equal to that of 11.9% of tablets.
Wireless charging
no
This tablet does not support wireless charging. 1.5% of tablets support wireless charging.
Fast charging
no
This tablet does not support fast charging. 49.7% of tablets support fast charging.
Show more
LTE support
yes
This tablet supports LTE. 36.8% of tablets include LTE connectivity.
Wi-Fi connectivity
yes
This tablet supports Wi-Fi connectivity. 0.2% of tablets offer Wi-Fi support.
GPS
yes
This tablet supports GPS. 17.3% of tablets include GPS functionality.
5G connectivity
no
This tablet does not support 5G connectivity. 11.1% of tablets support 5G.
NFC
no
This tablet does not support NFC. 10.9% of tablets support NFC.
Show more
Operating system
Android
This tablet uses the Android operating system, which is more advanced than the one used by 23.3%.
Update support duration
short
This tablet offers short update support, which is shorter than the support period of 52.7% of tablets and equal to that of 47.3% of tablets.
Direct OS updates
?
On-device AI
no
This tablet does not support on-device AI. 28.3% of tablets support this capability.
App tracking protection
no
This tablet does not include app tracking protection. 28.3% of tablets include app tracking protection.
Show more
IP rating
not rated
This tablet has an IP rating of not rated which is lower than that of 16.3% of tablets and equal to that of 83.7% of tablets.
Weight
298 g
This tablet weighs 298 g which is lighter than 94.7% of tablets.
Backlit keyboard
no
This tablet does not support a backlit keyboard. 9.8% of tablets support backlit keyboards.
Keyboard accessory
yes
This tablet supports a keyboard accessory. 15.8% of tablets support this option.
Pen latency
N/A
Show more
Number of microphones
2
This tablet includes 2 microphones, which is more than in 55.1% of tablets and equal to the number in 32.7% of tablets.
aptX Adaptive
no
This tablet does not support aptX Adaptive. 6.9% of tablets offer this codec.
Dolby Atmos support
no
This tablet does not support Dolby Atmos. 31.5% of tablets support Dolby Atmos.
N. of speakers
2
This tablet includes 2 speakers, which is more than in 9.8% of tablets and equal to the number in 60.9% of tablets.
FM radio
no
This tablet does not include an FM radio. 19% of tablets offer FM radio functionality.
Show more

Samsung Galaxy Tab S 8 4 4G (3GB + 16GB) vs the average tablet

246810TotalPerformanceDisplayCameraBatteryConnectivitySoftware & FeaturesDesignAudio & Multimedia
  • Better display type
    This tablet features a better display type than the average tablet (OLED/AMOLED vs IPS LCD). The average tablet uses IPS LCD display technology.
    OLED/AMOLED vs IPS LCD
  • Wider color gamut
    This tablet supports a wider color gamut than the average tablet (Adobe RGB vs sRGB). The average tablet covers sRGB color gamut.
    709% Adobe RGB coverage reported.
    Adobe RGB vs sRGB
  • 60.3% higher pixel density
    This tablet has a higher pixel density than the average tablet (359 ppi vs 224 ppi). The average tablet has pixel density of 224 ppi.
    359 ppi vs 224 ppi
  • More capable chipset
    This tablet uses the Exynos 5 chipset, while the average tablet uses MediaTek MT8169A.
    Exynos 5 vs MediaTek MT8169A
  • Higher contrast ratio
    This tablet has a higher contrast ratio than the average tablet (100000:1 vs 1015:1). The average tablet contrast ratio is 1015:1.
    100,000:1 vs 1,015:1
  • Higher screen resolution
    This tablet has a higher screen resolution than the average tablet (2560×1600 vs 1920×1200). The average tablet resolution is 1920×1200.
    2560×1600 vs 1920×1200
  • 145 nits higher peak brightness
    This tablet has a higher peak brightness than the average tablet (546 nits vs 401 nits). The average tablet reaches 401 nits peak brightness.
    546 nits vs 401 nits
  • 39.2% lighter
    This tablet is lighter than the average tablet (298 g vs 490 g). The average tablet weighs 490 g.
    298 g vs 490 g
  • More capable chipset
    This tablet uses the Exynos 5 chipset, while the average tablet uses MediaTek MT8169A.
    Exynos 5 vs MediaTek MT8169A
  • 15% higher CPU speed
    This tablet has a higher CPU speed than the average tablet (2.3 GHz vs 2 GHz). The average tablet has CPU speed of 2 GHz.
    2.3 GHz vs 2 GHz
  • 2 more CPU threads
    This tablet has more CPU threads than the average tablet (8 vs 6). The average tablet has 6 CPU threads.
    8 vs 6
  • Better display type
    This tablet features a better display type than the average tablet (OLED/AMOLED vs IPS LCD). The average tablet uses IPS LCD display technology.
    OLED/AMOLED vs IPS LCD
  • Wider color gamut
    This tablet supports a wider color gamut than the average tablet (Adobe RGB vs sRGB). The average tablet covers sRGB color gamut.
    709% Adobe RGB coverage reported.
    Adobe RGB vs sRGB
  • 60.3% higher pixel density
    This tablet has a higher pixel density than the average tablet (359 ppi vs 224 ppi). The average tablet has pixel density of 224 ppi.
    359 ppi vs 224 ppi
  • Higher contrast ratio
    This tablet has a higher contrast ratio than the average tablet (100000:1 vs 1015:1). The average tablet contrast ratio is 1015:1.
    100,000:1 vs 1,015:1
  • Higher screen resolution
    This tablet has a higher screen resolution than the average tablet (2560×1600 vs 1920×1200). The average tablet resolution is 1920×1200.
    2560×1600 vs 1920×1200
  • 145 nits higher peak brightness
    This tablet has a higher peak brightness than the average tablet (546 nits vs 401 nits). The average tablet reaches 401 nits peak brightness.
    546 nits vs 401 nits
  • Includes anti-reflection coating
    This tablet has anti-reflection coating, the average tablet does not. 24.7% of tablets use anti-reflection coating.
  • 138 ppi higher screen sharpness
    This tablet has a higher screen sharpness than the average tablet (359 ppi vs 221 ppi). The average tablet has screen sharpness of 221 ppi.
    359 ppi vs 221 ppi
  • More durable display glass
    This tablet uses better display glass than the average tablet (Corning Gorilla Glass 3 vs Corning Gorilla Glass). Display glass choice still varies across tablets.
    Corning Gorilla Glass 3 vs Corning Gorilla Glass
  • Allows manual ISO
    This tablet allows manual ISO adjustment, the average tablet does not. 46% of tablets feature manual ISO.
  • Supports slow-motion recording
    This tablet supports slow-motion recording, the average tablet does not. 37.5% of tablets offer slow-mo.
  • Includes flash
    This tablet features a built-in flash, the average tablet does not. 45.2% of tablets include a flash.
  • Includes fingerprint scanner
    This tablet offers a better fingerprint scanner setup than the average tablet (yes vs no). Fingerprint scanner quality still varies a lot between tablets.
    Fingerprint scanner in the home button.
  • 39.2% lighter
    This tablet is lighter than the average tablet (298 g vs 490 g). The average tablet weighs 490 g.
    298 g vs 490 g
  • 1.4 mm thinner
    This tablet is thinner than the average tablet (6.6 mm vs 8 mm). The average tablet is 8.0 mm thick.
    6.6 mm vs 8.0 mm
  • 49.7 mm narrower
    This tablet is narrower than the average tablet (125.6 mm vs 175.3 mm). The average tablet is 175.3 mm wide.
    125.6 mm vs 175.3 mm
  • 1 more microphone/s
    This tablet has more microphones than the average tablet (2 vs 1). The average tablet has 1 microphones.
    2 vs 1
  • No USB Type-C
    This tablet lacks a USB Type-C port, the average tablet includes one. 53.4% of tablets use USB Type-C.
  • Shorter update support
    This tablet offers shorter update support than the average tablet (short vs medium). The average tablet gets medium of update support.
    short vs medium
  • 394 nits lower typical brightness
    This tablet has a lower typical brightness than the average tablet (6 nits vs 400 nits). The average tablet reaches 400 nits typical brightness.
    6 nits vs 400 nits
  • Worse GPU
    This tablet uses the Mali-T628 MP6 GPU, while the average tablet uses the stronger Mali-G51. GPU choice is one of the main performance differences between tablets.
    Mali-T628 MP6 vs Mali-G51
  • 2 hours shorter battery life
    This tablet offers shorter battery life than the average tablet (8 hours vs 10 hours). The average tablet offers 10 hours of battery life.
    8 hours vs 10 hours
  • No picture-in-picture mode
    This tablet does not support picture-in-picture, the average tablet does. 61% of tablets support picture-in-picture.
  • Older Bluetooth version
    This tablet uses an older Bluetooth version than the average tablet (4 vs 5). The average tablet uses Bluetooth 5.0.
    4.0 vs 5.0
  • 25.5% smaller battery capacity
    This tablet has a lower battery capacity than the average tablet (4,900 mAh vs 6,580 mAh). The average tablet battery has capacity of 6,580 mAh.
    4,900 mAh vs 6,580 mAh
  • 11.9% lower user score
    User score
    7.2/ 10
    ✕
    What it is
    A rating that combines user reviews and the total number of reviews received by the smartphone
    When it matters
    When you want to know how a smartphone handles daily tasks and how reliable it remains over time according to user feedback.
    Score distribution
    ▼▼
    <55-66-77-88-99-10
    Samsung Galaxy Tab S 8 4 4G
    the average tablet
    Samsung Galaxy Tab S 8 4 4G (3GB + 16GB) has a lower user score than the average tablet (7.15 vs 8.000).
    7.15 vs 8
  • 69.2% more expensive
    Samsung Galaxy Tab S 8 4 4G (3GB + 16GB) is more expensive than the average tablet (£440 vs £260).
    £440 vs £260
  • 6.3% worse value for money
    Samsung Galaxy Tab S 8 4 4G (3GB + 16GB) has worse value for money than the average tablet (6.68 vs 7.1).
    6.68 vs 7.1
  • Worse GPU
    This tablet uses the Mali-T628 MP6 GPU, while the average tablet uses the stronger Mali-G51. GPU choice is one of the main performance differences between tablets.
    Mali-T628 MP6 vs Mali-G51
  • 75% less storage
    This tablet has less internal storage than the average tablet (16 GB vs 64 GB). The average tablet provides 64 GB of internal storage.
    16 GB vs 64 GB
  • 2x larger process node
    This tablet uses a larger process node than the average tablet (28 nm vs 14 nm). The average tablet uses a process node of 14 nm.
    28 nm vs 14 nm
  • 1 GB less RAM
    This tablet has less RAM capacity than the average tablet (3 GB vs 4 GB). The average tablet has 4 GB of RAM.
    3 GB vs 4 GB
  • 14.1% lower memory bandwidth
    This tablet has a lower memory bandwidth than the average tablet (12.8 GB/s vs 14.9 GB/s). The average tablet has memory bandwidth of 14.9 GB/s.
    12.8 GB/s vs 14.9 GB/s
  • 394 nits lower typical brightness
    This tablet has a lower typical brightness than the average tablet (6 nits vs 400 nits). The average tablet reaches 400 nits typical brightness.
    6 nits vs 400 nits
  • 1.7 inches smaller screen size
    This tablet has a lower screen size than the average tablet (8.4 inches vs 10.1 inches). The average tablet has screen size of 10.1 inches.
    8.4 inches vs 10.1 inches
  • 50% lower touch sampling rate
    This tablet has a lower touch sampling rate than the average tablet (60 Hz vs 120 Hz). The average tablet has touch sampling rate of 120 Hz.
    60 Hz vs 120 Hz
  • 2.9 MP lower front camera megapixels
    This tablet has less front camera megapixels than the average tablet (2.1 MP vs 5 MP). The average tablet has 5 MP front camera resolution.
    2.1 MP vs 5 MP
  • No burst mode
    This tablet does not support burst mode, the average tablet does. 60.5% of tablets support burst mode.
  • No BSI sensor
    This tablet lacks a BSI sensor, the average tablet has one. 52.6% of tablets use BSI sensors for better low-light shots.
  • Narrower main camera aperture
    This tablet has a worse main camera aperture than the average tablet (f/2.4 vs f/2.2). The average tablet uses f/2.2 main camera aperture.
    f/2.4 vs f/2.2
  • 2 hours shorter battery life
    This tablet offers shorter battery life than the average tablet (8 hours vs 10 hours). The average tablet offers 10 hours of battery life.
    8 hours vs 10 hours
  • 25.5% smaller battery capacity
    This tablet has a lower battery capacity than the average tablet (4,900 mAh vs 6,580 mAh). The average tablet battery has capacity of 6,580 mAh.
    4,900 mAh vs 6,580 mAh
  • 44.4% slower charging speed
    This tablet supports slower charging than the average tablet (10 W vs 18 W). The average tablet supports charging speed of 18 W.
    10 W vs 18 W
  • No USB Type-C
    This tablet lacks a USB Type-C port, the average tablet includes one. 53.4% of tablets use USB Type-C.
  • Older Bluetooth version
    This tablet uses an older Bluetooth version than the average tablet (4 vs 5). The average tablet uses Bluetooth 5.0.
    4.0 vs 5.0
  • No face recognition
    This tablet does not have face recognition, the average tablet does. 56% of tablets support face recognition.
  • Shorter update support
    This tablet offers shorter update support than the average tablet (short vs medium). The average tablet gets medium of update support.
    short vs medium
  • No picture-in-picture mode
    This tablet does not support picture-in-picture, the average tablet does. 61% of tablets support picture-in-picture.
  • No camera/mic privacy toggles
    This tablet lacks camera and microphone privacy toggles, the average tablet includes them. 56.2% of tablets offer these toggles.
  • No full-page screenshots
    This tablet does not support full-page screenshots, the average tablet does. 52.5% of tablets support full-page screenshots.
  • No location privacy controls
    This tablet does not offer location privacy controls, the average tablet does. 76.5% of tablets include location privacy features.
  • No dark mode
    This tablet does not support dark mode, the average tablet does. 57.2% of tablets have dark mode.
  • 5 older release date
    This tablet is an older model than the average tablet (2014 vs 2019).
    July 2014
    2014 vs 2019

Video reviews

Hands-on testing, unboxing, and real-world video evaluations

Not graded yet
Not graded yet
Not graded yet
Not graded yet
Not graded yet
Not graded yet
Not graded yet
Not graded yet
Not graded yet
Not graded yet
Not graded yet
Not graded yet

Third-party reviews

Based on ratings from across the web.
Reviews last updated: November 2026 · How we calculate this

What customers like about Samsung Galaxy Tab S 8 4 4G (3GB + 16GB)

  • Stunning Super AMOLED display with 2560x1600 resolution and deep blacks
  • Incredibly thin (6.6mm) and lightweight (298g) design, making it highly portable
  • Vibrant, high-density screen (359 ppi) that excels for media consumption and movies
  • Expandable storage via a microSD card slot supporting up to 128GB
  • Useful multitasking features like Multi Window mode for side-by-side apps

What customers don't like about Samsung Galaxy Tab S 8 4 4G (3GB + 16GB)

  • Heavy 'TouchWiz' software skin and excessive pre-loaded bloatware
  • Inconsistent battery life, with some users reporting significant standby drain
  • Fingerprint scanner is often described as unreliable and frustrating to use
  • Occasional performance lag and stuttering despite high-end internal specs
  • Plastic build material feels less premium compared to competitors like the iPad Mini
  • Slow charging times via the micro-USB port

Verdict

The Samsung Galaxy Tab S 8.4 4G (SM-T705) is a high-end compact tablet featuring a stunning 8.4-inch Super AMOLED display with a 2560 x 1600 resolution and 359 ppi. It is powered by an Exynos 5 Octa 5420 processor paired with 3GB of RAM and 16GB of internal storage, expandable via microSD up to 128GB. Key characteristics include an ultra-slim 6.6mm profile, 4G LTE connectivity, a fingerprint scanner, and an 8MP rear camera with LED flash. Main pros are its industry-leading screen quality, lightweight 298g design, and solid battery life from the 4,900mAh cell. However, cons include a largely plastic build, occasional software lag during heavy multitasking, and a swipe-based fingerprint sensor that can be inconsistent.

Compare Samsung Galaxy Tab S 8 4 4G (3GB + 16GB) with other tablets

1Product to compare no. 1
VS
2Product to compare no. 2
VS
3Product to compare no. 3 (optional)

Graphic comparison of Samsung Galaxy Tab S 8 4 4G (3GB + 16GB) and other tablets

No results found