Scored using Tablets Methodology v3.0
Tablets Methodology v3.0
Mathematical & Unbiased Scoring
Products in this category are scored under Frontum Tablets Methodology v3.0: the technical score from the specifications is the base, and independent expert and video reviews (up to ±0.5 points), owner opinions (up to ±0.3) and best-of lists (up to +0.3) move it up or down.
Explore Tablets Methodology v3.0

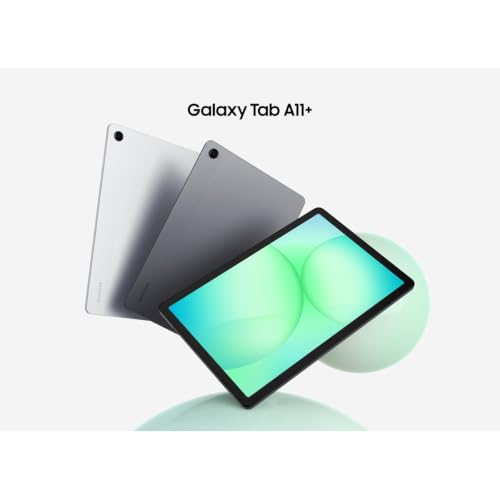
Samsung Galaxy Tab A11+ Enterprise Edition review: 168 specs compared

Avg. price:~£?RAM capacity:6 GBInternal storage:128 GBScreen size:11 inchesChipset:?

Samsung Galaxy Tab A11+ Enterprise Edition Review: Compare 168 technical specifications and 27 expert and video reviews to see how this product ranks in the Tablets category and whether it is worth buying.
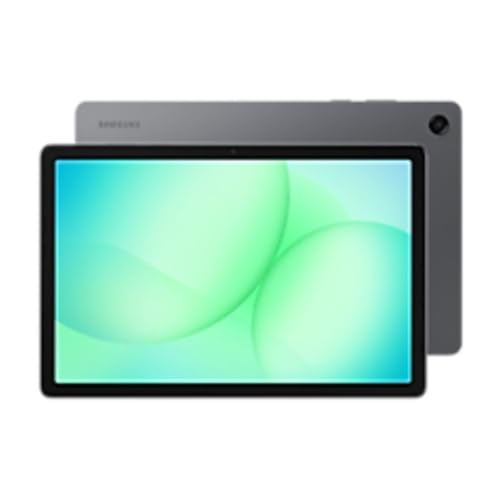
Samsung Galaxy Tab A11+ Enterprise Edition
7.6/10

Overall score

Score
7.6/ 10
✕
What it is
Our main score for this model, 1–10. It combines specs, best-of lists, expert reviews and owners.
How we count it
Parts: Technical score 35%, List score 30%, Reviews score 25%, Sentiment score 10%
Marks: Each part gets a mark out of 10. For reviews, lists and owners, a typical model in this category gets about 8 and the best one gets 10.
No data yet: A part with no data shows "?". It counts as the mark of a weaker model in this category (4 in 5 models with data score higher). This way, models with reviews, lists and owners usually come out ahead.
Score distribution
â–¼
<55-66-77-88-99-10
Score components

35%

7.3

Technical score

30%

?

List scoreNot enough data yet, so we use 7.5, the mark of a weaker model in this category

25%

8.3

Reviews score

10%

?

Sentiment scoreNot enough data yet, so we use 6.9, the mark of a weaker model in this category

â–²Better than 75% of tablets
?

Value for money

Value for money
✕
What it is
An indicator that combines the tablet's overall rating with its cost.
When it matters
When you are looking for a tablet with a good balance between quality and price.
Score distribution
â–¼
<55-66-77-88-99-10
Score components

70%

7.6

Overall score

30%

?

Price

Price not known yet
7.3

Technical score

Technical score
7.3/ 10
✕
What it is
How good the specs are compared with the other models in this category, 1–10.
How we count it
Areas: We rate the specs in each area against the other models in this category.
Weighting: The areas that matter most to buyers count more. The shares are shown under Score components.
Share: The technical score is 35% of the overall score.
Score distribution
â–¼
<55-66-77-88-99-10
Score components

22%

7.8

Performance

20%

6.2

Display

16%

7.1

Camera

14%

7.6

Battery

12%

7.1

Connectivity

8%

9.4

Software

5%

6.8

Design

3%

8.3

Audio

â–²Better than 75%
8.3

Reviews score

Reviews score
8.3/ 10
✕
What it is
Average grade from independent test sites, magazines and video reviewers, 1–10.
How we count it
Grades: Each review's own score is converted to 1–10; without one, we grade the review ourselves. Big test sites count more, short reviews half as much as full tests. A video review counts half.
Score: The average grade is 80% of the review mark; the number of reviews is the other 20% (1 review = 5, the typical number in this category = 8, the most-reviewed model = 10).
Enough data: With few reviews, the average grade is pulled toward the typical grade of this category. No reviews yet: 7.4 for now.
Share: Reviews count 25% of the overall score.
Score distribution
â–¼
<55-66-77-88-99-10

80%

8.2

Average grade

20%

8.7

Popularity

Grades by review (27)
27 video reviews, each counting half as much as a written test. Reviews count 25% of the overall score.
User ratings collected online are not part of this score.
â–²Better than 80%
?

List score

List score
7.5/ 10
✕
What it is
How often independent test sites, magazines and video reviewers put this model in their best-of lists for this category.
How we count it
Points: The model in the most lists of this category gets 10; the others get 8 to 10 in proportion. In no list yet: 7.5. Lists count 30% of the overall score.
Enough data: Every list counts, even a single one. With fewer than 5 best-of lists in the category, this part is left out.
Lists with this model (0)
Not in any best-of list yet, so this part counts as 7.5. Models in a list get 8 to 10.
Not in any best-of list yet

What reviewers say about the Samsung Galaxy Tab A11+ Enterprise Edition

Based on 0 · 32

Reviewers like the clean software and good audio, but the missing pen and accessories, weak cameras and divisive display disappoint.
Praised
Mixed views
Criticised
Pick a topic to see who said what
Loading...
Loading category ranking...

Tablets model ranking

Ranked #621 of 1,179 models in Tablets (Overall score)

Technical Specifications of tablet Samsung Galaxy Tab A11+ Enterprise Edition

Technical score
Technical score
7.3/ 10
✕
What it is
How good the specs are compared with the other models in this category, 1–10.
How we count it
Areas: We rate the specs in each area against the other models in this category.
Weighting: The areas that matter most to buyers count more. The shares are shown under Score components.
Share: The technical score is 35% of the overall score.
Score distribution
â–¼
<55-66-77-88-99-10
Score components:

22%

7.8

Performance

20%

6.2

Display

16%

7.1

Camera

14%

7.6

Battery

12%

7.1

Connectivity

8%

9.4

Software

5%

6.8

Design

3%

8.3

Audio

7.3
Reviews score
8.3
List score
?
Value for money
Value for money
8.3/ 10
✕
What it is
An indicator that combines the tablet's overall rating with its cost.
When it matters
When you are looking for a tablet with a good balance between quality and price.
Score distribution
â–¼
<55-66-77-88-99-10
Score components:

70%

7.6

Overall score

30%

?

Price

8.3
RAM capacity
6 GB
This tablet has 6 GB of RAM, which is more than 65% of tablets and equal to 7.1% of tablets.
Process node
?
Internal storage
128 GB
This tablet has 128 GB of internal storage, which is more than 56.2% of tablets and equal to 20% of tablets.
Geekbench 6 single-core score
?
Chipset
?
Show more
What reviewers say
Screen resolution
1920×1200
This tablet has a 1920×1200 screen, which is sharper than 39.1% of tablets and equal to 18.8% of tablets.
Refresh rate
90 Hz
This tablet has a 90 Hz screen, which is smoother than 73.5% of tablets and equal to 6.7% of tablets.
Display type
TFT LCD
This tablet uses a TFT LCD display type. 89.9% of tablets use this display technology.
Pixel density
206 ppi
This tablet has a pixel density of 206 ppi, which is lower than 60.7% of tablets and equal to 1.2% of tablets.
Display glass type
?
Show more
What reviewers say
Optical image stabilization
no
This tablet does not support optical stabilisation. 0.4% of tablets offer this.
Main camera megapixels
8 MP
This tablet has a rear camera with 8 MP resolution, which is higher than 36.4% of tablets and equal to 31.9% of tablets.
Front camera megapixels
5 MP
This tablet has a front camera with 5 MP resolution, which is higher than 48.6% of tablets and equal to 19.7% of tablets.
Main camera aperture
f/2.0
This tablet has a main camera aperture of f/2.0, which is wider than 57.4% of tablets and equal to 24.7% of tablets.
Optical zoom
1xxx
This tablet has 1xx optical zoom, which is stronger than 18.2% of tablets and equal to 80.9% of tablets.
Show more
What reviewers say
Battery capacity
7,040 mAh
This tablet has 7,040 mAh battery capacity, which is larger than 57.6% of tablets and equal to 2% of tablets.
Charging speed
?
Battery life
?
Wireless charging
no
This tablet does not support wireless charging. 1.5% of tablets offer this.
Fast charging
yes
This tablet supports fast charging. 43.2% of tablets offer this.
Show more
What reviewers say
LTE support
?
Wi-Fi connectivity
yes
This tablet connects to Wi-Fi. 0.2% of tablets offer this.
GPS
yes
This tablet has built-in GPS. 17.1% of tablets offer this.
5G connectivity
no
This tablet does not support 5G. 8.1% of tablets offer this.
NFC
no
This tablet does not include NFC. 10.8% of tablets offer this.
Show more
What reviewers say
Operating system
?
Update support duration
long
This tablet offers long update support, which is longer than the support period of 80% of tablets and equal to that of 20% of tablets.
Direct OS updates
yes
This tablet supports direct OS updates. 20.3% of tablets offer this.
On-device AI
?
App tracking protection
no
This tablet does not support app tracking protection. 28.4% of tablets offer this.
Show more
What reviewers say
IP rating
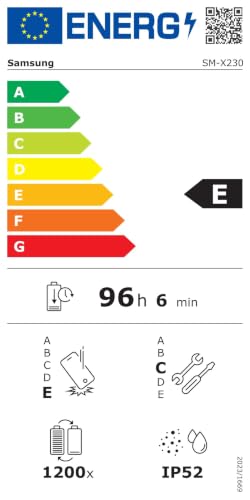
IP52
This tablet's IP rating is IP52, which is more protected than 84.8% of tablets and the same as 6.2% of tablets.
Weight
?
Backlit keyboard
no
This tablet does not support a backlit keyboard. 9.7% of tablets support backlit keyboards.
Keyboard accessory
yes
This tablet supports a keyboard accessory. 15.8% of tablets support this option.
Pen latency
N/A
Show more
What reviewers say
Number of microphones
?
aptX Adaptive
no
This tablet does not support aptX Adaptive. 6.9% of tablets offer this.
Dolby Atmos support
yes
This tablet supports Dolby Atmos. 68.7% of tablets support Dolby Atmos.
N. of speakers
?
FM radio
no
This tablet does not include an FM radio. 19% of tablets offer this.
Show more
What reviewers say

Samsung Galaxy Tab A11+ Enterprise Edition vs the average tablet

246810TotalPerformanceDisplayCameraBatteryConnectivitySoftwareDesignAudio
  • 50% faster refresh rate
    This tablet has a faster refresh rate than the average tablet (90 Hz vs 60 Hz). The average tablet has a 60 Hz refresh rate.
    90 Hz vs 60 Hz
  • Longer update support
    This tablet offers longer update support than the average tablet (long vs medium). The average tablet gets medium of update support.
    long vs medium
  • More dust and water protection
    This tablet offers better dust and water protection than the average tablet (IP52 vs not rated).
    IP52 vs not rated
  • 0.9 inches larger screen
    This tablet has a larger screen than the average tablet (11 inches vs 10.1 inches). The average tablet measures 10.1 inches.
    11 inches vs 10.1 inches
  • Supports manual ISO
    This tablet supports manual ISO, while the average tablet does not. 45.9% of tablets support manual ISO.
  • 18.6% higher review score
    Reviews score
    8.3/ 10
    ✕
    What it is
    Average grade from independent test sites, magazines and video reviewers, 1–10.
    How we count it
    Grades: Each review's own score is converted to 1–10; without one, we grade the review ourselves. Big test sites count more, short reviews half as much as full tests. A video review counts half.
    Score: The average grade is 80% of the review mark; the number of reviews is the other 20% (1 review = 5, the typical number in this category = 8, the most-reviewed model = 10).
    Enough data: With few reviews, the average grade is pulled toward the typical grade of this category. No reviews yet: 7.4 for now.
    Share: Reviews count 25% of the overall score.
    Score distribution
    â–¼
    <55-66-77-88-99-10

    80%

    8.2

    Average grade

    20%

    8.7

    Popularity

    Grades by review (27)
    27 video reviews, each counting half as much as a written test. Reviews count 25% of the overall score.
    User ratings collected online are not part of this score.
    8.3 vs 7.0
  • Supports Dolby Atmos
    This tablet supports Dolby Atmos, the average tablet does not. 31.3% of tablets support Dolby Atmos.
  • More advanced memory type
    This tablet uses more advanced memory than the average tablet (LPDDR4X vs LPDDR3).
    LPDDR4X vs LPDDR3
  • 18.6% higher review score
    Reviews score
    8.3/ 10
    ✕
    What it is
    Average grade from independent test sites, magazines and video reviewers, 1–10.
    How we count it
    Grades: Each review's own score is converted to 1–10; without one, we grade the review ourselves. Big test sites count more, short reviews half as much as full tests. A video review counts half.
    Score: The average grade is 80% of the review mark; the number of reviews is the other 20% (1 review = 5, the typical number in this category = 8, the most-reviewed model = 10).
    Enough data: With few reviews, the average grade is pulled toward the typical grade of this category. No reviews yet: 7.4 for now.
    Share: Reviews count 25% of the overall score.
    Score distribution
    â–¼
    <55-66-77-88-99-10

    80%

    8.2

    Average grade

    20%

    8.7

    Popularity

    Grades by review (27)
    27 video reviews, each counting half as much as a written test. Reviews count 25% of the overall score.
    User ratings collected online are not part of this score.
    8.3 vs 7.0
  • 9.9% better value for money
    Samsung Galaxy Tab A11+ Enterprise Edition has better value for money than the average tablet (8.3 vs 7.6).
    8.3 vs 7.55
  • More advanced memory type
    This tablet uses more advanced memory than the average tablet (LPDDR4X vs LPDDR3).
    LPDDR4X vs LPDDR3
  • 2 GB more RAM
    This tablet has more RAM than the average tablet (6 GB vs 4 GB). The average tablet has 4 GB of RAM.
    6 GB vs 4 GB
  • 2x more internal storage
    This tablet has more internal storage than the average tablet (128 GB vs 64 GB). The average tablet has 64 GB of internal storage.
    128 GB vs 64 GB
  • 6 years newer
    This tablet was released more recently than the average tablet (2025 vs 2019). The average tablet was released in 2019.
    2,025 vs 2,019
  • 50% faster refresh rate
    This tablet has a faster refresh rate than the average tablet (90 Hz vs 60 Hz). The average tablet has a 60 Hz refresh rate.
    90 Hz vs 60 Hz
  • 0.9 inches larger screen
    This tablet has a larger screen than the average tablet (11 inches vs 10.1 inches). The average tablet measures 10.1 inches.
    11 inches vs 10.1 inches
  • Supports manual ISO
    This tablet supports manual ISO, while the average tablet does not. 45.9% of tablets support manual ISO.
  • Wider main camera aperture
    This tablet has a wider main camera aperture than the average tablet (f/2 vs f/2.2). The average tablet's main camera aperture is f/2.2.
    f/2.0 vs f/2.2
  • 6.7% larger battery capacity
    This tablet has a larger battery capacity than the average tablet (7,040 mAh vs 6,600 mAh). The average tablet offers 6,600 mAh of battery capacity.
    7,040 mAh vs 6,600 mAh
  • Newer Bluetooth version
    This tablet has a newer Bluetooth version than the average tablet (5.3 vs 5).
    5.3 vs 5.0
  • Longer update support
    This tablet offers longer update support than the average tablet (long vs medium). The average tablet gets medium of update support.
    long vs medium
  • Supports live text recognition
    This tablet supports live text recognition, while the average tablet does not. 35.1% of tablets offer this.
  • Supports app offloading
    This tablet supports app offloading, while the average tablet does not. 26.3% of tablets offer this.
  • Supports dynamic themes
    This tablet supports dynamic themes, while the average tablet does not. 29.5% of tablets offer this.
  • Supports extra dim mode
    This tablet supports extra dim mode, while the average tablet does not. 35.9% of tablets offer this.
  • Includes clipboard warnings
    This tablet has clipboard warnings, the average tablet does not. 40.3% of tablets include clipboard warnings.
  • More dust and water protection
    This tablet offers better dust and water protection than the average tablet (IP52 vs not rated).
    IP52 vs not rated
  • Supports Dolby Atmos
    This tablet supports Dolby Atmos, the average tablet does not. 31.3% of tablets support Dolby Atmos.
  • Supports LDAC
    This tablet supports LDAC, the average tablet does not. 25.3% of tablets support LDAC.
  • Inferior display type
    This tablet has an inferior display type compared to the average tablet (TFT LCD vs IPS LCD). 0.00% of tablets use the superior display type.
    TFT LCD vs IPS LCD
  • 6.8% softer screen detail
    This tablet has softer screen detail than the average tablet (206 ppi vs 221 ppi). The average tablet has a pixel density of 221 ppi.
    206 ppi vs 221 ppi
  • 2 fewer GPU execution units
    This tablet has less GPU execution units than the average tablet (2 vs 4). The average tablet has 4 GPU execution units.
    2 vs 4
  • 2 fewer GPU execution units
    This tablet has less GPU execution units than the average tablet (2 vs 4). The average tablet has 4 GPU execution units.
    2 vs 4
  • Inferior display type
    This tablet has an inferior display type compared to the average tablet (TFT LCD vs IPS LCD). 0.00% of tablets use the superior display type.
    TFT LCD vs IPS LCD
  • 6.8% softer screen detail
    This tablet has softer screen detail than the average tablet (206 ppi vs 221 ppi). The average tablet has a pixel density of 221 ppi.
    206 ppi vs 221 ppi

Video reviews

Hands-on testing, unboxing, and real-world video evaluations
9.0
The Ian West Network
≈ estimated
14/10/2026
Long-term review · a couple months of use
Verdict
Samsung Galaxy Tab A11+ Enterprise Edition is not a bad tablet at all, good for everyday use, though the cameras and gaming let it down.
9.0
Ankur Gulati
≈ estimated
18/08/2026
Long-term review · about seven months of daily use
Verdict
Samsung Galaxy Tab A11+ Enterprise Edition is a strong secondary or family tablet in its price range, thanks to polished software and multitasking.
9.0
TechToko
≈ estimated
07/08/2026
Long-term review · 8 months of daily use
Verdict
Samsung Galaxy Tab A11+ Enterprise Edition is not perfect, but it is a reliable daily tablet that satisfies buyers who don't expect top performance.
7.0
Cyber Technician
≈ estimated
20/07/2026
Hands-on review · multitasking, DeX and phone-use tests
Verdict
Samsung Galaxy Tab A11+ Enterprise Edition handles many device jobs well, but other tablets at this price may offer more value.
6.0
Chilled Fossil
≈ estimated
26/06/2026
Long-term review · six months of use
Verdict
Samsung Galaxy Tab A11+ Enterprise Edition is a simple, single-purpose tablet that is fine for media and light use, but not for productivity or students.
9.0
Shane Symonds
≈ estimated
15/06/2026
Hands-on review · months of daily use, battery and speaker tests
Verdict
Samsung Galaxy Tab A11+ Enterprise Edition is a solid all-round tablet for buyers who don't want to spend much.
9.0
Android Digest
≈ estimated
24/05/2026
Long-term review · six months of daily use
Verdict
Samsung Galaxy Tab A11+ Enterprise Edition is a solid budget choice for most buyers, though not for stylus or bright-screen needs.
7.0
Chilled Fossil
≈ estimated
09/03/2026
Long-term review · one month of use, gaming and DeX tests
Verdict
Samsung Galaxy Tab A11+ Enterprise Edition is fine for light student use, but a Xiaomi tablet with S Pen support is the stronger pick.
9.0
Digital Feeds
≈ estimated
28/02/2026
Hands-on review · unboxing, gaming, DeX and battery tests
Verdict
Samsung Galaxy Tab A11+ Enterprise Edition is a fantastic budget tablet for media, study and light gaming, with long update support.
6.0
My Next Tablet
≈ estimated
26/01/2026
Hands-on review · two weeks of testing, display, battery, ports
Verdict
Samsung Galaxy Tab A11+ Enterprise Edition is a mixed pick: long battery life and gaming are strong, but the display and missing keyboard hold it back.
9.0
Android Digest
≈ estimated
17/01/2026
Full review · two weeks of use
Verdict
Samsung Galaxy Tab A11+ Enterprise Edition is a very good budget tablet and definitely worth buying, with limits for demanding games and heavy productivity.
9.0
Blunty
≈ estimated
03/01/2026
Hands-on review · one month of use and multitasking tests
Verdict
Samsung Galaxy Tab A11+ Enterprise Edition is a reliable, snappy all-rounder with long software support and well-balanced value for money.
More graded video reviews (9)
creator’s own scoreestimated by us

Third-party reviews

What customers like about Samsung Galaxy Tab A11+ Enterprise Edition

  • The 7040 mAh battery covers long days away from a charger.
  • The 11-inch screen is a comfortable size for reading and video.
  • Storage can be expanded by up to 2048 GB.
  • The 90 Hz screen keeps scrolling smooth.
  • Split-screen mode lets you run two apps side by side.
  • LDAC audio works with wireless headphones that support it.

What customers don't like about Samsung Galaxy Tab A11+ Enterprise Edition

  • Colors follow the standard sRGB range, so photos look less vivid.
  • Wi-Fi 5 is an older standard than the newest tablets use.
  • IP52 gives only light splash protection, so a dip in water is out.
  • There is no 5G, so it depends on Wi-Fi away from home.
  • The refresh rate does not adjust, so the screen stays at full speed on a still page.

Verdict

A 7040 mAh battery and an 11-inch screen make the Samsung Galaxy Tab A11+ Enterprise Edition a practical tablet for work at a desk or on the move. The 1920×1200 LCD is sharp enough for reading, video and spreadsheets, but its colors follow the standard sRGB range and the screen does not adjust its refresh rate. The 90 Hz screen keeps scrolling smooth, and 6 GB of memory with 128 GB of storage handles most daily work. Storage can be expanded by up to 2048 GB, so big photo and video libraries need not fit in the built-in memory. It is rated IP52, so dust and light splashes are no trouble, but it is not built for a dip. It suits a buyer who wants a tablet for video and reading, with room to add storage.

Compare Samsung Galaxy Tab A11+ Enterprise Edition with other tablets

1Product to compare no. 1
VS
2Product to compare no. 2
VS
3Product to compare no. 3 (optional)

Graphic comparison of Samsung Galaxy Tab A11+ Enterprise Edition and other tablets

No results found