Scored using Tablets Methodology v3.0
Tablets Methodology v3.0
Mathematical & Unbiased Scoring
Products in this category are scored under Frontum Tablets Methodology v3.0: the technical score from the specifications is the base, and independent expert and video reviews (up to ±0.5 points), owner opinions (up to ±0.3) and best-of lists (up to +0.3) move it up or down.
Explore Tablets Methodology v3.0

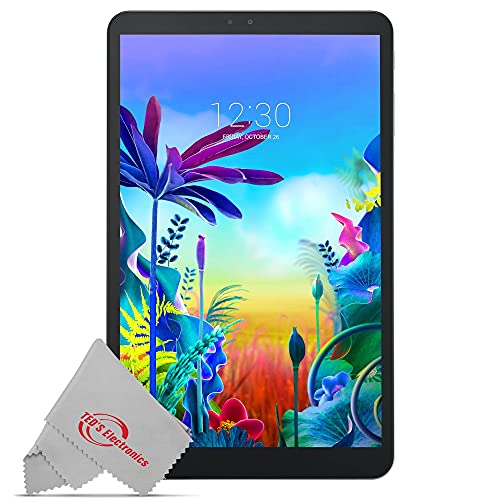
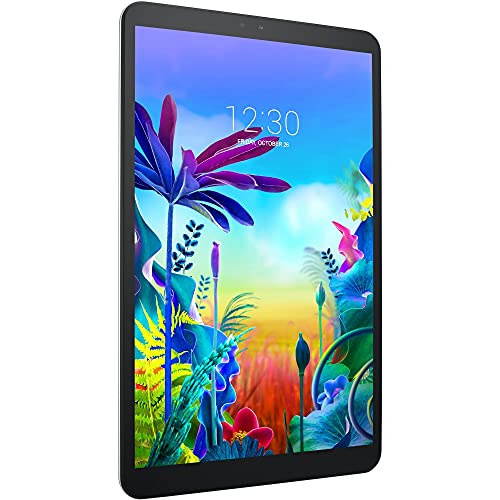
LG G Pad 5 10.1 4G (4GB + 32GB) review: 168 specs compared

Avg. price:~£300RAM capacity:4 GBInternal storage:32 GBScreen size:10.1 inchesChipset:Qualcomm Snapdragon 821

LG G Pad 5 10.1 4G (4GB + 32GB) Review: Compare 168 technical specifications and 6 expert and video reviews to see how this product ranks in the Tablets category and whether it is worth buying.
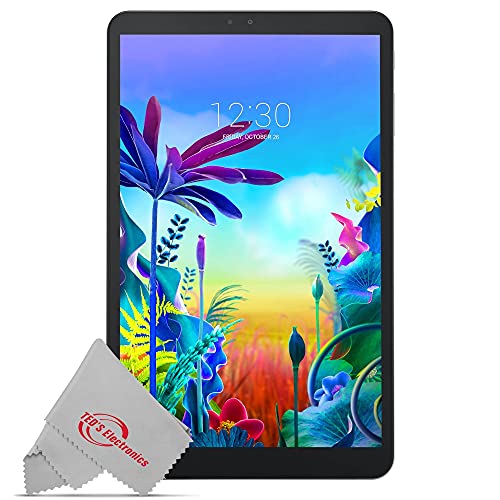
LG G Pad 5 10.1 4G (4GB + 32GB)
6.7/10

Overall score

Score
6.7/ 10
✕
What it is
Our main score for this model, 1–10. It combines specs, best-of lists, expert reviews and owners.
How we count it
Parts: Technical score 35%, List score 30%, Reviews score 25%, Sentiment score 10%
Marks: Each part gets a mark out of 10. For reviews, lists and owners, a typical model in this category gets about 8 and the best one gets 10.
No data yet: A part with no data shows "?". It counts as the mark of a weaker model in this category (4 in 5 models with data score higher). This way, models with reviews, lists and owners usually come out ahead.
Score distribution
â–¼
<55-66-77-88-99-10
Score components

35%

6.3

Technical score

30%

?

List scoreNot enough data yet, so we use 7.5, the mark of a weaker model in this category

25%

6.3

Reviews score

10%

6.3

Sentiment score

â–¼Worse than 62% of tablets
7.4

Value for money

Value for money
7.4/ 10
✕
What it is
An indicator that combines the tablet's overall rating with its cost.
When it matters
When you are looking for a tablet with a good balance between quality and price.
Score distribution
â–¼
<55-66-77-88-99-10
Score components

70%

6.7

Overall score

30%

8.9

Price

â–¼Worse than 62%
6.3

Technical score

Technical score
6.3/ 10
✕
What it is
How good the specs are compared with the other models in this category, 1–10.
How we count it
Areas: We rate the specs in each area against the other models in this category.
Weighting: The areas that matter most to buyers count more. The shares are shown under Score components.
Share: The technical score is 35% of the overall score.
Score distribution
â–¼
<55-66-77-88-99-10
Score components

22%

5.7

Performance

20%

5.8

Display

16%

6.4

Camera

14%

6.8

Battery

12%

7.7

Connectivity

8%

7.3

Software

5%

5.9

Design

3%

4.8

Audio

â–²Better than 56%
6.3

Reviews score

Reviews score
6.3/ 10
✕
What it is
Average grade from independent test sites, magazines and video reviewers, 1–10.
How we count it
Grades: Each review's own score is converted to 1–10; without one, we grade the review ourselves. Big test sites count more, short reviews half as much as full tests. A video review counts half.
Score: The average grade is 80% of the review mark; the number of reviews is the other 20% (1 review = 5, the typical number in this category = 8, the most-reviewed model = 10).
Enough data: With few reviews, the average grade is pulled toward the typical grade of this category. No reviews yet: 7.4 for now.
Share: Reviews count 25% of the overall score.
Score distribution
â–¼
<55-66-77-88-99-10

6.3

Mark 7.2 is below the typical mark 7.8 of this category, so it cannot lift the score above the technical score

80%

7.2

Average grade

20%

7.1

Popularity

Grades by review (6)
1 review, with a printed score. 5 video reviews, each counting half as much as a written test. Reviews count 25% of the overall score.
User ratings collected online are not part of this score.
â–¼Worse than 64%
?

List score

List score
7.5/ 10
✕
What it is
How often independent test sites, magazines and video reviewers put this model in their best-of lists for this category.
How we count it
Points: The model in the most lists of this category gets 10; the others get 8 to 10 in proportion. In no list yet: 7.5. Lists count 30% of the overall score.
Enough data: Every list counts, even a single one. With fewer than 5 best-of lists in the category, this part is left out.
Lists with this model (0)
Not in any best-of list yet, so this part counts as 7.5. Models in a list get 8 to 10.
Not in any best-of list yet
  • lg-g-pad-5-10-1-4gb-32gb-4g
  • lg-g-pad-5-10-1-4gb-32gb-4g
  • lg-g-pad-5-10-1-4gb-32gb-4g
lg-g-pad-5-10-1-4gb-32gb-4g
Where to buy
*As an Amazon Associate, we earn from qualifying purchases.

What reviewers say about the LG G Pad 5 10.1 4G (4GB + 32GB)

Based on 1 · 5

Reviewers like the battery and display, but complain about the weak camera, middling performance and limited storage.
Praised
Criticised
Pick a topic to see who said what

What owners say about the LG G Pad 5 10.1 4G (4GB + 32GB)

Based on 46 owners sharing their experience in online comments

30%positive11%mixed59%negative

Owners appreciate the affordable price and speed, but many struggle to get past Google account verification after a reset.

What owners dislike

  • Owners report the reset still asks for the previous Google account instead of the PIN they set, so the bypass often fails.9
  • Owners say the built-in speakers sound weak and tinny, so they use Bluetooth headphones or a speaker instead.3

Points mentioned by at least 3 owners, most mentioned first.

Loading...
Loading category ranking...

Technical Specifications of tablet LG G Pad 5 10.1 4G (4GB + 32GB)

Technical score
Technical score
6.3/ 10
✕
What it is
How good the specs are compared with the other models in this category, 1–10.
How we count it
Areas: We rate the specs in each area against the other models in this category.
Weighting: The areas that matter most to buyers count more. The shares are shown under Score components.
Share: The technical score is 35% of the overall score.
Score distribution
â–¼
<55-66-77-88-99-10
Score components:

22%

5.7

Performance

20%

5.8

Display

16%

6.4

Camera

14%

6.8

Battery

12%

7.7

Connectivity

8%

7.3

Software

5%

5.9

Design

3%

4.8

Audio

6.3
Reviews score
6.3
List score
?
Value for money
Value for money
7.4/ 10
✕
What it is
An indicator that combines the tablet's overall rating with its cost.
When it matters
When you are looking for a tablet with a good balance between quality and price.
Score distribution
â–¼
<55-66-77-88-99-10
Score components:

70%

6.7

Overall score

30%

8.9

Price

7.4
RAM capacity
4 GB
This tablet has 4 GB of RAM, which is more than 47.2% of tablets and equal to 17.8% of tablets.
Process node
14 nm
This tablet is built on a 14 nm process, which is smaller than 44.6% of tablets and equal to 8.5% of tablets.
Internal storage
32 GB
This tablet has 32 GB of internal storage, which is less than 60.9% of tablets and equal to 17.9% of tablets.
Geekbench 6 single-core score
347 points
This tablet scores 347 points in single-core tests, which is lower than 77.1% of tablets.
Chipset
Qualcomm Snapdragon 821
This tablet runs on Qualcomm Snapdragon 821, which is more advanced than 66.1% of tablets.
Show more
What reviewers say
Screen resolution
1920×1200
This tablet has a 1920×1200 screen, which is sharper than 39.1% of tablets and equal to 18.8% of tablets.
Refresh rate
60 Hz
This tablet has a 60 Hz screen, which is smoother than 0.1% of tablets and equal to 73.4% of tablets.
Display type
IPS LCD
This tablet uses a IPS LCD display type. 17% of tablets use this display technology.
Pixel density
224 ppi
This tablet has a pixel density of 224 ppi, which is higher than 50.1% of tablets and equal to 11.5% of tablets.
Display glass type
Tempered Glass
This tablet protects its screen with Tempered Glass, which is less durable than 78% of tablets and the same as 19.6% of tablets.
Show more
What reviewers say
Optical image stabilization
no
This tablet does not support optical stabilisation. 0.4% of tablets offer this.
Main camera megapixels
8 MP
This tablet has a rear camera with 8 MP resolution, which is higher than 36.4% of tablets and equal to 31.9% of tablets.
Front camera megapixels
5 MP
This tablet has a front camera with 5 MP resolution, which is higher than 48.6% of tablets and equal to 19.7% of tablets.
Main camera aperture
f/2.0
This tablet has a main camera aperture of f/2.0, which is wider than 57.4% of tablets and equal to 24.7% of tablets.
Optical zoom
1xxx
This tablet has 1xx optical zoom, which is stronger than 18.2% of tablets and equal to 80.9% of tablets.
Show more
What reviewers say
Battery capacity
8,200 mAh
This tablet has 8,200 mAh battery capacity, which is larger than 75.1% of tablets and equal to 0.9% of tablets.
Charging speed
18 W
This tablet charges at 18 W, which is faster than 48% of tablets and equal to 12.3% of tablets.
Battery life
12 hours
This tablet has a battery life of 12 hours, which is longer than that of 65.7% of tablets and equal to that of 9.3% of tablets.
video playback
Wireless charging
no
This tablet does not support wireless charging. 1.5% of tablets offer this.
Fast charging
yes
This tablet supports fast charging. 43.2% of tablets offer this.
Show more
What reviewers say
LTE support
yes
This tablet has built-in LTE. 57.1% of tablets offer this.
Wi-Fi connectivity
yes
This tablet connects to Wi-Fi. 0.2% of tablets offer this.
GPS
yes
This tablet has built-in GPS. 17.1% of tablets offer this.
5G connectivity
no
This tablet does not support 5G. 8.1% of tablets offer this.
NFC
no
This tablet does not include NFC. 10.8% of tablets offer this.
Show more
Operating system
Android
This tablet uses the Android operating system, which is more advanced than the one used by 23.2%.
Update support duration
medium
This tablet offers medium update support, which is longer than the support period of 47.6% of tablets and equal to that of 32.4% of tablets.
Direct OS updates
no
This tablet does not support direct OS updates. 79.8% of tablets offer this.
On-device AI
no
This tablet does not support on-device AI. 28.3% of tablets support this capability.
App tracking protection
no
This tablet does not support app tracking protection. 28.4% of tablets offer this.
Show more
IP rating
not rated
This tablet's IP rating is not rated, which is less protected than 16.5% of tablets and the same as 83.6% of tablets.
Weight
498 g
This tablet weighs 498 g, which is heavier than 52.2% of tablets and equal to 0.9% of tablets.
Backlit keyboard
no
This tablet does not support a backlit keyboard. 9.7% of tablets support backlit keyboards.
Keyboard accessory
yes
This tablet supports a keyboard accessory. 15.8% of tablets support this option.
Pen latency
N/A
Show more
Number of microphones
1
This tablet has a microphone array of 1, which is more than 0.2% of tablets and equal to 54.8% of tablets.
aptX Adaptive
no
This tablet does not support aptX Adaptive. 6.9% of tablets offer this.
Dolby Atmos support
no
This tablet does not support Dolby Atmos. 31.3% of tablets support Dolby Atmos.
N. of speakers
2
This tablet includes 2 speakers, which is more than in 9.8% of tablets and equal to the number in 60.8% of tablets.
FM radio
no
This tablet does not include an FM radio. 19% of tablets offer this.
Show more

LG G Pad 5 10.1 4G (4GB + 32GB) vs the average tablet

246810TotalPerformanceDisplayCameraBatteryConnectivitySoftwareDesignAudio
  • More advanced chipset
    This tablet has a more advanced chipset than the average tablet (Qualcomm Snapdragon 821 vs MediaTek MT8169A).
    Qualcomm Snapdragon 821 vs MediaTek MT8169A
  • Faster storage type
    This tablet uses UFS storage, while the average tablet uses eMMC. Storage technology still varies widely across tablets.
    UFS vs eMMC
  • More advanced graphics
    This tablet has more advanced graphics than the average tablet (Adreno 530 vs Mali-G51).
    Adreno 530 vs Mali-G51
  • Supports DisplayPort over USB-C
    This tablet supports DisplayPort over USB-C, the average tablet does not. 21.3% of tablets support DisplayPort over USB-C.
  • Supports LTE
    This tablet supports LTE, while the average tablet does not. 42.9% of tablets support LTE.
  • 2 hours longer battery life
    This tablet offers longer battery life than the average tablet (12 hours vs 10 hours). The average tablet offers 10 hours of battery life.
    video playback
    12 hours vs 10 hours
  • Wider front camera aperture
    This tablet has a wider front camera aperture than the average tablet (f/2 vs f/2.2). The average tablet's front camera aperture is f/2.2.
    f/2.0 vs f/2.2
  • 24.2% larger battery capacity
    This tablet has a larger battery capacity than the average tablet (8,200 mAh vs 6,600 mAh). The average tablet offers 6,600 mAh of battery capacity.
    8,200 mAh vs 6,600 mAh
  • More advanced chipset
    This tablet has a more advanced chipset than the average tablet (Qualcomm Snapdragon 821 vs MediaTek MT8169A).
    Qualcomm Snapdragon 821 vs MediaTek MT8169A
  • Faster storage type
    This tablet uses UFS storage, while the average tablet uses eMMC. Storage technology still varies widely across tablets.
    UFS vs eMMC
  • More advanced graphics
    This tablet has more advanced graphics than the average tablet (Adreno 530 vs Mali-G51).
    Adreno 530 vs Mali-G51
  • 17% higher CPU speed
    This tablet has a higher CPU speed than the average tablet (2.3 GHz vs 2 GHz). The average tablet has CPU speed of 2 GHz.
    2.34 GHz vs 2 GHz
  • 2x more memory bandwidth
    This tablet has more memory bandwidth than the average tablet (29.8 GB/s vs 14.9 GB/s). The average tablet has 14.9 GB/s of memory bandwidth.
    29.8 GB/s vs 14.9 GB/s
  • More advanced memory type
    This tablet uses more advanced memory than the average tablet (LPDDR4 vs LPDDR3).
    LPDDR4 vs LPDDR3
  • Wider front camera aperture
    This tablet has a wider front camera aperture than the average tablet (f/2 vs f/2.2). The average tablet's front camera aperture is f/2.2.
    f/2.0 vs f/2.2
  • Wider main camera aperture
    This tablet has a wider main camera aperture than the average tablet (f/2 vs f/2.2). The average tablet's main camera aperture is f/2.2.
    f/2.0 vs f/2.2
  • 2 hours longer battery life
    This tablet offers longer battery life than the average tablet (12 hours vs 10 hours). The average tablet offers 10 hours of battery life.
    video playback
    12 hours vs 10 hours
  • 24.2% larger battery capacity
    This tablet has a larger battery capacity than the average tablet (8,200 mAh vs 6,600 mAh). The average tablet offers 6,600 mAh of battery capacity.
    8,200 mAh vs 6,600 mAh
  • Supports DisplayPort over USB-C
    This tablet supports DisplayPort over USB-C, the average tablet does not. 21.3% of tablets support DisplayPort over USB-C.
  • Supports LTE
    This tablet supports LTE, while the average tablet does not. 42.9% of tablets support LTE.
  • Supports cellular data
    This tablet supports cellular data, while the average tablet does not. 47.4% of tablets offer this.
  • Fingerprint unlocking
    This tablet supports fingerprint unlocking, while the average tablet does not. 16% of tablets offer this.
    Side-mounted fingerprint scanner.
  • 24.6 mm narrower
    This tablet is narrower than the average tablet (150.7 mm vs 175.3 mm). The average tablet is 175.3 mm wide.
    150.7 mm vs 175.3 mm
  • 4 fewer CPU threads
    This tablet has fewer CPU threads than the average tablet (4 vs 8). The average tablet has 8 CPU threads.
    4 vs 8
  • No direct OS updates
    This tablet does not support direct OS updates, while the average tablet does. 79.7% of tablets offer this.
  • No continuous video AF
    This tablet does not support continuous video AF, the average tablet does. 57.7% of tablets support continuous video autofocus.
  • 78.3% lower multi-core score
    This tablet has a lower multi-core score than the average tablet (410 points vs 1,891 points). The average tablet scores 1,891 points in multi-core tests.
    410 points vs 1,891 points
  • Less durable glass
    This tablet has less durable glass than the average tablet (Tempered Glass vs Corning Gorilla Glass). The average tablet uses Corning Gorilla Glass.
    Tempered Glass vs Corning Gorilla Glass
  • No manual exposure control
    This tablet does not support manual exposure, while the average tablet does. 63.6% of tablets support manual exposure.
  • No manual white balance
    This tablet does not support manual white balance, while the average tablet does. 51.5% of tablets support manual white balance.
  • No big.LITTLE architecture
    This tablet does not support big.LITTLE architecture, while the average tablet does. 51.7% of tablets support big.LITTLE architecture.
  • 10.0% lower review score
    Reviews score
    6.3/ 10
    ✕
    What it is
    Average grade from independent test sites, magazines and video reviewers, 1–10.
    How we count it
    Grades: Each review's own score is converted to 1–10; without one, we grade the review ourselves. Big test sites count more, short reviews half as much as full tests. A video review counts half.
    Score: The average grade is 80% of the review mark; the number of reviews is the other 20% (1 review = 5, the typical number in this category = 8, the most-reviewed model = 10).
    Enough data: With few reviews, the average grade is pulled toward the typical grade of this category. No reviews yet: 7.4 for now.
    Share: Reviews count 25% of the overall score.
    Score distribution
    â–¼
    <55-66-77-88-99-10

    6.3

    Mark 7.2 is below the typical mark 7.8 of this category, so it cannot lift the score above the technical score

    80%

    7.2

    Average grade

    20%

    7.1

    Popularity

    Grades by review (6)
    1 review, with a printed score. 5 video reviews, each counting half as much as a written test. Reviews count 25% of the overall score.
    User ratings collected online are not part of this score.
    6.3 vs 7.0
  • 16.0% lower sentiment score
    6.3 vs 7.5
  • 4 fewer CPU threads
    This tablet has fewer CPU threads than the average tablet (4 vs 8). The average tablet has 8 CPU threads.
    4 vs 8
  • 78.3% lower multi-core score
    This tablet has a lower multi-core score than the average tablet (410 points vs 1,891 points). The average tablet scores 1,891 points in multi-core tests.
    410 points vs 1,891 points
  • No big.LITTLE architecture
    This tablet does not support big.LITTLE architecture, while the average tablet does. 51.7% of tablets support big.LITTLE architecture.
  • 52.4% lower single-core score
    This tablet has a lower single-core score than the average tablet (347 points vs 729 points). The average tablet scores 729 points in single-core tests.
    347 points vs 729 points
  • 50% less internal storage
    This tablet has less internal storage than the average tablet (32 GB vs 64 GB). The average tablet has 64 GB of internal storage.
    32 GB vs 64 GB
  • Less durable glass
    This tablet has less durable glass than the average tablet (Tempered Glass vs Corning Gorilla Glass). The average tablet uses Corning Gorilla Glass.
    Tempered Glass vs Corning Gorilla Glass
  • No continuous video AF
    This tablet does not support continuous video AF, the average tablet does. 57.7% of tablets support continuous video autofocus.
  • No manual exposure control
    This tablet does not support manual exposure, while the average tablet does. 63.6% of tablets support manual exposure.
  • No manual white balance
    This tablet does not support manual white balance, while the average tablet does. 51.5% of tablets support manual white balance.
  • No timelapse video
    This tablet does not support timelapse video, while the average tablet does. 57.5% of tablets support timelapse video.
  • Older Bluetooth version
    This tablet has an older Bluetooth version than the average tablet (4.2 vs 5).
    4.2 vs 5
  • No direct OS updates
    This tablet does not support direct OS updates, while the average tablet does. 79.7% of tablets offer this.
  • No dark mode
    This tablet does not support dark mode, while the average tablet does. 57.7% of tablets offer this.
  • No offline voice recognition
    This tablet does not support offline voice recognition, the average tablet does. 76.4% of tablets support offline voice recognition.
  • 47.2 mm taller
    This tablet is taller than the average tablet (247.2 mm vs 200 mm). The average tablet is 200 mm tall.
    247.2 mm vs 200 mm

Video reviews

Hands-on testing, unboxing, and real-world video evaluations

7.0
The Ian West Network
≈ estimated
27/07/2021
Owner review · light use, apps and price
Verdict
LG G Pad 5 10.1 4G works for light browsing and kids at a discounted carrier price, not for multitasking.
4.0
Device OverDose
≈ estimated
06/01/2021
Revisit review · design, battery and hardware checks
Verdict
LG G Pad 5 10.1 4G is a mid-range tablet with inconsistent stability, low memory and a questionable processor; cheaper options exist.
7.0
Joey The snapper!
≈ estimated
25/04/2020
Overview · apps, display, camera and performance tests
Verdict
LG G Pad 5 10.1 4G is an okay tablet for basic browsing, streaming and light use, but it's laggy and short on storage.
8.0
FishBee Productions
≈ estimated
08/02/2020
Unboxing and first impressions · battery, gaming and camera tests
Verdict
LG G Pad 5 10.1 4G impresses so far, with strong battery life and gaming, though case options are limited.
7.0
Inflewence's Interest
≈ estimated
18/10/2020
First impressions · unboxing and app tests
Verdict
LG G Pad 5 10.1 4G is fine for browsing, video and kids, but storage, speakers and gaming are weak.
Overview video
Not graded
Brand video

Expert reviews

In-depth analysis and verdict from leading tech publications

6.0
pcmag.com
✓ explicit
02/06/2020
Lab test · Budget LTE tablet
Verdict
The LG G Pad 5 10.1 is an average Android tablet whose built-in T-Mobile LTE is its main draw, but its dated processor and weak performance hold it back.

Third-party reviews

What customers like about LG G Pad 5 10.1 4G (4GB + 32GB)

  • Large 10.1-inch display with 1920x1200 resolution and good viewing angles
  • Excellent battery life from the 8,200mAh battery, often lasting over a full day
  • Includes 4G LTE connectivity for internet access on the go
  • Features a side-mounted fingerprint sensor for quick biometric unlocking
  • Durable build with an aluminum back and glass front
  • Maintains a headphone jack and supports microSD storage expansion

What customers don't like about LG G Pad 5 10.1 4G (4GB + 32GB)

  • Dated Snapdragon 821 processor leads to lackluster performance and occasional lag
  • Cameras (8MP rear, 5MP front) are subpar, often producing grainy images
  • Limited 32GB internal storage, with only about half usable out of the box
  • Software is outdated, launching with Android 9.0 and lacking long-term update support
  • LTE modem is older, resulting in slower speeds compared to modern smartphones
  • The 1.1-pound weight can feel heavy for long periods of one-handed use

Verdict

The LG G Pad 5 10.1 4G is a budget-friendly Android 9.0 tablet featuring a 10.1-inch IPS LCD WUXGA display with a resolution of 1920 x 1200 pixels and a 16:10 aspect ratio. It is equipped with 4GB of RAM, 32GB of expandable internal storage, and is powered by a quad-core Qualcomm Snapdragon 821 processor. Its main characteristics include 4G LTE connectivity, a side-mounted fingerprint sensor, and a substantial 8,200mAh battery that supports 18W fast charging. Key pros are its long-lasting battery life, premium metal-and-glass build, and crisp display suitable for media consumption. However, notable cons include its dated processor, which can lead to lackluster performance in modern apps, and relatively basic 8MP rear and 5MP front cameras that struggle in low-light conditions.

Compare LG G Pad 5 10.1 4G (4GB + 32GB) with other tablets

1Product to compare no. 1
VS
2Product to compare no. 2
VS
3Product to compare no. 3 (optional)

Graphic comparison of LG G Pad 5 10.1 4G (4GB + 32GB) and other tablets

No results found