Scored using Tablets Methodology v1.0
Tablets Methodology v1.0
Mathematical & Unbiased Scoring
Products in this category are scored under Frontum Tablets Methodology v1.0: technical specifications plus authentic consumer ratings, with 0% commercial bias.
Explore Tablets Methodology v1.0

Ulefone Armor Pad 2 4G (8GB + 256GB) Review | 168 Data compared

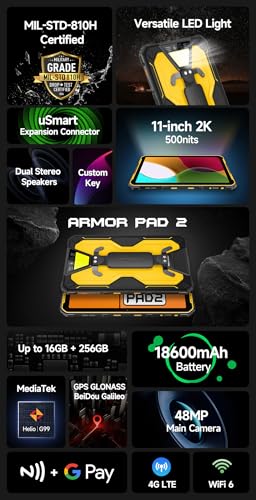
Avg. price:~£310RAM capacity:8 GBInternal storage:256 GBScreen size:11 inchesChipset:MediaTek Helio G99

Ulefone Armor Pad 2 4G (8GB + 256GB) Review: Compare 168 technical specifications and user reviews to see how this product ranks in the Tablets category and whether it is worth buying.
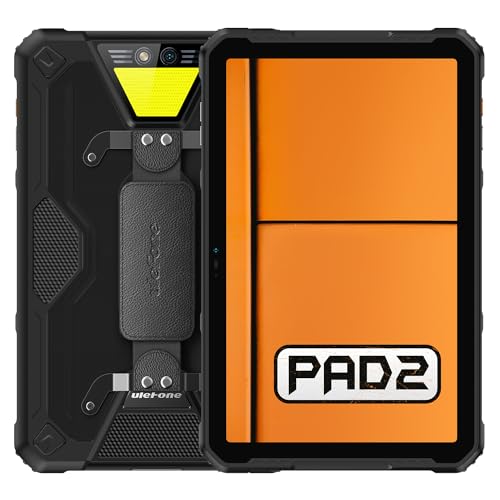
Ulefone Armor Pad 2 4G (8GB + 256GB)
7.5/10

Overall score

Score
7.5/ 10
✕
What it is
An overall evaluation of the smartphone's quality, based on technical analyses and user reviews.
When it matters
When you need a quick reference to identify the best Tablets on the market.
Score distribution
â–¼
<55-66-77-88-99-10
Score components

90%

7.5

Technical score

10%

7.9

User score

â–²Better than 78% of tablets
7.9

Value for money

Value for money
7.9/ 10
✕
What it is
An indicator that combines the smartphone's overall rating with its cost.
When it matters
When you are looking for a smartphone with a good balance between quality and price.
Score distribution
â–¼
<55-66-77-88-99-10
Score components

70%

7.5

Overall score

30%

8.9

Price

â–²Better than 80%
7.5

Technical score

Technical score
7.5/ 10
✕
What it is
An assessment of the smartphone's technical performance, covering eight key areas: performance & hardware, software, camera, connectivity, display, battery, audio, and design.
When it matters
When you want to compare Tablets based on technical performance and available features.
Score distribution
â–¼
<55-66-77-88-99-10
Score components

22%

7.2

Performance

20%

6.3

Display

16%

8.7

Camera

14%

8.9

Battery

12%

7.9

Connectivity

8%

8.2

Software & Features

5%

4.9

Design

3%

4.8

Audio & Multimedia

â–²Better than 78%
7.9

User score

User score
7.9/ 10
✕
What it is
A rating that combines user reviews and the total number of reviews received by the smartphone
When it matters
When you want to know how a smartphone handles daily tasks and how reliable it remains over time according to user feedback.
Score distribution
â–¼
<55-66-77-88-99-10
Score components

70%

8.6

User ratings

30%

6.3

Number of reviews

Based on ratings from across the web.
â–¼Worse than 65%
  • ulefone-armor-pad-2-8gb-256gb-4g
  • ulefone-armor-pad-2-8gb-256gb-4g
  • ulefone-armor-pad-2-8gb-256gb-4g
  • ulefone-armor-pad-2-8gb-256gb-4g
  • ulefone-armor-pad-2-8gb-256gb-4g
  • ulefone-armor-pad-2-8gb-256gb-4g
  • ulefone-armor-pad-2-8gb-256gb-4g
  • ulefone-armor-pad-2-8gb-256gb-4g
  • ulefone-armor-pad-2-8gb-256gb-4g
ulefone-armor-pad-2-8gb-256gb-4g
Where to buy
*As an Amazon Associate, we earn from qualifying purchases.
Best rankings
Available: ranking among products currently available (including other versions of this product).All: ranking among all products in the database.
Loading...
Loading category ranking...

Technical Specifications of tablet Ulefone Armor Pad 2 4G (8GB + 256GB)

Technical score
Technical score
7.5/ 10
✕
What it is
An assessment of the smartphone's technical performance, covering eight key areas: performance & hardware, software, camera, connectivity, display, battery, audio, and design.
When it matters
When you want to compare Tablets based on technical performance and available features.
Score distribution
â–¼
<55-66-77-88-99-10
Score components:

22%

7.2

Performance

20%

6.3

Display

16%

8.7

Camera

14%

8.9

Battery

12%

7.9

Connectivity

8%

8.2

Software & Features

5%

4.9

Design

3%

4.8

Audio & Multimedia

7.5
User score
User score
7.9/ 10
✕
What it is
A rating that combines user reviews and the total number of reviews received by the smartphone
When it matters
When you want to know how a smartphone handles daily tasks and how reliable it remains over time according to user feedback.
Score distribution
â–¼
<55-66-77-88-99-10
Score components

70%

8.6

User ratings

30%

6.3

Number of reviews

Based on ratings from across the web.
7.9
Popularity
Popularity
6.3/ 10
✕
What it is
An indicator based on the number of reviews received by the smartphone.
When it matters
When you prefer to purchase a product chosen and reviewed by many other consumers.
Score distribution
â–¼
<55-66-77-88-99-10
Popularity:
Ulefone Armor Pad 2 4G (8GB + 256GB) has a user popularity of 6.3 points, which is lower than 61.7% of Tablets.
6.3
Value for money
Value for money
7.9/ 10
✕
What it is
An indicator that combines the smartphone's overall rating with its cost.
When it matters
When you are looking for a smartphone with a good balance between quality and price.
Score distribution
â–¼
<55-66-77-88-99-10
Score components:

70%

7.5

Overall score

30%

8.9

Price

7.9
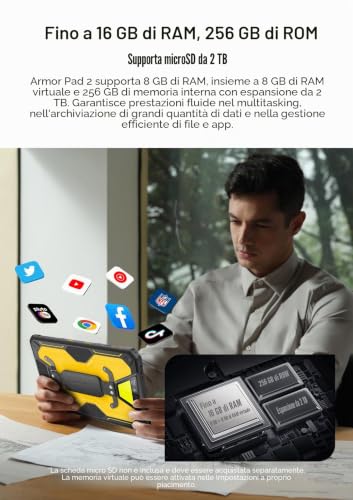
RAM capacity
8 GB
This tablet has a RAM capacity of 8 GB which is larger than the RAM capacity of 72.3% of tablets and equal to that of 17.8% of tablets.
Process node
6 nm
This tablet is built on a 6 nm process node, which is smaller than the node size used in 76.4% of tablets and equal to the node used in 8.2% of tablets.
Internal storage
256 GB
This tablet has an internal storage capacity of 256 GB which is larger than the storage of 76.5% of tablets and equal to that of 15.7% of tablets.
Geekbench 6 single-core benchmark score
544 points
This tablet scored 544 points in Geekbench 6 (single-core) which is lower than the score of 57.3% of tablets.
Chipset
MediaTek Helio G99
This tablet uses the MediaTek Helio G99 chipset, which is less advanced than the chipsets in 50.9% of tablets and equal to those in 2.9% of tablets.
Show more
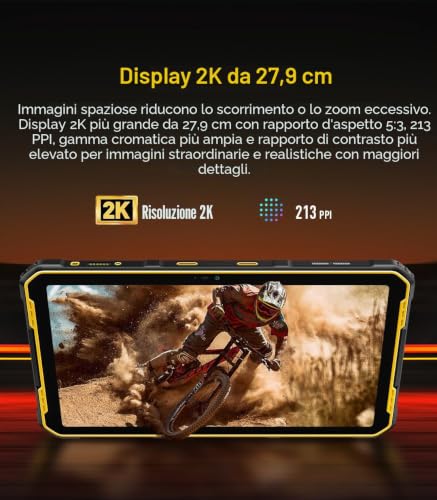
Screen resolution
2000×1200
This tablet has a screen resolution of 2000×1200 which is higher than that of 58.2% of tablets and equal to that of 8.2% of tablets.
Refresh rate
60 Hz
This tablet supports a refresh rate of 60 Hz which is equal to that in 73.8% of tablets.
Display type
IPS LCD
This tablet uses a IPS LCD display type. 17% of tablets use this display technology.
Pixel density
212 ppi
This tablet has a pixel density of 212 ppi which is lower than that of 57.6% of tablets and equal to that of 0.8% of tablets.
Display glass type
Corning Gorilla Glass 5
This tablet uses Corning Gorilla Glass 5 display glass which is stronger than that on 93.8% of tablets and equal to that on 5.8% of tablets.
Show more
Optical image stabilization
no
This tablet does not support optical image stabilization. 0.4% of tablets include OIS.
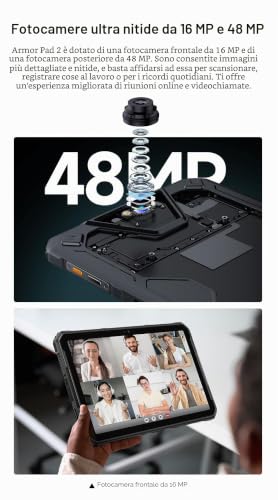
Main camera megapixels
48 MP
This tablet has a main camera resolution of 48 MP which is higher than that of 97.4% of tablets and equal to that of 0.2% of tablets.
Front camera megapixels
16 MP
This tablet has a front camera resolution of 16 MP which is higher than in 97% of tablets and equal to that in 1.4% of tablets.
Main camera aperture
f/1.8
This tablet has a main camera aperture of f/1.8 which is wider than that of 85.9% of tablets and equal to that of 14.1% of tablets.
Optical zoom
N/A
Show more
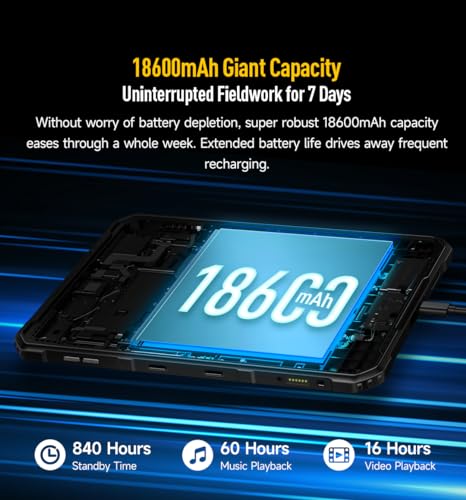
Battery capacity
18,600 mAh
This tablet has a battery capacity of 18,600 mAh which is larger than the batteries in 99.3% of tablets.
Charging speed
33 W
This tablet supports charging speeds of 33 W which is faster than in 74.8% of tablets and equal to speeds in 2.9% of tablets.
Battery life
26.28 hours
This tablet has a battery life of 26.28 hours, which is longer than that of 99.2% of tablets.
Wireless charging
no
This tablet does not support wireless charging. 1.5% of tablets support wireless charging.
Fast charging
yes
This tablet supports fast charging. 50.4% of tablets support fast charging.
Show more
LTE support
yes
This tablet supports LTE. 36.8% of tablets include LTE connectivity.
Wi-Fi connectivity
yes
This tablet supports Wi-Fi connectivity. 0.2% of tablets offer Wi-Fi support.
GPS
yes
This tablet supports GPS. 17.3% of tablets include GPS functionality.
5G connectivity
no
This tablet does not support 5G connectivity. 11.1% of tablets support 5G.
NFC
yes
This tablet supports NFC. 89.1% of tablets support NFC.
Show more
Operating system
Android
This tablet uses the Android operating system, which is more advanced than the one used by 23.3%.
Update support duration
short
This tablet offers short update support, which is shorter than the support period of 52.7% of tablets and equal to that of 47.3% of tablets.
Direct OS updates
yes
This tablet receives direct OS updates. 20.3% of tablets receive direct updates.
On-device AI
no
This tablet does not support on-device AI. 28.3% of tablets support this capability.
App tracking protection
yes
This tablet includes app tracking protection. 71.8% of tablets include app tracking protection.
Show more
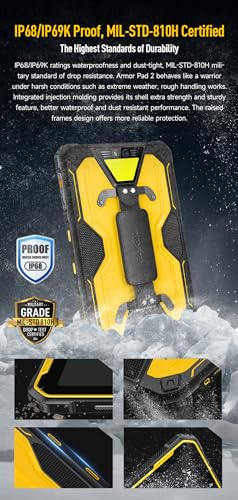
IP rating
IP68/IP69K
This tablet has an IP rating of IP68/IP69K which is higher than that of 98.5% of tablets and equal to that of 1.5% of tablets.
Weight
1,018 g
This tablet weighs 1,018 g which is heavier than 97.8% of tablets.
Backlit keyboard
no
This tablet does not support a backlit keyboard. 9.8% of tablets support backlit keyboards.
Keyboard accessory
?
Pen latency
N/A
Show more
Number of microphones
1
This tablet includes 1 microphones, which is more than in 0.2% of tablets and equal to the number in 54.8% of tablets.
aptX Adaptive
no
This tablet does not support aptX Adaptive. 6.9% of tablets offer this codec.
Dolby Atmos support
no
This tablet does not support Dolby Atmos. 31.5% of tablets support Dolby Atmos.
N. of speakers
2
This tablet includes 2 speakers, which is more than in 9.8% of tablets and equal to the number in 60.9% of tablets.
FM radio
yes
This tablet includes an FM radio. 81.1% of tablets offer FM radio functionality.
Show more

Ulefone Armor Pad 2 4G (8GB + 256GB) vs the average tablet

246810TotalPerformanceDisplayCameraBatteryConnectivitySoftware & FeaturesDesignAudio & Multimedia
  • 16.28 hours longer battery life
    This tablet offers longer battery life than the average tablet (26.3 hours vs 10 hours). The average tablet offers 10 hours of battery life.
    26.28 hours vs 10 hours
  • 40 MP higher main camera megapixels
    This tablet has a higher main camera resolution than the average tablet (48 MP vs 8 MP). The average tablet main camera has 8 MP megapixels.
    48 MP vs 8 MP
  • 11 MP higher front camera megapixels
    This tablet has more front camera megapixels than the average tablet (16 MP vs 5 MP). The average tablet has 5 MP front camera resolution.
    16 MP vs 5 MP
  • 2.83x larger battery capacity
    This tablet has a higher battery capacity than the average tablet (18,600 mAh vs 6,580 mAh). The average tablet battery has capacity of 6,580 mAh.
    18,600 mAh vs 6,580 mAh
  • 4x more storage
    This tablet has more internal storage than the average tablet (256 GB vs 64 GB). The average tablet provides 64 GB of internal storage.
    256 GB vs 64 GB
  • Faster storage type
    This tablet uses UFS storage, while the average tablet uses eMMC. Storage technology still varies widely across tablets.
    UFS vs eMMC
  • Higher IP rating
    This tablet has a better IP rating than the average tablet (IP68/IP69K vs not rated). Water and dust protection are still uncommon on tablets.
    IP68/IP69K vs not rated
  • 4 GB more RAM
    This tablet has more RAM capacity than the average tablet (8 GB vs 4 GB). The average tablet has 4 GB of RAM.
    8 GB vs 4 GB
  • 11.7% better value for money
    Ulefone Armor Pad 2 4G (8GB + 256GB) has better value for money than the average tablet (7.93 vs 7.1).
    7.93 vs 7.1
  • 4x more storage
    This tablet has more internal storage than the average tablet (256 GB vs 64 GB). The average tablet provides 64 GB of internal storage.
    256 GB vs 64 GB
  • Faster storage type
    This tablet uses UFS storage, while the average tablet uses eMMC. Storage technology still varies widely across tablets.
    UFS vs eMMC
  • 4 GB more RAM
    This tablet has more RAM capacity than the average tablet (8 GB vs 4 GB). The average tablet has 4 GB of RAM.
    8 GB vs 4 GB
  • More capable chipset
    This tablet uses the MediaTek Helio G99 chipset, while the average tablet uses MediaTek MT8169A.
    MediaTek Helio G99 vs MediaTek MT8169A
  • 57.1% smaller process node
    This tablet uses a smaller process node than the average tablet (6 nm vs 14 nm). The average tablet uses a process node of 14 nm.
    6 nm vs 14 nm
  • Newer DDR memory version
    This tablet supports a newer DDR version than the average tablet (LPDDR4X vs LPDDR3). The average DDR version is LPDDR3.
    LPDDR4X vs LPDDR3
  • 2 more CPU threads
    This tablet has more CPU threads than the average tablet (8 vs 6). The average tablet has 6 CPU threads.
    8 vs 6
  • 10% higher CPU speed
    This tablet has a higher CPU speed than the average tablet (2.2 GHz vs 2 GHz). The average tablet has CPU speed of 2 GHz.
    2.2 GHz vs 2 GHz
  • Better GPU
    This tablet uses the Mali-G57 MC2 GPU, while the average tablet uses Mali-G51. GPU choice is one of the main performance differences between tablets.
    Mali-G57 MC2 vs Mali-G51
  • 100 nits higher typical brightness
    This tablet has a higher typical brightness than the average tablet (500 nits vs 400 nits). The average tablet reaches 400 nits typical brightness.
    500 nits vs 400 nits
  • 0.9 inches larger screen size
    This tablet has a higher screen size than the average tablet (11 inches vs 10.1 inches). The average tablet has screen size of 10.1 inches.
    11 inches vs 10.1 inches
  • More durable display glass
    This tablet uses better display glass than the average tablet (Corning Gorilla Glass 5 vs Corning Gorilla Glass). Display glass choice still varies across tablets.
    Corning Gorilla Glass 5 vs Corning Gorilla Glass
  • 99 nits higher peak brightness
    This tablet has a higher peak brightness than the average tablet (500 nits vs 401 nits). The average tablet reaches 401 nits peak brightness.
    500 nits vs 401 nits
  • Higher screen resolution
    This tablet has a higher screen resolution than the average tablet (2000×1200 vs 1920×1200). The average tablet resolution is 1920×1200.
    2000×1200 vs 1920×1200
  • 2x higher touch sampling rate
    This tablet has a higher touch sampling rate than the average tablet (240 Hz vs 120 Hz). The average tablet has touch sampling rate of 120 Hz.
    240 Hz vs 120 Hz
  • Higher contrast ratio
    This tablet has a higher contrast ratio than the average tablet (1200:1 vs 1015:1). The average tablet contrast ratio is 1015:1.
    1,200:1 vs 1,015:1
  • 40 MP higher main camera megapixels
    This tablet has a higher main camera resolution than the average tablet (48 MP vs 8 MP). The average tablet main camera has 8 MP megapixels.
    48 MP vs 8 MP
  • 11 MP higher front camera megapixels
    This tablet has more front camera megapixels than the average tablet (16 MP vs 5 MP). The average tablet has 5 MP front camera resolution.
    16 MP vs 5 MP
  • Wider main camera aperture
    This tablet has a better main camera aperture than the average tablet (f/1.8 vs f/2.2). The average tablet uses f/2.2 main camera aperture.
    f/1.8 vs f/2.2
  • Better main-camera video
    This tablet supports better main-camera video recording than the average tablet (1440x30 fps vs 1080x30 fps). The average tablet supports 1080x30 fps main-camera video recording.
    1440x30 fps vs 1080x30 fps
  • Allows manual focus
    This tablet allows manual focus control, the average tablet does not. 37.2% of tablets include manual focus.
  • Allows manual ISO
    This tablet allows manual ISO adjustment, the average tablet does not. 46% of tablets feature manual ISO.
  • Supports slow-motion recording
    This tablet supports slow-motion recording, the average tablet does not. 37.5% of tablets offer slow-mo.
  • Includes flash
    This tablet features a built-in flash, the average tablet does not. 45.2% of tablets include a flash.
  • 16.28 hours longer battery life
    This tablet offers longer battery life than the average tablet (26.3 hours vs 10 hours). The average tablet offers 10 hours of battery life.
    26.28 hours vs 10 hours
  • 2.83x larger battery capacity
    This tablet has a higher battery capacity than the average tablet (18,600 mAh vs 6,580 mAh). The average tablet battery has capacity of 6,580 mAh.
    18,600 mAh vs 6,580 mAh
  • Supports fast charging
    This tablet supports fast charging, the average tablet does not. 49.7% of tablets feature fast charging.
  • 83.3% faster charging speed
    This tablet supports faster charging than the average tablet (33 W vs 18 W). The average tablet supports charging speed of 18 W.
    33 W vs 18 W
  • Supports NFC
    This tablet has NFC support, the average tablet does not. 10.9% of tablets include NFC.
  • Newer Wi-Fi version
    This tablet supports a newer Wi-Fi version than the average tablet (Wi-Fi 6 (802.11ax) vs Wi-Fi 5 (802.11ac)). The average tablet uses Wi-Fi Wi-Fi 5 (802.11ac).
    Wi-Fi 6 (802.11ax) vs Wi-Fi 5 (802.11ac)
  • Newer Bluetooth version
    This tablet supports a newer Bluetooth version than the average tablet (5.2 vs 5). The average tablet uses Bluetooth 5.0.
    5.2 vs 5.0
  • Includes fingerprint scanner
    This tablet offers a better fingerprint scanner setup than the average tablet (yes vs no). Fingerprint scanner quality still varies a lot between tablets.
    Side-mounted fingerprint scanner.
  • Includes app tracking protection
    This tablet includes app tracking protection, the average tablet does not. 28.3% of tablets offer app tracking protection.
  • Allows app offloading
    This tablet allows app offloading, the average tablet does not. 26.4% of tablets support app offloading.
  • Supports dynamic theme
    This tablet features dynamic themes, the average tablet does not. 29% of tablets offer dynamic theming.
  • Supports extra dim mode
    This tablet features extra dim mode, the average tablet does not. 35.4% of tablets support extra diming.
  • Includes clipboard warnings
    This tablet has clipboard warnings, the average tablet does not. 39.9% of tablets include clipboard warnings.
  • Higher IP rating
    This tablet has a better IP rating than the average tablet (IP68/IP69K vs not rated). Water and dust protection are still uncommon on tablets.
    IP68/IP69K vs not rated
  • Designed for kids
    This tablet is suitable for kids, the average tablet is not. 23.7% of tablets are suitable for kids.
  • 4 newer release date
    This tablet has a newer release date than the average tablet (2023 vs 2019).
    October 2023
    2023 vs 2019
  • Shorter update support
    This tablet offers shorter update support than the average tablet (short vs medium). The average tablet gets medium of update support.
    short vs medium
  • 2.08x heavier
    This tablet is heavier than the average tablet (1,018 g vs 490 g). The average tablet weighs 490 g.
    1,018 g vs 490 g
  • No manual white balance
    This tablet does not allow manual white balance adjustments, the average tablet does. 51.6% of tablets include white balance controls.
  • 6 mm thicker
    This tablet is thicker than the average tablet (14 mm vs 8 mm). The average tablet is 8.0 mm thick.
    14 mm vs 8.0 mm
  • 5.4% lower pixel density
    This tablet has a lower pixel density than the average tablet (212 ppi vs 224 ppi). The average tablet has pixel density of 224 ppi.
    212 ppi vs 224 ppi
  • 77.8 mm taller
    This tablet is taller than the average tablet (277.8 mm vs 200 mm). The average tablet is 200.0 mm tall.
    277.8 mm vs 200.0 mm
  • 2 fewer GPU execution units
    This tablet has less GPU execution units than the average tablet (2 vs 4). The average tablet has 4 GPU execution units.
    2 vs 4
  • 25.4% lower Geekbench 6 single-core benchmark score
    This tablet achieves a lower Geekbench 6 single-core benchmark score than the average tablet (544 points vs 729 points). The average tablet scores 729 points in Geekbench 6 single-core.
    544 points vs 729 points
  • 2 fewer GPU execution units
    This tablet has less GPU execution units than the average tablet (2 vs 4). The average tablet has 4 GPU execution units.
    2 vs 4
  • 25.4% lower Geekbench 6 single-core benchmark score
    This tablet achieves a lower Geekbench 6 single-core benchmark score than the average tablet (544 points vs 729 points). The average tablet scores 729 points in Geekbench 6 single-core.
    544 points vs 729 points
  • 5.4% lower pixel density
    This tablet has a lower pixel density than the average tablet (212 ppi vs 224 ppi). The average tablet has pixel density of 224 ppi.
    212 ppi vs 224 ppi
  • No manual white balance
    This tablet does not allow manual white balance adjustments, the average tablet does. 51.6% of tablets include white balance controls.
  • Shorter update support
    This tablet offers shorter update support than the average tablet (short vs medium). The average tablet gets medium of update support.
    short vs medium
  • 2.08x heavier
    This tablet is heavier than the average tablet (1,018 g vs 490 g). The average tablet weighs 490 g.
    1,018 g vs 490 g
  • 6 mm thicker
    This tablet is thicker than the average tablet (14 mm vs 8 mm). The average tablet is 8.0 mm thick.
    14 mm vs 8.0 mm
  • 77.8 mm taller
    This tablet is taller than the average tablet (277.8 mm vs 200 mm). The average tablet is 200.0 mm tall.
    277.8 mm vs 200.0 mm

Video reviews

Hands-on testing, unboxing, and real-world video evaluations

9.0
TechMagnet
≈ estimated
20/02/2024
Hands-on review · camera, add-on and durability tests
Verdict
Ulefone Armor Pad 2 4G is a rugged, capable tablet that the reviewer strongly recommends, especially with uSmart add-ons.
9.0
GSMaholic
≈ estimated
10/01/2024
Review · camera samples and feature walkthrough
Verdict
Ulefone Armor Pad 2 4G is an excellent rugged companion for professionals and outdoor users, with a striking screen and camera.
9.0
HansTechTalk
≈ estimated
19/10/2023
Hands-on review · display, gaming, battery and camera tests
Verdict
Strongly recommended as a powerful rugged tablet with lots of functionality.
8.0
clipset
≈ estimated
17/12/2023
Unboxing · features and accessories
Verdict
Ulefone Armor Pad 2 4G is not for everyone, but a very good choice for rugged needs at a fairly good price.
9.0
Nikolay Tanev
≈ estimated
12/12/2023
Unboxing · features, accessories and value
Verdict
Ulefone Armor Pad 2 4G is a reliable, capable rugged tablet and a great value for money.
9.0
gizmochina
≈ estimated
02/11/2023
Hands-on review · build, accessories and battery
Verdict
Ulefone Armor Pad 2 4G is an impressive rugged tablet packed with features and accessories.
Not graded
Not graded yet
Not graded yet
Not graded yet

Expert reviews

In-depth analysis and verdict from leading tech publications

techradar.com
08/02/2024
Lab test · Rugged tablet
Verdict
The Ulefone Armor Pad 2 is a tough outdoor tablet whose huge battery lasts days, but it lacks 5G and full-quality streaming.
smartzone.de
26/11/2023
Hands-on test · Outdoor tablet
Verdict
The Ulefone Armor Pad 2 is a capable outdoor tablet with fast performance and a bright camping light, though its camera is only average.

Third-party reviews

Based on ratings from across the web.
Reviews last updated: November 2026 · How we calculate this

What customers like about Ulefone Armor Pad 2 4G (8GB + 256GB)

  • Extreme durability with IP68/IP69K and MIL-STD-810H certifications, surviving drops and submersion
  • Massive 18,600mAh battery provides several days of usage on a single charge
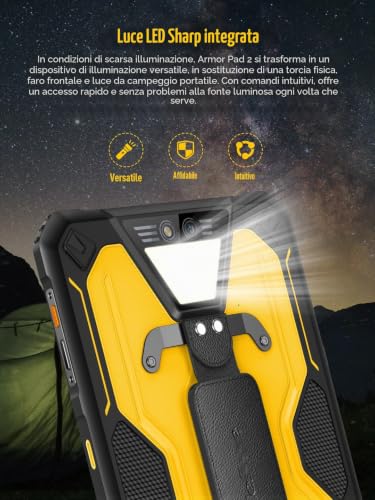
  • Integrated 750-lumen LED camping light on the back is highly effective for night work
  • uSmart expansion connector allows for specialized tools like endoscopes and microscopes
  • Loud and clear front-facing stereo speakers
  • Includes helpful accessories like a rotating hand strap and kickstand for a secure grip

What customers don't like about Ulefone Armor Pad 2 4G (8GB + 256GB)

  • Substantial weight and bulk make it tiring for prolonged handheld use
  • Lacks 5G connectivity, limited to 4G LTE networks
  • Screen brightness (500 nits) can still be challenging to read in direct, harsh sunlight
  • Camera software underutilises the potential of the 48MP sensor
  • Slow charging speeds relative to the massive battery capacity
  • Widevine L3 support limits video streaming quality from services like Netflix to 480p

Verdict

The Ulefone Armor Pad 2 is a highly durable 4G rugged tablet powered by a MediaTek Helio G99 octa-core processor, featuring 8GB of RAM (expandable to 16GB via virtual RAM) and 256GB of internal storage. It is built to withstand extreme environments with IP68/IP69K and MIL-STD-810H certifications, complemented by a massive 18,600mAh battery that supports 33W fast charging and reverse wired charging. Key highlights include an 11-inch 2K display with 500 nits of brightness, a powerful integrated 750-lumen LED camping light, a 48MP main camera, and a specialized uSmart expansion connector for professional tools like endoscopes. Its primary advantages are its exceptional battery life, ultra-rugged construction, and versatile outdoor features; however, notable drawbacks include its significant weight of 1018g, the lack of 5G connectivity, and a display that can still be difficult to read in direct sunlight despite its peak brightness.

Compare Ulefone Armor Pad 2 4G (8GB + 256GB) with other tablets

1Product to compare no. 1
VS
2Product to compare no. 2
VS
3Product to compare no. 3 (optional)

Graphic comparison of Ulefone Armor Pad 2 4G (8GB + 256GB) and other tablets

No results found