Scored using Smartphones Methodology v1.0
Smartphones Methodology v1.0
Mathematical & Unbiased Scoring
Products in this category are scored under Frontum Smartphones Methodology v1.0: technical specifications plus authentic consumer ratings, with 0% commercial bias.
Explore Smartphones Methodology v1.0

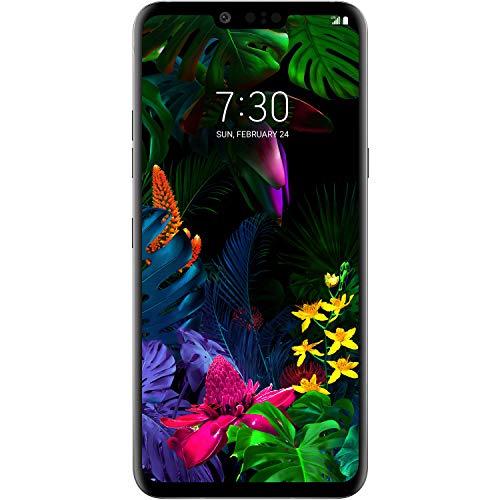
LG V35 ThinQ (6GB + 64GB) Review | 197 Data compared

Avg. price:~£310RAM capacity:6 GBInternal storage:64 GBScreen size:6 inchesMain camera megapixels:16 MP & 16 MP

LG V35 ThinQ (6GB + 64GB) Review: Compare 197 technical specifications and user reviews to see how this product ranks in the Smartphones category and whether it is worth buying.

6.1/10

Overall score

Score
6.1/ 10
✕
What it is
An overall evaluation of the smartphone's quality, based on technical analyses and user reviews.
When it matters
When you need a quick reference to identify the best smartphones on the market.
Score distribution
â–¼
<55-66-77-88-99-10
Score components

90%

5.8

Technical score

10%

8.4

User score

â–¼Worse than 75% of smartphones
6.9

Value for money

Value for money
6.9/ 10
✕
What it is
An indicator that combines the smartphone's overall rating with its cost.
When it matters
When you are looking for a smartphone with a good balance between quality and price.
Score distribution
â–¼
<55-66-77-88-99-10
Score components

70%

6.1

Overall score

30%

8.9

Price

â–¼Worse than 84%
5.8

Technical score

Technical score
5.8/ 10
✕
What it is
An assessment of the smartphone's technical performance, covering eight key areas: performance & hardware, software, camera, connectivity, display, battery, audio, and design.
When it matters
When you want to compare smartphones based on technical performance and available features.
Score distribution
â–¼
<55-66-77-88-99-10
Score components

25%

5.3

Performance & Hardware

18%

6.7

Camera

15%

6.0

Display

15%

4.6

Battery

10%

5.9

Software

10%

6.9

Connectivity

4%

5.1

Audio

3%

7.6

Design

â–¼Worse than 79%
8.4

User score

User score
8.4/ 10
✕
What it is
A rating that combines user reviews and the total number of reviews received by the smartphone
When it matters
When you want to know how a smartphone handles daily tasks and how reliable it remains over time according to user feedback.
Score distribution
â–¼
<55-66-77-88-99-10
Score components

70%

8.8

User ratings

30%

7.5

Number of reviews

â–²Better than 77%
  • No image
No image
Where to buy
*As an Amazon Associate, we earn from qualifying purchases.
Loading...
Loading category ranking...

Technical Specifications of smartphone LG V35 ThinQ (6GB + 64GB)

Technical score
Technical score
5.8/ 10
✕
What it is
An assessment of the smartphone's technical performance, covering eight key areas: performance & hardware, software, camera, connectivity, display, battery, audio, and design.
When it matters
When you want to compare smartphones based on technical performance and available features.
Score distribution
â–¼
<55-66-77-88-99-10
Score components:

25%

5.3

Performance & Hardware

18%

6.7

Camera

15%

6.0

Display

15%

4.6

Battery

10%

5.9

Software

10%

6.9

Connectivity

4%

5.1

Audio

3%

7.6

Design

5.8
User score
User score
8.4/ 10
✕
What it is
A rating that combines user reviews and the total number of reviews received by the smartphone
When it matters
When you want to know how a smartphone handles daily tasks and how reliable it remains over time according to user feedback.
Score distribution
â–¼
<55-66-77-88-99-10
Score components

70%

8.8

User ratings

30%

7.5

Number of reviews

8.4
Popularity
Popularity
7.5/ 10
✕
What it is
An indicator based on the number of reviews received by the smartphone.
When it matters
When you prefer to purchase a product chosen and reviewed by many other consumers.
Score distribution
â–¼
<55-66-77-88-99-10
Popularity:
LG V35 ThinQ (6GB + 64GB) has a popularity of 7.5 points, which is higher than 69.4% of smartphones.
7.5
Value for money
Value for money
6.9/ 10
✕
What it is
An indicator that combines the smartphone's overall rating with its cost.
When it matters
When you are looking for a smartphone with a good balance between quality and price.
Score distribution
â–¼
<55-66-77-88-99-10
Score components:

70%

6.1

Overall score

30%

8.9

Price

6.9
Brand name
LG
Processor model
Qualcomm Snapdragon 845
This smartphone uses the Qualcomm Snapdragon 845 processor which is faster than processors in 52.3% of smartphones and equal to processors in 0.9% of smartphones.
RAM capacity
6 GB
This smartphone has a RAM capacity of 6 GB which is smaller than the RAM capacity of 71.8% of smartphones and equal to that of 10.8% of smartphones.
Internal storage
64 GB
This smartphone has an internal storage capacity of 64 GB which is smaller than the storage of 89.6% of smartphones and equal to that of 7.9% of smartphones.
CPU boost clock speed
2.8 GHz
The CPU boost clock speed of this smartphone is 2.8 GHz which is higher than the boost speed of 64.2% of smartphones and equal to that of 4.1% of smartphones.
Show more
Operating system
Android
This smartphone uses the Android operating system, which outperforms that of 1%.
Android 8 Oreo
Android version
Android 8 Oreo
This smartphone runs Android version Android 8 Oreo which is older than that found in 96.6% of smartphones and equal to that in 1.7% of smartphones.
Direct OS updates
no
This smartphone does not receive direct OS updates. 20.6% of smartphones receive direct updates.
Open-source OS
yes
This smartphone uses an open-source OS. 94.6% of smartphones use an open-source OS.
Dark mode
yes
This smartphone offers dark mode. 95.8% of smartphones support this feature.
Show more
Multi-lens main camera
yes
This smartphone includes a multi-lens main camera system. 93.7% of smartphones include multi-lens setups.
Main camera megapixels
16 MP & 16 MP
This smartphone has a main camera resolution of 16 MP & 16 MP which is lower than that of 85.6% of smartphones and equal to that of 0.1% of smartphones.
Main camera aperture
f/1.6 & f/1.9
This smartphone has a main camera aperture of f/1.6 & f/1.9 which is wider than that of 92.6% of smartphones and equal to that of 0.2% of smartphones.
Main camera sensor area
16 mm²
This smartphone has a main camera sensor area of 16 mm² which is smaller than the main camera sensor area of 96.2% of smartphones and equal to that of 0.8% of smartphones.
Main camera pixel size
1 µm
This smartphone has a main camera pixel size of 1 µm which is larger than in 57.7% of smartphones and equal to the size in 20% of smartphones.
2 binned
Show more
Number of SIM slots
1
This smartphone has 1 SIM slots, which is fewer than in 96.2% of smartphones and equal to the number in 3.7% of smartphones.
Cellular module
yes
This smartphone includes a cellular module. 100% of smartphones include cellular modules.
5G connectivity
no
This smartphone does not support 5G connectivity. 66.9% of smartphones support 5G.
LTE support
yes
This smartphone supports LTE. 99.7% of smartphones include LTE connectivity.
Wi-Fi connectivity
yes
This smartphone supports Wi-Fi connectivity. 100% of smartphones offer Wi-Fi support.
Show more
Screen size
6 inches
This smartphone has a screen size of 6 inches which is smaller than the screens of 94.2% of smartphones and equal to those of 0.9% of smartphones.
Screen resolution
1440x 2880 px
This smartphone has a screen resolution of 1440x2880 px which is higher than that of 92.1% of smartphones and equal to that of 0.4% of smartphones.
Pixel density
537 ppi
This smartphone has a pixel density of 537 ppi which is higher than that of 98.1% of smartphones and equal to that of 0.3% of smartphones.
Display type
OLED/AMOLED
This smartphone uses a OLED/AMOLED display type. 58.6% of smartphones use this display technology.
Refresh rate
60 Hz
This smartphone supports a refresh rate of 60 Hz which is lower than in 84.3% of smartphones and equal to that in 15.7% of smartphones.
Show more
Battery capacity
3,300 mAh
This smartphone has a battery capacity of 3,300 mAh which is smaller than the batteries in 95.6% of smartphones and equal to those in 0.6% of smartphones.
Charging speed
18 W
This smartphone supports charging speeds of 18 W which is slower than in 76% of smartphones and equal to speeds in 11.7% of smartphones.
Fast charging
yes
This smartphone supports fast charging. 93.1% of smartphones support fast charging.
GSMArena full wired charge time
?
Wireless charging
yes
This smartphone supports wireless charging. 25.2% of smartphones support wireless charging.
Show more
Stereo speakers
no
This smartphone does not include stereo speakers. 64.4% of smartphones provide stereo audio.
3.5 mm headphone jack
yes
This smartphone includes a 3.5 mm headphone jack. 45.5% of smartphones offer this port.
Number of microphones
2
This smartphone includes 2 microphones, which is more than in 10.5% of smartphones and equal to the number in 66.6% of smartphones.
FM radio
yes
This smartphone includes an FM radio. 34.2% of smartphones offer FM radio functionality.
aptX Lossless
no
This smartphone does not support aptX Lossless. 12.9% of smartphones provide aptX Lossless.
Show more
Height
151.7 mm
This smartphone has a height of 151.7 mm which is shorter than 94.1% of smartphones and equal to that of 0.3% of smartphones.
Width
75.4 mm
This smartphone has a width of 75.4 mm which is narrower than 61.8% of smartphones and equal to that of 1.6% of smartphones.
Thickness
7.3 mm
This smartphone has a thickness of 7.3 mm which is thinner than 94.1% of smartphones and equal to that of 1.2% of smartphones.
Weight
157 g
This smartphone weighs 157 g which is lighter than 97.6% of smartphones and equal to the weight of 0.1% of smartphones.
Device volume
79,275 cm³
This smartphone has a device volume of 79,275 cm³ which is smaller than 94.8% of smartphones and equal to that of 0.1% of smartphones.
Show more

LG V35 ThinQ (6GB + 64GB) vs the average smartphone

246810TotalPerformance & HardwareSoftwareCameraConnectivityDisplayBatteryAudioDesign
  • Has optical image stabilization
    This smartphone has optical image stabilization (OIS), the average smartphone does not. 48.3% of smartphones feature OIS.
  • Supports wireless charging
    This smartphone supports wireless charging, the average smartphone does not. 25.2% of smartphones are wireless charging compatible.
  • Higher screen resolution
    This smartphone has a higher screen resolution than the average smartphone (1440x2880 px vs 1080x2400 px). The average smartphone resolution is 1080x2400 px.
    1440x2880 px vs 1080x2400 px
  • 35.9% higher pixel density
    This smartphone has a higher pixel density than the average smartphone (537 ppi vs 395 ppi). The average smartphone has a pixel density of 395 ppi.
    537 ppi vs 395 ppi
  • 8x more L1
    This smartphone has more L1 cache than the average smartphone (256 KB vs 32 KB). The average L1 cache is 32 KB.
    256 KB vs 32 KB
  • 50% lower TDP
    This smartphone has a lower TDP than the average smartphone (9 W vs 6 W). The average TDP for smartphones is 6 W.
    9 W vs 6 W
  • Supports Dolby Vision support
    This smartphone supports Dolby Vision, the average smartphone does not. 17.3% of smartphones are Dolby Vision compatible.
  • Supports HDR10+ support
    This smartphone supports HDR10+, the average smartphone does not. 22.2% of smartphones include HDR10+ support.
  • 5.2% higher user score
    User score
    8.4/ 10
    ✕
    What it is
    A rating that combines user reviews and the total number of reviews received by the smartphone
    When it matters
    When you want to know how a smartphone handles daily tasks and how reliable it remains over time according to user feedback.
    Score distribution
    â–¼
    â–¼
    <55-66-77-88-99-10
    LG V35 ThinQ
    the average smartphone
    LG V35 ThinQ (6GB + 64GB) has a higher user score than the average smartphone (8.42 vs 8.000).
    8.42 vs 8
  • 38.2% more popular
    LG V35 ThinQ (6GB + 64GB) is more popular than the average smartphone (7.52 vs 5.4).
    7.52 vs 5.44
  • 8x more L1
    This smartphone has more L1 cache than the average smartphone (256 KB vs 32 KB). The average L1 cache is 32 KB.
    256 KB vs 32 KB
  • 50% lower TDP
    This smartphone has a lower TDP than the average smartphone (9 W vs 6 W). The average TDP for smartphones is 6 W.
    9 W vs 6 W
  • 2 more memory channels
    This smartphone has more memory channels than the average smartphone (4 vs 2). The average smartphone has 2 memory channels.
    4 vs 2
  • Higher CPU base clock speed
    This smartphone has a higher CPU base clock speed than the average smartphone (4x2.8 GHz & 4x1.77 GHz vs 2x2.2 GHz & 6x2 GHz). The average smartphone has a base clock speed of 2x2.2 GHz & 6x2 GHz.
    4x2.8 GHz & 4x1.77 GHz vs 2x2.2 GHz & 6x2 GHz
  • 16.7% higher CPU boost clock speed
    This smartphone has a higher CPU boost clock speed than the average smartphone (2.8 GHz vs 2.4 GHz). The average smartphone has a boost clock speed of 2.4 GHz.
    2.8 GHz vs 2.4 GHz
  • 50% more L2 cache
    This smartphone has more L2 cache than the average smartphone (1536 KB vs 1024 KB). The average L2 cache is 1024 KB.
    1,536 KB vs 1,024 KB
  • 16.8% higher memory bandwidth
    This smartphone has higher memory bandwidth than the average smartphone (29.9 GB/s vs 25.6 GB/s). The average memory bandwidth is 25.6 GB/s.
    29.9 GB/s vs 25.6 GB/s
  • Higher on-device AI tier
    This smartphone runs on the productivity AI tier, while the average smartphone runs on fundamental, enabling stronger on-device AI features.
    AI CAM, Super Bright Camera, Google Lens, Super Far Field Voice Recognition
    productivity vs fundamental
  • Has optical image stabilization
    This smartphone has optical image stabilization (OIS), the average smartphone does not. 48.3% of smartphones feature OIS.
  • Supports RAW photo capture
    This smartphone supports RAW photo capture, the average smartphone does not. 37.1% of smartphones allow RAW files.
  • Wider front camera aperture
    This smartphone has a wider front camera aperture than the average smartphone (f/1.9 vs f/2.2). The average aperture is f/2.2.
    f/1.9 vs f/2.2
  • Supports laser autofocus
    This smartphone features laser autofocus, the average smartphone does not. 21.4% of smartphones include laser AF.
  • Wider main camera aperture
    This smartphone has a wider main camera aperture than the average smartphone (f/1.6 & f/1.9 vs f/1.8 & f/2.2 & f/2.4 & f/2.4). The average smartphone has a main camera aperture of f/1.8 & f/2.2 & f/2.4 & f/2.4.
    f/1.6 & f/1.9 vs f/1.8 & f/2.2 & f/2.4 & f/2.4
  • Allows manual shutter speed
    This smartphone allows manual shutter speed control, the average smartphone does not. 29.8% of smartphones include this.
  • 0.2 µm larger main camera pixel size
    This smartphone has a larger main camera pixel size than the average smartphone (1 µm vs 0.8 µm). The average pixel size is 0.8 µm.
    2 binned
    1.0 µm vs 0.8 µm
  • Newer USB version
    This smartphone supports a newer USB version than the average smartphone (3.1 vs 2). The average version is USB 2.0.
    3.1 vs 2.0
  • Supports motion tracking
    This smartphone supports motion tracking, the average smartphone does not. 22% of smartphones offer motion tracking capabilities.
  • Has a barometer
    This smartphone features a barometer, the average smartphone does not. 19.9% of smartphones include a barometer.
  • Higher screen resolution
    This smartphone has a higher screen resolution than the average smartphone (1440x2880 px vs 1080x2400 px). The average smartphone resolution is 1080x2400 px.
    1440x2880 px vs 1080x2400 px
  • 35.9% higher pixel density
    This smartphone has a higher pixel density than the average smartphone (537 ppi vs 395 ppi). The average smartphone has a pixel density of 395 ppi.
    537 ppi vs 395 ppi
  • Supports Dolby Vision support
    This smartphone supports Dolby Vision, the average smartphone does not. 17.3% of smartphones are Dolby Vision compatible.
  • Supports HDR10+ support
    This smartphone supports HDR10+, the average smartphone does not. 22.2% of smartphones include HDR10+ support.
  • Supports HDR10 support
    This smartphone supports HDR10, the average smartphone does not. 42.7% of smartphones are HDR10 compatible.
  • Has an always-on display
    This smartphone features an always-on display, the average smartphone does not. 49.2% of smartphones offer always-on functionality.
  • Has a curved display
    This smartphone features a curved display, the average smartphone does not. 24.5% of smartphones have curved screens.
  • Supports wireless charging
    This smartphone supports wireless charging, the average smartphone does not. 25.2% of smartphones are wireless charging compatible.
  • Has a 3.5 mm headphone jack
    This smartphone features a 3.5 mm headphone jack, the average smartphone does not. 45.5% of smartphones include a standard headphone jack.
  • Has FM radio
    This smartphone features an FM radio, the average smartphone does not. 34.2% of smartphones include an FM tuner.
  • Supports aptX
    This smartphone supports aptX, the average smartphone does not. 50% of smartphones are aptX compatible.
  • 20% lighter
    This smartphone is lighter than the average smartphone (157 g vs 196.2 g). The average smartphone weighs 196.2 g.
    157 g vs 196.2 g
  • 1.5 m deeper water resistance
    This smartphone has a deeper water resistance rating than the average smartphone (1.5 m vs 0 m). The average depth rating is 0 m.
    1.5 m vs 0 m
  • 1 mm thinner
    This smartphone is thinner than the average smartphone (7.3 mm vs 8.3 mm). The average smartphone thickness is 8.3 mm.
    7.3 mm vs 8.3 mm
  • 11.9 mm shorter
    This smartphone is shorter than the average smartphone (151.7 mm vs 163.6 mm). The average smartphone height is 163.6 mm.
    151.7 mm vs 163.6 mm
  • Better IP rating
    This smartphone has a better IP rating than the average smartphone (IP68 vs IP67). The average IP rating is IP67.
    IP68 vs IP67
  • 0.6 mm narrower
    This smartphone is narrower than the average smartphone (75.4 mm vs 76 mm). The average smartphone width is 76 mm.
    75.4 mm vs 76 mm
  • 18.9% smaller volume
    This smartphone has a smaller device volume than the average smartphone (79275 cm³ vs 97800 cm³). The average smartphone volume is 97800 cm³.
    79,275 cm³ vs 97,800 cm³
  • 50% lower refresh rate
    This smartphone has a lower refresh rate than the average smartphone (60 Hz vs 120 Hz). The average smartphone has a refresh rate of 120 Hz.
    60 Hz vs 120 Hz
  • 75% less storage
    This smartphone offers less internal storage than the average smartphone (64 GB vs 256 GB). The average smartphone includes 256 GB of internal storage.
    64 GB vs 256 GB
  • No 5G connectivity
    This smartphone does not support 5G connectivity, the average smartphone does. 66.9% of smartphones are 5G compatible.
  • 50% smaller main camera sensor area
    This smartphone has a smaller main camera sensor area than the average smartphone (16 mm² vs 32 mm²). The average smartphone sensor area is 32 mm².
    16 mm² vs 32 mm²
  • 34% smaller battery capacity
    This smartphone has a smaller battery capacity than the average smartphone (3300 mAh vs 5000 mAh). The average smartphone has a capacity of 5000 mAh.
    3,300 mAh vs 5,000 mAh
  • 0.67 inches inch smaller screen size
    This smartphone has a smaller screen size than the average smartphone (6 inches vs 6.67 inches). The average smartphone has a screen size of 6.67 inches.
    6 inches vs 6.67 inches
  • No stereo speakers
    This smartphone does not have stereo speakers, the average smartphone does. 64.4% of smartphones feature stereo speakers.
  • No live text recognition
    This smartphone does not support live text recognition, the average smartphone does. 50.9% of smartphones offer real-time text recognition.
  • 5.8% worse value for money
    LG V35 ThinQ (6GB + 64GB) has worse value for money than the average smartphone (6.93 vs 7.3).
    6.93 vs 7.34
  • 75% less storage
    This smartphone offers less internal storage than the average smartphone (64 GB vs 256 GB). The average smartphone includes 256 GB of internal storage.
    64 GB vs 256 GB
  • 25.3% slower GPU clock
    This smartphone has a lower GPU frequency than the average smartphone (710 MHz vs 950 MHz). The average smartphone has a GPU frequency of 950 MHz.
    710 MHz vs 950 MHz
  • 66.7% larger process node
    This smartphone is manufactured on a larger process node than the average smartphone (10 nm vs 6 nm). The average smartphone uses a 6 nm process.
    10 nm vs 6 nm
  • 42.9% lower maximum RAM capacity
    This smartphone supports less maximum RAM than the average smartphone (8 GB vs 14 GB). The average smartphone supports 14 GB of RAM.
    8 GB vs 14 GB
  • Worse processor
    This smartphone uses a worse processor than the average smartphone (Qualcomm Snapdragon 845 vs Qualcomm Snapdragon 7 Gen 3).
    Qualcomm Snapdragon 845 vs Qualcomm Snapdragon 7 Gen 3
  • 45.2% lower Geekbench 6 single-core benchmark score
    This smartphone performs worse in Geekbench 6 single-core than the average smartphone (516 vs 942). The average smartphone scores 942 in the Geekbench 6 single-core test.
    516 vs 942
  • 2 GB less RAM
    This smartphone has less RAM than the average smartphone (6 GB vs 8 GB). The average smartphone has 8 GB of RAM.
    6 GB vs 8 GB
  • 32.1% slower memory speed
    This smartphone has a lower memory speed than the average smartphone (1866 MHz vs 2750 MHz). The average smartphone has a memory speed of 2750 MHz.
    1,866 MHz vs 2,750 MHz
  • 50% less L3 cache
    This smartphone has a smaller L3 cache than the average smartphone (2048 KB vs 4096 KB). The average smartphone has an L3 cache of 4096 KB.
    2,048 KB vs 4,096 KB
  • 73.3% lower 3DMark Wild Life Unlimited benchmark
    This smartphone scores lower in 3DMark Wild Life Unlimited than the average smartphone (1,023 vs 3,825). The average smartphone scores 3,825.
    1,023 vs 3,825
  • 56.7% lower 3DMark Wild Life benchmark
    This smartphone performs worse in the 3DMark Wild Life benchmark than the average smartphone (1,349 vs 3,115). The average smartphone scores 3,115 in this benchmark.
    1,349 vs 3,115
  • Supports older OpenGL version
    This smartphone supports a lower OpenGL version than the average smartphone (3.1 vs 3.2). The average smartphone supports OpenGL version 3.2.
    3.1 vs 3.2
  • 59.7% lower 3DMark Wild Life Extreme benchmark
    This smartphone scores lower in 3DMark Wild Life Extreme than the average smartphone (494 vs 1,226). The average smartphone scores 1,226.
    494 vs 1,226
  • 22.6% lower Geekbench 6 multi-core benchmark score
    This smartphone performs worse in Geekbench 6 multi-core than the average smartphone (1960 vs 2,533). The average smartphone scores 2,533 in the Geekbench 6 multi-core test.
    1,960 vs 2,533
  • No live text recognition
    This smartphone does not support live text recognition, the average smartphone does. 50.9% of smartphones offer real-time text recognition.
  • Older Android version
    This smartphone runs an older Android version than the average smartphone (Android 8 Oreo vs Android 14). The average smartphone runs Android version Android 14.
    Android 8 Oreo vs Android 14
  • Lacks app tracking protection
    This smartphone does not have app tracking protection, the average smartphone does. 70.2% of smartphones include app tracking protection.
  • Lacks focus mode
    This smartphone does not have a focus mode, the average smartphone does. 60.4% of smartphones include a dedicated focus mode.
  • No Wi-Fi password sharing
    This smartphone does not support Wi-Fi password sharing, the average smartphone does. 57.9% of smartphones allow easy Wi-Fi sharing.
  • No battery health monitoring
    This smartphone lacks battery health monitoring, the average smartphone includes it. 66.3% of smartphones provide battery health stats.
  • Does not allow app offloading
    This smartphone does not support app offloading, the average smartphone does. 51.9% of smartphones support app offloading to save space.
  • No scrolling screenshot support
    This smartphone does not support scrolling screenshots, the average smartphone does. 81.1% of smartphones allow scrolling screenshots.
  • Does not allow play while downloading
    This smartphone cannot play games while downloading, the average smartphone can. 77.3% of smartphones support play-while-downloading.
  • No dynamic theme support
    This smartphone does not support dynamic themes, the average smartphone does. 81.9% of smartphones support dynamic theming.
  • Lacks extra dim mode
    This smartphone does not have extra dim mode, the average smartphone does. 82.5% of smartphones offer extra dimming features.
  • 50% smaller main camera sensor area
    This smartphone has a smaller main camera sensor area than the average smartphone (16 mm² vs 32 mm²). The average smartphone sensor area is 32 mm².
    16 mm² vs 32 mm²
  • Lower-resolution main camera
    This smartphone has a lower-resolution main camera than the average smartphone (16 MP & 16 MP vs 50 MP & 8 MP). The average smartphone has a 50 MP & 8 MP main camera.
    16 MP & 16 MP vs 50 MP & 8 MP
  • Lower front camera megapixels
    This smartphone has lower front camera megapixels than the average smartphone (8 MP vs 16 MP). The average smartphone has a 16 MP front camera.
    8 MP vs 16 MP
  • No 5G connectivity
    This smartphone does not support 5G connectivity, the average smartphone does. 66.9% of smartphones are 5G compatible.
  • Older Bluetooth version
    This smartphone uses an older Bluetooth version than the average smartphone (5 vs 5.2). The average smartphone uses Bluetooth 5.2.
    5.0 vs 5.2
  • 1 fewer SIM slot/s
    This smartphone has fewer SIM slots than the average smartphone (1 vs 2). The average smartphone has 2 SIM slots.
    1 vs 2
  • 50% lower refresh rate
    This smartphone has a lower refresh rate than the average smartphone (60 Hz vs 120 Hz). The average smartphone has a refresh rate of 120 Hz.
    60 Hz vs 120 Hz
  • 0.67 inches inch smaller screen size
    This smartphone has a smaller screen size than the average smartphone (6 inches vs 6.67 inches). The average smartphone has a screen size of 6.67 inches.
    6 inches vs 6.67 inches
  • 555 nits lower peak brightness
    This smartphone has a lower peak brightness than the average smartphone (445 nits vs 1000 nits). The average smartphone peak brightness is 1000 nits.
    445 nits vs 1,000 nits
  • 29.2% lower screen brightness
    This smartphone has a lower screen brightness than the average smartphone (467 nits vs 660 nits). The average smartphone has a brightness of 660 nits.
    467 nits vs 660 nits
  • 75% lower touch sampling rate
    This smartphone has a lower touch sampling rate than the average smartphone (60 Hz vs 240 Hz). The average smartphone has a sampling rate of 240 Hz.
    60 Hz vs 240 Hz
  • 34% smaller battery capacity
    This smartphone has a smaller battery capacity than the average smartphone (3300 mAh vs 5000 mAh). The average smartphone has a capacity of 5000 mAh.
    3,300 mAh vs 5,000 mAh
  • 72.6% lower PCMark Work 3.0 battery benchmark
    This smartphone scores lower in PCMark Work 3.0 battery benchmark than the average smartphone (215 min vs 786 min). The average smartphone scores 786 min.
    215 min vs 786 min
  • Lower GSMArena battery endurance score
    This smartphone has a lower GSMArena battery endurance score than the average smartphone (87 vs 99.5). The average smartphone scores 99.5.
    87 vs 99.5
  • 45.5% slower charging speed
    This smartphone has a slower charging speed than the average smartphone (18 W vs 33 W). The average smartphone charges at 33 W.
    18 W vs 33 W
  • 25% slower wireless charging speed
    This smartphone has a slower wireless charging speed than the average smartphone (15 W vs 20 W). The average smartphone wireless charging speed is 20 W.
    15 W vs 20 W
  • No stereo speakers
    This smartphone does not have stereo speakers, the average smartphone does. 64.4% of smartphones feature stereo speakers.
  • 6 year/s older release date
    This smartphone is an older model than the average smartphone (2018 vs 2024). 6.00% of smartphones were released more recently.
    June 2018
    2018 vs 2024
  • Poor brand origin
    This smartphone has a poorer brand origin compared to the average smartphone. 0.00% of smartphones come from top-tier brand origins.
    South Korea vs China

Video reviews

Hands-on testing, unboxing, and real-world video evaluations

Expert reviews

In-depth analysis and verdict from leading tech publications

C
cnet.com
09/07/2018
Summary of the review
M
mashable.com
26/06/2018
Summary of the review
T
tomsguide.com
20/11/2018
Summary of the review
T
techradar.com
01/06/2018
Summary of the review
P
pcmag.com
30/05/2018
Summary of the review
C
consumerreports.org
2018
Summary of the review
F
forums.androidcentral.com
17/07/2018
Summary of the review
T
tomsguide.fr
02/11/2018
Summary of the review
M
movilzona.es
30/05/2018
Summary of the review

Third-party reviews

What we like about LG V35 ThinQ (6GB + 64GB)

  • High-quality OLED display with vibrant colors and sharp detail
  • Exceptional audio performance featuring a Hi-Fi Quad DAC and 3.5mm headphone jack
  • Fast and responsive performance powered by the Snapdragon 845 chipset
  • Lightweight and comfortable design that is easy to hold
  • Strong battery life often lasting a full day or more under normal use
  • Versatile camera system with a useful secondary wide-angle lens
  • Durable build with IP68 water/dust resistance and military-grade compliance

What we don't like about LG V35 ThinQ (6GB + 64GB)

  • Integrated loudspeaker quality is often described as shrill, tinny, or too quiet
  • AI camera features and software processing can result in exaggerated, over-saturated colors
  • Frequent complaints regarding slow or infrequent software updates and security patches
  • Presence of carrier bloatware and a heavy manufacturer UI skin
  • Limited internal storage (64GB) which may fill up quickly for power users
  • Delicate glass exterior that may be prone to breaking without a protective case

Verdict

The LG V35 ThinQ is a high-performance flagship featuring a 6.0-inch QHD+ P-OLED FullVision display (2880 x 1440) with HDR10 support and a notch-free design. It is powered by the Qualcomm Snapdragon 845 processor paired with 6GB of RAM and 64GB of internal storage, expandable up to 2TB via microSD. The device's main characteristics include a premium lightweight build (157g) with IP68 water and dust resistance, MIL-STD-810G durability, and a 3,300 mAh battery supporting wireless and Quick Charge 3.0. Major pros include its exceptional audio quality via a 32-bit Hi-Fi Quad DAC and DTS:X 3D Surround Sound, alongside a versatile dual 16MP rear camera system (standard f/1.6 and super wide-angle f/1.9). However, common cons include its dated software support, a single bottom-firing speaker that can sound tinny, and AI camera processing that sometimes over-exaggerates colors.

Compare LG V35 ThinQ (6GB + 64GB) with other smartphones

1Product to compare no. 1
VS
2Product to compare no. 2
VS
3Product to compare no. 3 (optional)

Graphic comparison of LG V35 ThinQ (6GB + 64GB) and other smartphones

No results found