Scored using Tablets Methodology v1.0
Tablets Methodology v1.0
Mathematical & Unbiased Scoring
Products in this category are scored under Frontum Tablets Methodology v1.0: technical specifications plus authentic consumer ratings, with 0% commercial bias.
Explore Tablets Methodology v1.0

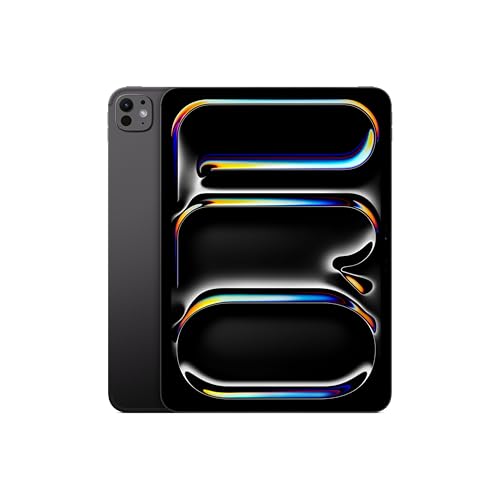
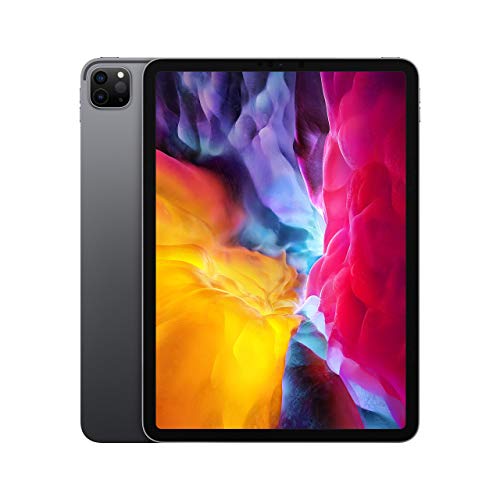
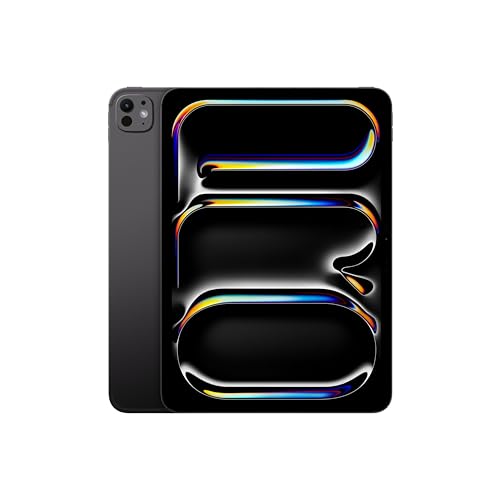
Apple iPad Pro 11 2024 (16GB + 2TB) Review | 168 Data compared

Avg. price:~£2,060RAM capacity:16 GBInternal storage:2 TBScreen size:11 inchesChipset:Apple M4

Apple iPad Pro 11 2024 (16GB + 2TB) Review: Compare 168 technical specifications and user reviews to see how this product ranks in the Tablets category and whether it is worth buying.
Apple iPad Pro 11 2024 (16GB + 2TB)
9.0/10

Overall score

Score
9.0/ 10
✕
What it is
An overall evaluation of the smartphone's quality, based on technical analyses and user reviews.
When it matters
When you need a quick reference to identify the best Tablets on the market.
Score distribution
▼
<55-66-77-88-99-10
Score components

90%

8.9

Technical score

10%

9.2

User score

★Better than 99% of tablets
6.6

Value for money

Value for money
6.6/ 10
✕
What it is
An indicator that combines the smartphone's overall rating with its cost.
When it matters
When you are looking for a smartphone with a good balance between quality and price.
Score distribution
▼
<55-66-77-88-99-10
Score components

70%

9.0

Overall score

30%

1.0

Price

▼Worse than 72%
8.9

Technical score

Technical score
8.9/ 10
✕
What it is
An assessment of the smartphone's technical performance, covering eight key areas: performance & hardware, software, camera, connectivity, display, battery, audio, and design.
When it matters
When you want to compare Tablets based on technical performance and available features.
Score distribution
▼
<55-66-77-88-99-10
Score components

22%

9.9

Performance

20%

8.9

Display

16%

8.9

Camera

14%

7.2

Battery

12%

9.6

Connectivity

8%

9.7

Software & Features

5%

7.4

Design

3%

7.8

Audio & Multimedia

★Better than 98%
9.2

User score

User score
9.2/ 10
✕
What it is
A rating that combines user reviews and the total number of reviews received by the smartphone
When it matters
When you want to know how a smartphone handles daily tasks and how reliable it remains over time according to user feedback.
Score distribution
▼
<55-66-77-88-99-10
Score components

70%

9.3

User ratings

30%

9.0

Number of reviews

Based on 975 buyer reviews from online shops.
How we calculate this
User ratings – average star rating across all shop listings, weighted by how many reviews each has, on a 1–10 scale.
Number of reviews – how many buyer reviews the product has, on a logarithmic scale; the 8% most-reviewed models in the category get 10.
★Better than 93%
  • apple-ipad-pro-11-2024-16gb-2tb
  • apple-ipad-pro-11-2024-16gb-2tb
  • apple-ipad-pro-11-2024-16gb-2tb
  • apple-ipad-pro-11-2024-16gb-2tb
  • apple-ipad-pro-11-2024-16gb-2tb
  • apple-ipad-pro-11-2024-16gb-2tb
apple-ipad-pro-11-2024-16gb-2tb
Best prices
*As an Amazon Associate, we earn from qualifying purchases.
Available versions:
Other versions:
Loading...
Loading category ranking...

Technical Specifications of tablet Apple iPad Pro 11 2024 (16GB + 2TB)

Technical score
Technical score
8.9/ 10
✕
What it is
An assessment of the smartphone's technical performance, covering eight key areas: performance & hardware, software, camera, connectivity, display, battery, audio, and design.
When it matters
When you want to compare Tablets based on technical performance and available features.
Score distribution
▼
<55-66-77-88-99-10
Score components:

22%

9.9

Performance

20%

8.9

Display

16%

8.9

Camera

14%

7.2

Battery

12%

9.6

Connectivity

8%

9.7

Software & Features

5%

7.4

Design

3%

7.8

Audio & Multimedia

8.9
User score
User score
9.2/ 10
✕
What it is
A rating that combines user reviews and the total number of reviews received by the smartphone
When it matters
When you want to know how a smartphone handles daily tasks and how reliable it remains over time according to user feedback.
Score distribution
▼
<55-66-77-88-99-10
Score components

70%

9.3

User ratings

30%

9.0

Number of reviews

Based on 975 buyer reviews from online shops.
How we calculate this
User ratings – average star rating across all shop listings, weighted by how many reviews each has, on a 1–10 scale.
Number of reviews – how many buyer reviews the product has, on a logarithmic scale; the 8% most-reviewed models in the category get 10.
9.2
Popularity
Popularity
9.0/ 10
✕
What it is
An indicator based on the number of reviews received by the smartphone.
When it matters
When you prefer to purchase a product chosen and reviewed by many other consumers.
Score distribution
▼
<55-66-77-88-99-10
Popularity:
Apple iPad Pro 11 2024 (16GB + 2TB) has a user popularity of 9 points, which is lower than 86.2% of Tablets.
9.0
Value for money
Value for money
6.6/ 10
✕
What it is
An indicator that combines the smartphone's overall rating with its cost.
When it matters
When you are looking for a smartphone with a good balance between quality and price.
Score distribution
▼
<55-66-77-88-99-10
Score components:

70%

9.0

Overall score

30%

1.0

Price

6.6
RAM capacity
16 GB
This tablet has a RAM capacity of 16 GB which is larger than the RAM capacity of 96.2% of tablets and equal to that of 3.6% of tablets.
Process node
3 nm
This tablet is built on a 3 nm process node, which is smaller than the node size used in 96.7% of tablets and equal to the node used in 3.3% of tablets.
Internal storage
2 GB
This tablet has an internal storage capacity of 2 TB which is larger than the storage of 99.7% of tablets and equal to that of 0.3% of tablets.
Geekbench 6 single-core benchmark score
3,700 points
This tablet scored 3,700 points in Geekbench 6 (single-core) which is higher than the score of 99.5% of tablets.
Chipset
Apple M4
This tablet uses the Apple M4 chipset, which is more advanced than the chipsets in 99.4% of tablets and equal to those in 0.3% of tablets.
Show more
Screen resolution
2420×1668
This tablet has a screen resolution of 2420×1668 which is higher than that of 77.3% of tablets and equal to that of 0.2% of tablets.
Refresh rate
120 Hz
This tablet supports a refresh rate of 120 Hz which is higher than in 80.4% of tablets and equal to that in 10.8% of tablets.
Display type
OLED/AMOLED
This tablet uses a OLED/AMOLED display type. 92.5% of tablets use this display technology.
Pixel density
264 ppi
This tablet has a pixel density of 264 ppi which is higher than that of 71% of tablets and equal to that of 5.9% of tablets.
Display glass type
Corning Gorilla Glass
This tablet uses Corning Gorilla Glass display glass which is stronger than that on 45.4% of tablets and equal to that on 32.7% of tablets.
Show more
Optical image stabilization
no
This tablet does not support optical image stabilization. 0.4% of tablets include OIS.
Main camera megapixels
12 MP
This tablet has a main camera resolution of 12 MP which is higher than that of 69.3% of tablets and equal to that of 4.6% of tablets.
Front camera megapixels
12 MP
This tablet has a front camera resolution of 12 MP which is higher than in 90% of tablets and equal to that in 6.2% of tablets.
Main camera aperture
f/1.8
This tablet has a main camera aperture of f/1.8 which is wider than that of 85.9% of tablets and equal to that of 14.1% of tablets.
Optical zoom
1xxx
This tablet supports 1xx optical zoom which is higher than in 18.4% of tablets and equal to that in 80.7% of tablets.
Show more
Battery capacity
8,160 mAh
This tablet has a battery capacity of 8,160 mAh which is larger than the batteries in 75% of tablets and equal to those in 0.3% of tablets.
Charging speed
35 W
This tablet supports charging speeds of 35 W which is faster than in 77.7% of tablets and equal to speeds in 1.5% of tablets.
Battery life
10 hours
This tablet has a battery life of 10 hours, which is longer than that of 39.1% of tablets and equal to that of 20.5% of tablets.
Wireless charging
no
This tablet does not support wireless charging. 1.5% of tablets support wireless charging.
Fast charging
yes
This tablet supports fast charging. 50.4% of tablets support fast charging.
Show more
LTE support
yes
This tablet supports LTE. 36.8% of tablets include LTE connectivity.
Wi-Fi connectivity
yes
This tablet supports Wi-Fi connectivity. 0.2% of tablets offer Wi-Fi support.
GPS
yes
This tablet supports GPS. 17.3% of tablets include GPS functionality.
5G connectivity
yes
This tablet supports 5G connectivity. 89% of tablets support 5G.
NFC
no
This tablet does not support NFC. 10.9% of tablets support NFC.
Show more
Operating system
iPadOS
This tablet uses the iPadOS operating system, which is more advanced than the one used by 94.6%.
Update support duration
long
This tablet offers long update support, which is longer than the support period of 80% of tablets and equal to that of 20% of tablets.
Direct OS updates
yes
This tablet receives direct OS updates. 20.3% of tablets receive direct updates.
On-device AI
yes
This tablet supports on-device AI. 71.8% of tablets support this capability.
App tracking protection
yes
This tablet includes app tracking protection. 71.8% of tablets include app tracking protection.
Show more
IP rating
not rated
This tablet has an IP rating of not rated which is lower than that of 16.3% of tablets and equal to that of 83.7% of tablets.
Weight
446 g
This tablet weighs 446 g which is lighter than 68.7% of tablets and equal to the weight of 0.3% of tablets.
Backlit keyboard
no
This tablet does not support a backlit keyboard. 9.8% of tablets support backlit keyboards.
Keyboard accessory
yes
This tablet supports a keyboard accessory. 15.8% of tablets support this option.
Pen latency
9 ms
This tablet has a pen latency of 9 ms, which is lower than that of 43.3% of tablets and equal to that of 26.7% of tablets.
Show more
Number of microphones
4
This tablet includes 4 microphones, which is more than in 93% of tablets and equal to the number in 4.4% of tablets.
aptX Adaptive
no
This tablet does not support aptX Adaptive. 6.9% of tablets offer this codec.
Dolby Atmos support
yes
This tablet supports Dolby Atmos. 68.6% of tablets support Dolby Atmos.
N. of speakers
4
This tablet includes 4 speakers, which is more than in 70.9% of tablets and equal to the number in 22.7% of tablets.
FM radio
no
This tablet does not include an FM radio. 19% of tablets offer FM radio functionality.
Show more

Apple iPad Pro 11 2024 (16GB + 2TB) vs the average tablet

246810TotalPerformanceDisplayCameraBatteryConnectivitySoftware & FeaturesDesignAudio & Multimedia
  • More capable chipset
    This tablet uses the Apple M4 chipset, while the average tablet uses MediaTek MT8169A.
    Apple M4 vs MediaTek MT8169A
  • 2x higher refresh rate
    This tablet has a higher refresh rate than the average tablet (120 Hz vs 60 Hz). The average tablet has refresh rate of 60 Hz.
    120 Hz vs 60 Hz
  • Faster storage type
    This tablet uses NVMe storage, while the average tablet uses eMMC. Storage technology still varies widely across tablets.
    NVMe vs eMMC
  • 32x more storage
    This tablet has more internal storage than the average tablet (2 TB vs 64 GB). The average tablet provides 64 GB of internal storage.
    2 TB vs 64 GB
  • 2.2x higher CPU speed
    This tablet has a higher CPU speed than the average tablet (4.4 GHz vs 2 GHz). The average tablet has CPU speed of 2 GHz.
    4.4 GHz vs 2 GHz
  • Better GPU
    This tablet uses the Apple GPU (10-core graphics) GPU, while the average tablet uses Mali-G51. GPU choice is one of the main performance differences between tablets.
    Apple GPU (10-core graphics) vs Mali-G51
  • 12 GB more RAM
    This tablet has more RAM capacity than the average tablet (16 GB vs 4 GB). The average tablet has 4 GB of RAM.
    16 GB vs 4 GB
  • 7.75x higher Geekbench 6 multi-core benchmark score
    This tablet achieves a higher Geekbench 6 multi-core benchmark score than the average tablet (14647 points vs 1891 points). The average tablet scores 1891 points in Geekbench 6 multi-core.
    14,647 points vs 1,891 points
  • 15.5% higher user score
    User score
    9.2/ 10
    ✕
    What it is
    A rating that combines user reviews and the total number of reviews received by the smartphone
    When it matters
    When you want to know how a smartphone handles daily tasks and how reliable it remains over time according to user feedback.
    Score distribution
    ▼
    ▼
    <55-66-77-88-99-10
    Apple iPad Pro 11 2024
    the average tablet
    Apple iPad Pro 11 2024 (16GB + 2TB) has a higher user score than the average tablet (9.24 vs 8.000).
    9.24 vs 8
  • 86.6% more popular
    Apple iPad Pro 11 2024 (16GB + 2TB) is more popular than the average tablet (8.97 vs 4.8).
    8.97 vs 4.81
  • More capable chipset
    This tablet uses the Apple M4 chipset, while the average tablet uses MediaTek MT8169A.
    Apple M4 vs MediaTek MT8169A
  • Faster storage type
    This tablet uses NVMe storage, while the average tablet uses eMMC. Storage technology still varies widely across tablets.
    NVMe vs eMMC
  • 32x more storage
    This tablet has more internal storage than the average tablet (2 TB vs 64 GB). The average tablet provides 64 GB of internal storage.
    2 TB vs 64 GB
  • 2.2x higher CPU speed
    This tablet has a higher CPU speed than the average tablet (4.4 GHz vs 2 GHz). The average tablet has CPU speed of 2 GHz.
    4.4 GHz vs 2 GHz
  • Better GPU
    This tablet uses the Apple GPU (10-core graphics) GPU, while the average tablet uses Mali-G51. GPU choice is one of the main performance differences between tablets.
    Apple GPU (10-core graphics) vs Mali-G51
  • 12 GB more RAM
    This tablet has more RAM capacity than the average tablet (16 GB vs 4 GB). The average tablet has 4 GB of RAM.
    16 GB vs 4 GB
  • 7.75x higher Geekbench 6 multi-core benchmark score
    This tablet achieves a higher Geekbench 6 multi-core benchmark score than the average tablet (14647 points vs 1891 points). The average tablet scores 1891 points in Geekbench 6 multi-core.
    14,647 points vs 1,891 points
  • 5.08x higher Geekbench 6 single-core benchmark score
    This tablet achieves a higher Geekbench 6 single-core benchmark score than the average tablet (3700 points vs 729 points). The average tablet scores 729 points in Geekbench 6 single-core.
    3,700 points vs 729 points
  • 8.05x higher memory bandwidth
    This tablet has a higher memory bandwidth than the average tablet (120 GB/s vs 14.9 GB/s). The average tablet has memory bandwidth of 14.9 GB/s.
    120 GB/s vs 14.9 GB/s
  • 4 more CPU threads
    This tablet has more CPU threads than the average tablet (10 vs 6). The average tablet has 6 CPU threads.
    10 vs 6
  • Newer DDR memory version
    This tablet supports a newer DDR version than the average tablet (LPDDR5X vs LPDDR3). The average DDR version is LPDDR3.
    LPDDR5X vs LPDDR3
  • 78.6% smaller process node
    This tablet uses a smaller process node than the average tablet (3 nm vs 14 nm). The average tablet uses a process node of 14 nm.
    3 nm vs 14 nm
  • 4,534 MHz faster RAM speed
    This tablet has a higher RAM speed than the average tablet (6400 MHz vs 1866 MHz). The average tablet has RAM speed of 1866 MHz.
    6,400 MHz vs 1,866 MHz
  • 2.15x faster GPU clock
    This tablet has a higher GPU frequency than the average tablet (1400 MHz vs 650 MHz). The average tablet has GPU frequency of 650 MHz.
    1,400 MHz vs 650 MHz
  • 156 more GPU execution units
    This tablet has more GPU execution units than the average tablet (160 vs 4). The average tablet has 4 GPU execution units.
    160 vs 4
  • Includes neural engine
    This tablet includes a neural engine, the average tablet does not. 25.7% of tablets include a neural engine.
  • 2x higher refresh rate
    This tablet has a higher refresh rate than the average tablet (120 Hz vs 60 Hz). The average tablet has refresh rate of 60 Hz.
    120 Hz vs 60 Hz
  • 1,199 nits higher peak brightness
    This tablet has a higher peak brightness than the average tablet (1600 nits vs 401 nits). The average tablet reaches 401 nits peak brightness.
    1,600 nits vs 401 nits
  • Better display type
    This tablet features a better display type than the average tablet (OLED/AMOLED vs IPS LCD). The average tablet uses IPS LCD display technology.
    OLED/AMOLED vs IPS LCD
  • 600 nits higher typical brightness
    This tablet has a higher typical brightness than the average tablet (1000 nits vs 400 nits). The average tablet reaches 400 nits typical brightness.
    1,000 nits vs 400 nits
  • Higher contrast ratio
    This tablet has a higher contrast ratio than the average tablet (2,000,000:1 vs 1015:1). The average tablet contrast ratio is 1015:1.
    2,000,000:1 vs 1,015:1
  • Supports adaptive refresh rate
    This tablet has adaptive refresh rate, the average tablet does not. 17.6% of tablets support adaptive refresh rate.
  • Wider color gamut
    This tablet supports a wider color gamut than the average tablet (DCI-P3 vs sRGB). The average tablet covers sRGB color gamut.
    DCI-P3 vs sRGB
  • Higher screen resolution
    This tablet has a higher screen resolution than the average tablet (2420×1668 vs 1920×1200). The average tablet resolution is 1920×1200.
    2420×1668 vs 1920×1200
  • Includes anti-reflection coating
    This tablet has anti-reflection coating, the average tablet does not. 24.7% of tablets use anti-reflection coating.
  • 0.9 inches larger screen size
    This tablet has a higher screen size than the average tablet (11 inches vs 10.1 inches). The average tablet has screen size of 10.1 inches.
    11 inches vs 10.1 inches
  • 17.9% higher pixel density
    This tablet has a higher pixel density than the average tablet (264 ppi vs 224 ppi). The average tablet has pixel density of 224 ppi.
    264 ppi vs 224 ppi
  • Supports HDR10+ support
    This tablet supports HDR10+, the average tablet does not. 8% of tablets include HDR10+ support.
  • Supports HDR10 support
    This tablet supports HDR10, the average tablet does not. 21.8% of tablets are HDR10 compatible.
  • 480 Hz higher PWM dimming frequency
    This tablet has a higher PWM dimming frequency than the average tablet (480 Hz vs 0 Hz). The average tablet has PWM dimming frequency of 0 Hz.
    480 Hz vs 0 Hz
  • 43 ppi higher screen sharpness
    This tablet has a higher screen sharpness than the average tablet (264 ppi vs 221 ppi). The average tablet has screen sharpness of 221 ppi.
    264 ppi vs 221 ppi
  • Better main-camera video
    This tablet supports better main-camera video recording than the average tablet (2160x60 fps vs 1080x30 fps). The average tablet supports 1080x30 fps main-camera video recording.
    2160x60 fps vs 1080x30 fps
  • 7 MP higher front camera megapixels
    This tablet has more front camera megapixels than the average tablet (12 MP vs 5 MP). The average tablet has 5 MP front camera resolution.
    12 MP vs 5 MP
  • Wider main camera aperture
    This tablet has a better main camera aperture than the average tablet (f/1.8 vs f/2.2). The average tablet uses f/2.2 main camera aperture.
    f/1.8 vs f/2.2
  • Supports PDAF
    This tablet supports PDAF, the average tablet does not. 28.1% of tablets support PDAF.
  • 4 MP higher main camera megapixels
    This tablet has a higher main camera resolution than the average tablet (12 MP vs 8 MP). The average tablet main camera has 8 MP megapixels.
    12 MP vs 8 MP
  • Allows manual focus
    This tablet allows manual focus control, the average tablet does not. 37.2% of tablets include manual focus.
  • Wider front camera aperture
    This tablet has a better front camera aperture than the average tablet (f/2 vs f/2.2). The average tablet uses f/2.2 front camera aperture.
    f/2.0 vs f/2.2
  • Supports slow-motion recording
    This tablet supports slow-motion recording, the average tablet does not. 37.5% of tablets offer slow-mo.
  • Includes flash
    This tablet features a built-in flash, the average tablet does not. 45.2% of tablets include a flash.
  • Supports fast charging
    This tablet supports fast charging, the average tablet does not. 49.7% of tablets feature fast charging.
  • 94.4% faster charging speed
    This tablet supports faster charging than the average tablet (35 W vs 18 W). The average tablet supports charging speed of 18 W.
    35 W vs 18 W
  • 24% larger battery capacity
    This tablet has a higher battery capacity than the average tablet (8160 mAh vs 6580 mAh). The average tablet battery has capacity of 6580 mAh.
    8,160 mAh vs 6,580 mAh
  • Includes battery health monitoring
    This tablet features battery health monitoring, the average tablet does not. 37% of tablets include battery health tools.
  • Supports 5G connectivity
    This tablet supports 5G connectivity, the average tablet does not. 11.1% of tablets are 5G compatible.
  • Newer USB version
    This tablet supports a newer USB version than the average tablet (USB 4 vs USB 2). The average tablet uses USB USB 2.0.
    USB 4 vs USB 2.0
  • Supports Thunderbolt
    This tablet supports Thunderbolt, the average tablet does not. 2.3% of tablets support Thunderbolt.
  • Supports DisplayPort over USB-C
    This tablet supports DisplayPort over USB-C, the average tablet does not. 21.5% of tablets support DisplayPort over USB-C.
  • Newer Wi-Fi version
    This tablet supports a newer Wi-Fi version than the average tablet (Wi-Fi 6E (802.11ax) vs Wi-Fi 5 (802.11ac)). The average tablet uses Wi-Fi Wi-Fi 5 (802.11ac).
    Wi-Fi 6E (802.11ax) vs Wi-Fi 5 (802.11ac)
  • Supports eSIM
    This tablet supports eSIM, the average tablet does not. 11.5% of tablets support eSIM.
  • Newer Bluetooth version
    This tablet supports a newer Bluetooth version than the average tablet (6 vs 5). The average tablet uses Bluetooth 5.0.
    6.0 vs 5.0
  • More Wi-Fi bands
    This tablet supports more Wi-Fi bands than the average tablet (2.4GHz/5GHz/6GHz vs 2.4GHz/5GHz). The average tablet supports 2.4GHz/5GHz Wi-Fi bands.
    2.4GHz/5GHz/6GHz vs 2.4GHz/5GHz
  • Supports AirPlay
    This tablet supports AirPlay, the average tablet does not. 7.6% of tablets are AirPlay compatible.
  • More advanced operating system
    This tablet has a more advanced operating system than the average tablet (iPadOS vs Android). Operating system choice shapes app support, updates, and ecosystem features.
    iPadOS vs Android
  • Longer update support
    This tablet offers longer update support than the average tablet (long vs medium). The average tablet gets medium of update support.
    long vs medium
  • Includes on-device AI
    This tablet includes on-device AI, the average tablet does not. 28.3% of tablets include on-device AI.
  • Supports live text recognition
    This tablet supports live text recognition, the average tablet does not. 34.9% of tablets can recognize text from images.
  • Includes app tracking protection
    This tablet includes app tracking protection, the average tablet does not. 28.3% of tablets offer app tracking protection.
  • Allows app offloading
    This tablet allows app offloading, the average tablet does not. 26.4% of tablets support app offloading.
  • Supports extra dim mode
    This tablet features extra dim mode, the average tablet does not. 35.4% of tablets support extra diming.
    Reduce White Point accessibility dimming
  • Includes clipboard warnings
    This tablet has clipboard warnings, the average tablet does not. 39.9% of tablets include clipboard warnings.
    paste warning
  • 2.7 mm thinner
    This tablet is thinner than the average tablet (5.3 mm vs 8 mm). The average tablet is 8.0 mm thick.
    5.3 mm vs 8.0 mm
  • Suitable for drawing
    This tablet is suitable for drawing, the average tablet is not. 41% of tablets are suitable for drawing.
  • Supports stylus tilt
    This tablet supports stylus tilt, the average tablet does not. 33.6% of tablets support stylus tilt.
  • 5 newer release date
    This tablet has a newer release date than the average tablet (2024 vs 2019).
    May 2024
    2024 vs 2019
  • 9% lighter
    This tablet is lighter than the average tablet (446 g vs 490 g). The average tablet weighs 490 g.
    446 g vs 490 g
  • 2 more speakers
    This tablet has more speakers than the average tablet (4 vs 2). The average tablet has 2 speakers.
    4 vs 2
  • 3 more microphone/s
    This tablet has more microphones than the average tablet (4 vs 1). The average tablet has 1 microphones.
    4 vs 1
  • Supports Dolby Atmos
    This tablet supports Dolby Atmos, the average tablet does not. 31.5% of tablets support Dolby Atmos.
  • Supports Bluetooth LE Audio
    This tablet supports Bluetooth LE Audio, the average tablet does not. 11.5% of tablets support Bluetooth LE Audio.
  • No 3.5 mm headphone jack
    This tablet does not have a 3.5 mm headphone jack, the average tablet does. 72.9% of tablets include a headphone jack.
  • 7.92x more expensive
    Apple iPad Pro 11 2024 (16GB + 2TB) is more expensive than the average tablet (£2,060 vs £260).
    £2,060 vs £260
  • No multi-user mode
    User score
    9.2/ 10
    ✕
    What it is
    A rating that combines user reviews and the total number of reviews received by the smartphone
    When it matters
    When you want to know how a smartphone handles daily tasks and how reliable it remains over time according to user feedback.
    Score distribution
    ▼
    ▼
    <55-66-77-88-99-10
    Apple iPad Pro 11 2024
    the average tablet
    Apple iPad Pro 11 2024 (16GB + 2TB) does not support multi-user mode, the average tablet does. 73.6% of tablets allow multiple user profiles.
  • 49.7 mm taller
    This tablet is taller than the average tablet (249.7 mm vs 200 mm). The average tablet is 200.0 mm tall.
    249.7 mm vs 200.0 mm
  • 8.1% worse value for money
    Apple iPad Pro 11 2024 (16GB + 2TB) has worse value for money than the average tablet (6.57 vs 7.1).
    6.57 vs 7.1
  • 7.92x more expensive
    Apple iPad Pro 11 2024 (16GB + 2TB) is more expensive than the average tablet (£2,060 vs £260).
    £2,060 vs £260
  • 8.1% worse value for money
    Apple iPad Pro 11 2024 (16GB + 2TB) has worse value for money than the average tablet (6.57 vs 7.1).
    6.57 vs 7.1
  • No multi-user mode
    User score
    9.2/ 10
    ✕
    What it is
    A rating that combines user reviews and the total number of reviews received by the smartphone
    When it matters
    When you want to know how a smartphone handles daily tasks and how reliable it remains over time according to user feedback.
    Score distribution
    ▼
    ▼
    <55-66-77-88-99-10
    Apple iPad Pro 11 2024
    the average tablet
    Apple iPad Pro 11 2024 (16GB + 2TB) does not support multi-user mode, the average tablet does. 73.6% of tablets allow multiple user profiles.
  • 49.7 mm taller
    This tablet is taller than the average tablet (249.7 mm vs 200 mm). The average tablet is 200.0 mm tall.
    249.7 mm vs 200.0 mm
  • No 3.5 mm headphone jack
    This tablet does not have a 3.5 mm headphone jack, the average tablet does. 72.9% of tablets include a headphone jack.

Video reviews

Hands-on testing, unboxing, and real-world video evaluations

Expert reviews

In-depth analysis and verdict from leading tech publications

T
theguardian.com
15/05/2024
Summary of the review
T
techadvisor.com
15/11/2024
Summary of the review
U
uk.pcmag.com
22/05/2024
Summary of the review
T
tomsguide.com
24/10/2024
Summary of the review
I
independent.co.uk
15/05/2024
Summary of the review
T
trustedreviews.com
11/06/2024
Summary of the review
I
ign.com
19/06/2024
Summary of the review
A
avforums.com
21/09/2024
Summary of the review
X
xda-developers.com
13/05/2024
Summary of the review
I
imore.com
13/05/2024
Summary of the review
F
forbes.com
13/05/2024
Summary of the review
C
creativebloq.com
16/07/2024
Summary of the review
P
pcmag.com
22/05/2024
Summary of the review
T
telegraph.co.uk
02/05/2025
Summary of the review
T
theverge.com
13/05/2024
Summary of the review
W
wired.com
13/05/2024
Summary of the review
T
tweakers.net
02/08/2025
Summary of the review
I
icreatemagazine.nl
24/05/2024
Summary of the review
N
nl.ign.com
09/09/2024
Summary of the review
T
tweakers.net
24/05/2024
Summary of the review

Third-party reviews

Based on 975 buyer reviews from online shops.
Reviews last updated: May 2026 · How we calculate this
Based on 219 buyer reviews from online shops.
Reviews last updated: May 2026 · How we calculate this
Based on 97 buyer reviews from online shops.
Reviews last updated: May 2026 · How we calculate this
Based on 734 buyer reviews from online shops.
Reviews last updated: May 2026 · How we calculate this

What we like about Apple iPad Pro 11 2024 (16GB + 2TB)

  • Tandem OLED display provides industry-leading brightness, deep blacks, and exceptional contrast.
  • Incredibly thin and lightweight design makes it more portable and comfortable to hold than previous generations.
  • M4 chip offers unparalleled performance, easily handling intensive creative tasks like video editing and 3D rendering.
  • Landscape-oriented front camera improves the video calling experience when used with a keyboard.
  • Strong battery life that often exceeds Apple's 10-hour claim in standard web-surfing tests.

What we don't like about Apple iPad Pro 11 2024 (16GB + 2TB)

  • High starting price that increases significantly with storage upgrades and essential accessories.
  • iPadOS continues to limit the device's potential, lacking the advanced window and file management of a full desktop OS.
  • Removal of the ultra-wide rear camera, leaving only a single standard lens.
  • Lack of compatibility with older Apple Pencils and Magic Keyboards, forcing returning users to buy new peripherals.
  • No built-in kickstand, making it dependent on expensive cases for propped-up use.
  • Speakers may have slightly less audio fidelity than previous models due to the thinner chassis.

Verdict

The 2024 11-inch Apple iPad Pro is a high-performance tablet featuring the powerful M4 chip with a 10-core CPU and 16GB of RAM in its 2TB storage configuration. It boasts a breakthrough Ultra Retina XDR display using tandem OLED technology for up to 1600 nits peak brightness, 120Hz ProMotion, and an optional nano-texture glass for reduced glare. Key advantages include an ultra-thin 5.3mm design, a relocated landscape 12MP front camera with Face ID, and a Thunderbolt/USB 4 port for 40Gb/s transfer speeds. However, notable drawbacks include the device's extreme price point, the removal of the ultra-wide rear camera lens, and the ongoing limitations of iPadOS for complex laptop-style multitasking.

Compare Apple iPad Pro 11 2024 (16GB + 2TB) with other tablets

1Product to compare no. 1
VS
2Product to compare no. 2
VS
3Product to compare no. 3 (optional)

Graphic comparison of Apple iPad Pro 11 2024 (16GB + 2TB) and other tablets

No results found