Scored using Projectors Methodology v3.0
Projectors Methodology v3.0
Mathematical & Unbiased Scoring
Products in this category are scored under Frontum Projectors Methodology v3.0: the technical score from the specifications is the base, and independent expert and video reviews (up to ±0.5 points), owner opinions (up to ±0.3) and best-of lists (up to +0.3) move it up or down.
Explore Projectors Methodology v3.0

BenQ TK710STi review: 86 specs compared

Avg. price:~£1,500Native panel resolution:2716x1528ANSI lumens:3200Throw ratio:0.69-0.83:1Lamp life:20000 hours

BenQ TK710STi Review: Compare 86 technical specifications, 8 expert and video reviews and 3 best-of lists to see how this product ranks in the Projectors category and whether it is worth buying.
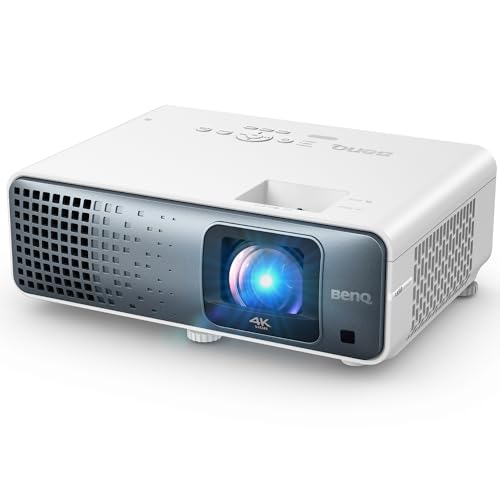
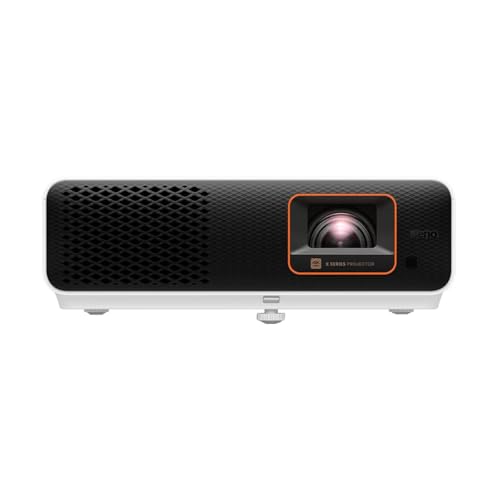
BenQ TK710STi
8.1/10

Overall score

Score
8.1/ 10
✕
What it is
Our main score for this model, 1–10. It combines specs, best-of lists, expert reviews and owners.
How we count it
Parts: Technical score 35%, List score 30%, Reviews score 25%, Sentiment score 10%
Marks: Each part gets a mark out of 10. For reviews, lists and owners, a typical model in this category gets about 8 and the best one gets 10.
No data yet: A part with no data shows "?". It counts as the mark of a weaker model in this category (4 in 5 models with data score higher). This way, models with reviews, lists and owners usually come out ahead.
Score distribution
▼
<55-66-77-88-99-10
Score components

35%

7.6

Technical score

30%

8.3

List score

25%

8.6

Reviews score

10%

8.2

Sentiment score

★Better than 96% of projectors
6.5

Value for money

Value for money
6.5/ 10
✕
What it is
An indicator that combines the projector's overall rating with its cost.
When it matters
When you are looking for a projector with a good balance between quality and price.
Score distribution
▼
<55-66-77-88-99-10
Score components

70%

8.1

Overall score

30%

2.6

Price

▼Worse than 66%
7.6

Technical score

Technical score
7.6/ 10
✕
What it is
How good the specs are compared with the other models in this category, 1–10.
How we count it
Areas: We rate the specs in each area against the other models in this category.
Weighting: The areas that matter most to buyers count more. The shares are shown under Score components.
Share: The technical score is 35% of the overall score.
Score distribution
▼
<55-66-77-88-99-10
Score components

42%

8.5

Image Quality

22%

5.7

Projection & Lens

12%

8.0

HDMI & Gaming

10%

6.9

Audio & Features

8%

8.6

Connectivity

6%

7.6

Design & Power

▲Better than 89%
8.6

Reviews score

Reviews score
8.6/ 10
✕
What it is
Average grade from independent test sites, magazines and video reviewers, 1–10.
How we count it
Grades: Each review's own score is converted to 1–10; without one, we grade the review ourselves. Big test sites count more, short reviews half as much as full tests. A video review counts half.
Score: The average grade is 80% of the review mark; the number of reviews is the other 20% (1 review = 5, the typical number in this category = 8, the most-reviewed model = 10).
Enough data: With few reviews, the average grade is pulled toward the typical grade of this category. No reviews yet: 7.8 for now.
Share: Reviews count 25% of the overall score.
Score distribution
▼
<55-66-77-88-99-10

80%

8.7

Average grade

20%

8.1

Popularity

Grades by review (8)
4 reviews: 1 with a printed score, 3 estimated from the review. 4 video reviews, each counting half as much as a written test. Reviews count 25% of the overall score.
User ratings collected online are not part of this score.
▲Better than 78%
8.3

List score

List score
8.3/ 10
✕
What it is
How often independent test sites, magazines and video reviewers put this model in their best-of lists for this category.
How we count it
Points: The model in the most lists of this category gets 10; the others get 8 to 10 in proportion. In no list yet: 7.5. Lists count 30% of the overall score.
Enough data: Every list counts, even a single one. With fewer than 5 best-of lists in the category, this part is left out.
Lists with this model (3)
List score: in 3 of 103 lists (3%)
★Better than 91%
  • benq-tk710sti
  • benq-tk710sti
  • benq-tk710sti
  • benq-tk710sti
  • benq-tk710sti
  • benq-tk710sti
  • benq-tk710sti
  • benq-tk710sti
benq-tk710sti
benq-tk710sti
benq-tk710sti
benq-tk710sti
benq-tk710sti
benq-tk710sti
benq-tk710sti
benq-tk710sti
Where to buy
*As an Amazon Associate, we earn from qualifying purchases.

What reviewers say about the BenQ TK710STi

Based on 5 · 4

The short throw, Android TV and gaming win praise, but colors, sharpness and the remote draw complaints.
Praised
Mixed views
Criticised
Pick a topic to see who said what
Loading...
Loading category ranking...

Technical Specifications of projector BenQ TK710STi

Technical score
Technical score
7.6/ 10
✕
What it is
How good the specs are compared with the other models in this category, 1–10.
How we count it
Areas: We rate the specs in each area against the other models in this category.
Weighting: The areas that matter most to buyers count more. The shares are shown under Score components.
Share: The technical score is 35% of the overall score.
Score distribution
▼
<55-66-77-88-99-10
Score components:

42%

8.5

Image Quality

22%

5.7

Projection & Lens

12%

8.0

HDMI & Gaming

10%

6.9

Audio & Features

8%

8.6

Connectivity

6%

7.6

Design & Power

7.6
Reviews score
8.6
List score
8.3
Value for money
Value for money
6.5/ 10
✕
What it is
An indicator that combines the projector's overall rating with its cost.
When it matters
When you are looking for a projector with a good balance between quality and price.
Score distribution
▼
<55-66-77-88-99-10
Score components:

70%

8.1

Overall score

30%

2.6

Price

6.5
ANSI lumens
3,200
This projector reaches 3,200 ANSI lumens, brighter than 72% of projectors and equal to 2.8% of projectors.
Contrast ratio
600,000:1
This projector has a contrast ratio of 600000:1, higher than 84.4% of projectors and equal to 0.9% of projectors.
Dynamic contrast ratio.
Native panel resolution
2716x1528
This projector uses a native resolution of 2716x1528, higher than 89.2% of projectors and equal to 1.8% of projectors.
Uses XPR pixel-shifting for 4K output.
Output resolution
3840x2160
This projector supports output resolution up to 3840x2160, higher than 71.2% of projectors and equal to 24.6% of projectors.
Projection technology
DLP
Show more
What reviewers say
Throw ratio
0.69-0.83:1
Min throw distance
?
Max projection size
300 inch
This projector supports projection sizes up to 300 inch, larger than 51.5% of projectors and equal to 38% of projectors.
Zoom ratio
1.2
This projector offers a zoom ratio of 1.2, narrower than 59.8% of projectors and equal to 21.6% of projectors.
Motorized zoom
no
This projector does not have motorised zoom. 14.8% of projectors offer this.
Show more
What reviewers say
Input lag
4.2 ms
This projector has input lag of 4.2 ms, lower than 92.2% of projectors and equal to 4.9% of projectors.
In 1080P.
Auto low latency mode (ALLM)
yes
This projector switches to low-latency mode automatically for games. 84.1% of projectors offer this.
Variable refresh rate (VRR)
no
This projector does not support variable refresh rate. 1.8% of projectors offer this.
HDMI version
2
This projector supports HDMI 2, more modern than 46.1% of projectors and equal to 35.9% of projectors.
Max HDMI bandwidth
18 Gbps
This projector supports HDMI bandwidth up to 18 Gbps, higher than 48.9% of projectors and equal to 39.7% of projectors.
Show more
What reviewers say
N. of HDMI ports
2
This projector has 2 HDMI port/s, more than 45.9% of projectors and equal to 47.3% of projectors.
Wi-Fi connectivity
yes
This projector connects to Wi-Fi networks for streaming. 46.7% of projectors offer this.
Wi-Fi via included Android TV dongle.
Wi-Fi version
?
Bluetooth connectivity
yes
This projector supports Bluetooth for speakers and headphones. 49.4% of projectors offer this.
Bluetooth via included Android TV dongle.
Bluetooth version
5
This projector supports Bluetooth 5, more modern than 62.4% of projectors and equal to 17.1% of projectors.
Bluetooth via included Android TV dongle.
Show more
Smart TV features
yes
This projector has built-in smart TV features. 56.2% of projectors offer this.
Android TV via included dongle.
Operating system
Android
Android OS
yes
This projector runs Android OS. 81% of projectors run Android OS.
Dedicated smartphone app
yes
This projector comes with a dedicated smartphone app. 63.3% of projectors come with a dedicated smartphone app.
BenQ Smart Control app.
Remote control
yes
This projector includes a remote control. 1.5% of projectors offer this.
Show more
What reviewers say
Light source type
laser
This projector uses laser light source technology, more advanced than 75.4% of projectors and equal to 24.6% of projectors.
Laser light source
yes
This projector has a laser light source. 73.3% of projectors offer this.
Lamp life
20,000 hours
This projector offers lamp life of 20,000 hours, shorter than 35.2% of projectors and equal to 25.8% of projectors.
Laser light source life.
Lamp life (eco mode)
20,000 hours
This projector offers eco-mode lamp life of 20,000 hours, shorter than 39.4% of projectors and equal to 17.9% of projectors.
Eco mode rating.
Operating power consumption
275 W
This projector uses 275 W of power, more than 61.7% of projectors and equal to 0.6% of projectors.
Show more
What reviewers say

BenQ TK710STi vs the average projector

246810TotalImage QualityProjection & LensHDMI & GamingConnectivityAudio & FeaturesDesign & Power
  • Higher contrast ratio
    This projector has a higher contrast ratio than the average projector (600000:1 vs 10000:1). The average projector has 10000:1 of contrast ratio.
    Dynamic contrast ratio.
    600,000:1 vs 10,000:1
  • Higher output resolution
    This projector supports a higher output resolution than the average projector (3840x2160 vs 1920x1080). The average projector outputs at 1920x1080 resolution.
    3840x2160 vs 1920x1080
  • High native resolution
    This projector has a higher native panel resolution than the average projector (2716x1528 vs 1920x1080). The average projector has a native panel resolution of 1920x1080.
    Uses XPR pixel-shifting for 4K output.
    2716x1528 vs 1920x1080
  • 45.5% brighter image
    This projector has higher ANSI lumens than the average projector (3,200 vs 2,200). The average projector has 2,200 ANSI lumens.
    3,200 vs 2,200
  • 2.82x higher refresh rate
    This projector has a higher refresh rate than the average projector (240 Hz vs 85 Hz). The average projector has 85 Hz of refresh rate.
    240 Hz vs 85 Hz
  • Supports auto low-latency mode
    This projector switches to low-latency mode automatically, while the average projector does not. 16% of projectors offer this.
  • Supports pixel shifting
    This projector supports pixel shifting, while the average projector does not. 26.6% of projectors support pixel shifting.
    Via XPR technology.
  • 22.8 ms lower input lag
    This projector has a lower input lag than the average projector (4.2 ms vs 27 ms). The average projector has 27 ms of input lag.
    In 1080P.
    4.2 ms vs 27 ms
  • 16.2% higher review score
    Reviews score
    8.6/ 10
    ✕
    What it is
    Average grade from independent test sites, magazines and video reviewers, 1–10.
    How we count it
    Grades: Each review's own score is converted to 1–10; without one, we grade the review ourselves. Big test sites count more, short reviews half as much as full tests. A video review counts half.
    Score: The average grade is 80% of the review mark; the number of reviews is the other 20% (1 review = 5, the typical number in this category = 8, the most-reviewed model = 10).
    Enough data: With few reviews, the average grade is pulled toward the typical grade of this category. No reviews yet: 7.8 for now.
    Share: Reviews count 25% of the overall score.
    Score distribution
    ▼
    <55-66-77-88-99-10

    80%

    8.7

    Average grade

    20%

    8.1

    Popularity

    Grades by review (8)
    4 reviews: 1 with a printed score, 3 estimated from the review. 4 video reviews, each counting half as much as a written test. Reviews count 25% of the overall score.
    User ratings collected online are not part of this score.
    8.6 vs 7.4
  • 9.2% higher list score
    List score
    8.3/ 10
    ✕
    What it is
    How often independent test sites, magazines and video reviewers put this model in their best-of lists for this category.
    How we count it
    Points: The model in the most lists of this category gets 10; the others get 8 to 10 in proportion. In no list yet: 7.5. Lists count 30% of the overall score.
    Enough data: Every list counts, even a single one. With fewer than 5 best-of lists in the category, this part is left out.
    Lists with this model (3)
    List score: in 3 of 103 lists (3%)
    8.3 vs 7.6
  • Higher contrast ratio
    This projector has a higher contrast ratio than the average projector (600000:1 vs 10000:1). The average projector has 10000:1 of contrast ratio.
    Dynamic contrast ratio.
    600,000:1 vs 10,000:1
  • Higher output resolution
    This projector supports a higher output resolution than the average projector (3840x2160 vs 1920x1080). The average projector outputs at 1920x1080 resolution.
    3840x2160 vs 1920x1080
  • High native resolution
    This projector has a higher native panel resolution than the average projector (2716x1528 vs 1920x1080). The average projector has a native panel resolution of 1920x1080.
    Uses XPR pixel-shifting for 4K output.
    2716x1528 vs 1920x1080
  • 45.5% brighter image
    This projector has higher ANSI lumens than the average projector (3,200 vs 2,200). The average projector has 2,200 ANSI lumens.
    3,200 vs 2,200
  • 2.82x higher refresh rate
    This projector has a higher refresh rate than the average projector (240 Hz vs 85 Hz). The average projector has 85 Hz of refresh rate.
    240 Hz vs 85 Hz
  • Supports pixel shifting
    This projector supports pixel shifting, while the average projector does not. 26.6% of projectors support pixel shifting.
    Via XPR technology.
  • 0.18 inch larger DMD chip
    This projector has a higher DMD chip size than the average projector (0.7 inch vs 0.47 inch). The average projector has 0.47 inch of DMD chip size.
    0.65 inch vs 0.47 inch
  • Supports HLG
    This projector supports HLG, while the average projector does not. 41.2% of projectors support HLG.
  • 3 more recent release
    This projector was released more recently than the average projector (2024 vs 2021). The average projector was released in 2021.
    June 2024
    2,024 vs 2,021
  • 50 inch larger image size
    This projector has a higher projection size than the average projector (300 inch vs 250 inch). The average projector has 250 inch of projection size.
    300 inch vs 250 inch
  • Supports auto low-latency mode
    This projector switches to low-latency mode automatically, while the average projector does not. 16% of projectors offer this.
  • 22.8 ms lower input lag
    This projector has a lower input lag than the average projector (4.2 ms vs 27 ms). The average projector has 27 ms of input lag.
    In 1080P.
    4.2 ms vs 27 ms
  • Supports HDMI ARC
    This projector supports HDMI ARC, while the average projector does not. 35.2% of projectors support HDMI ARC.
  • Built-in Chromecast
    This projector supports built-in Chromecast, while the average projector does not. 24.9% of projectors support built-in Chromecast.
    Via included Android TV dongle.
  • Supports AirPlay
    This projector supports AirPlay, while the average projector does not. 40.3% of projectors offer this.
    Via included Android TV dongle.
  • Supports Miracast mirroring
    This projector supports Miracast, while the average projector does not. 46.4% of projectors offer this.
  • Supports smart TV apps
    This projector has built-in smart TV features, while the average projector does not. 43.9% of projectors offer smart TV features.
    Android TV via included dongle.
  • Supports Dolby Atmos
    This projector supports Dolby Atmos, while the average projector does not. 14.1% of projectors support Dolby Atmos.
    Via eARC pass-through.
  • Smartphone app support
    This projector supports smartphone app control, while the average projector does not. 36.7% of projectors support smartphone app control.
    BenQ Smart Control app.
  • Android OS built-in
    This projector features Android OS, while the average projector does not. 19.1% of projectors feature Android OS.
  • Laser light source
    This projector has a laser light source, while the average projector does not. 26.7% of projectors have one.
  • Limited HDMI format
    This projector supports a less capable max HDMI input format than the average projector (4K/60Hz vs 4K/120Hz). The average projector supports a max HDMI input format of 4K/120Hz.
    4K/60Hz vs 4K/120Hz
  • No sleep timer
    This projector does not have a sleep timer, while the average projector does. 82.4% of projectors have one.
  • 50% weaker audio output
    This projector has a lower audio output power than the average projector (5 W vs 10 W). The average projector has 10 W of audio output power.
    5 W vs 10 W
  • 0.1 2x narrower zoom range
    This projector has a lower zoom ratio than the average projector (1.2 vs 1.3). The average projector has 1.3 of zoom ratio.
    1.2 vs 1.3
  • Narrower color gamut
    This projector has a lower color gamut coverage than the average projector (95% Rec.709 % vs 99% Rec.709 %). The average projector has 99% Rec.709 % of color gamut coverage.
    95% Rec.709 % vs 99% Rec.709 %
  • 2.27x more expensive
    BenQ TK710STi is more expensive than the average projector (£1,500 vs £660).
    £1,500 vs £660
  • 103.5 mm thicker body
    This projector is thicker than the average projector (253.5 mm vs 150 mm). The average projector has a thickness of 150 mm.
    253.5 mm vs 150 mm
  • 45 W higher power use
    This projector uses more power than the average projector (275 W vs 230 W). The average projector uses 230 W of power.
    275 W vs 230 W
  • 2.27x more expensive
    BenQ TK710STi is more expensive than the average projector (£1,500 vs £660).
    £1,500 vs £660
  • 7.5% worse value for money
    BenQ TK710STi has a lower value-for-money score than the average projector (6.46 vs 6.9).
    6.46 vs 6.95
  • Narrower color gamut
    This projector has a lower color gamut coverage than the average projector (95% Rec.709 % vs 99% Rec.709 %). The average projector has 99% Rec.709 % of color gamut coverage.
    95% Rec.709 % vs 99% Rec.709 %
  • 0.1 2x narrower zoom range
    This projector has a lower zoom ratio than the average projector (1.2 vs 1.3). The average projector has 1.3 of zoom ratio.
    1.2 vs 1.3
  • Limited HDMI format
    This projector supports a less capable max HDMI input format than the average projector (4K/60Hz vs 4K/120Hz). The average projector supports a max HDMI input format of 4K/120Hz.
    4K/60Hz vs 4K/120Hz
  • No sleep timer
    This projector does not have a sleep timer, while the average projector does. 82.4% of projectors have one.
  • 50% weaker audio output
    This projector has a lower audio output power than the average projector (5 W vs 10 W). The average projector has 10 W of audio output power.
    5 W vs 10 W
  • 103.5 mm thicker body
    This projector is thicker than the average projector (253.5 mm vs 150 mm). The average projector has a thickness of 150 mm.
    253.5 mm vs 150 mm
  • 45 W higher power use
    This projector uses more power than the average projector (275 W vs 230 W). The average projector uses 230 W of power.
    275 W vs 230 W

Video reviews

Hands-on testing, unboxing, and real-world video evaluations

9.0
Technotin
≈ estimated
05/08/2024
Hands-on review · picture, menu, gaming and sound tests
Verdict
The BenQ TK710STi is bright, sharp and well equipped, with only minor drawbacks.
9.0
Carl's Place
≈ estimated
02/08/2024
Real-world test · black levels, colour and golf sim gaming
Verdict
The BenQ TK710STi is worth the upgrade, with a sharp, bright laser picture and strong contrast at a fair price.
9.0
Shane Lee
≈ estimated
09/06/2024
Hands-on review · picture, gaming and 3D tests
Verdict
The BenQ TK710STi performs well for the price, with a bright, vivid picture and plenty of features.
9.0
ProjectorTop
≈ estimated
04/10/2024
Head-to-head comparison · input lag, picture and smart features
Verdict
BenQ TK710STi vs TK710: the TK710 is the better overall projector, and its extra features justify the higher price.
Hands-on video, no verdict

Expert reviews

In-depth analysis and verdict from leading tech publications

9.0
lbtechreviews.com
≈ estimated
12/10/2024
Hands-on review · Short-throw projector
Verdict
The BenQ TK710STi is a compact short-throw projector with low input lag and a 100-inch image from 1.5 m, though it lacks lens shift and its black depth is limited.
9.0
hifitest.de
✓ explicit
01/11/2024
Lab test · Short-throw projector
Verdict
The BenQ TK710STi is a short-throw projector that fills a 2 m wide screen from under 1 m, with Android TV built in and strong gaming.
8.0
auvico.fr
≈ estimated
17/09/2026
Expert review · Short-throw laser
Verdict
The BenQ TK710STi suits a living room where gaming and movies share a big 4K screen, but its built-in speaker needs a soundbar.

Third-party reviews

What customers like about BenQ TK710STi

  • Exceptional low input lag (4ms at 1080p/240Hz), making it ideal for competitive gaming and simulators.
  • High brightness (3,200 ANSI lumens) allows for clear viewing even in rooms with moderate ambient light.
  • Short-throw lens projects large images (e.g., 100 inches) from a very short distance (approx. 1.5 metres).
  • Long-lasting laser light source provides up to 20,000 hours of life with minimal maintenance.
  • True 4K UHD resolution delivers sharp and detailed picture quality for both movies and games.
  • Included Android TV dongle provides easy access to streaming services like Netflix and YouTube.

What customers don't like about BenQ TK710STi

  • Noticeable fan noise, especially in quiet scenes or when sitting close to the unit.
  • Lack of physical lens shift makes precise placement more difficult than on long-throw models.
  • Underwhelming built-in 5W mono speaker lacks depth and immersion for home cinema use.
  • The included remote control is not backlit, making it difficult to use in dark rooms.
  • Some users report 'laser speckle' or high-frequency visual noise inherent to single-laser technology.
  • HDR performance is limited compared to high-end home theatre projectors or OLED TVs.

Verdict

The BenQ TK710STi is a high-performance 4K UHD (3840x2160) short-throw laser projector designed for immersive gaming and home cinema in compact spaces. It features a bright 3200 ANSI lumen output, a 600,000:1 dynamic contrast ratio, and a laser light source rated for 20,000 hours of life. Key characteristics include a short 0.69-0.83 throw ratio capable of projecting a 100-inch image from just 1.5 meters, along with 95% Rec.709 colour coverage and HDR10/HLG support. Its primary advantages are ultra-low input lag—measuring as low as 4.2ms at 1080p/240Hz and 16.7ms at 4K/60Hz—specialised HDR game modes, and integrated Android TV for native 4K streaming. However, its downsides include the lack of optical lens shift, a relatively weak 5W mono speaker, a non-backlit remote, and noticeable fan noise in brighter modes.

Compare BenQ TK710STi with other products in the Projectors category

1Product to compare no. 1
VS
2Product to compare no. 2
VS
3Product to compare no. 3 (optional)

Graphic comparison of BenQ TK710STi and other products in the Projectors category

No results found