Scored using Processors Methodology v3.0
Processors Methodology v3.0
Mathematical & Unbiased Scoring
Products in this category are scored under Frontum Processors Methodology v3.0: the technical score from the specifications is the base, and independent expert and video reviews (up to ±0.5 points), owner opinions (up to ±0.3) and best-of lists (up to +0.3) move it up or down.
Explore Processors Methodology v3.0

AMD Ryzen Threadripper PRO 7995WX review: 74 specs compared

Avg. price:~£8,400PassMark multi-core score:140927N. of physical cores:96CPU boost clock speed:5.1 GHzCPU socket:sTR5TDP (Thermal design power):350 W

AMD Ryzen Threadripper PRO 7995WX Review: Compare 74 technical specifications and 7 expert and video reviews to see how this product ranks in the Processors category and whether it is worth buying.
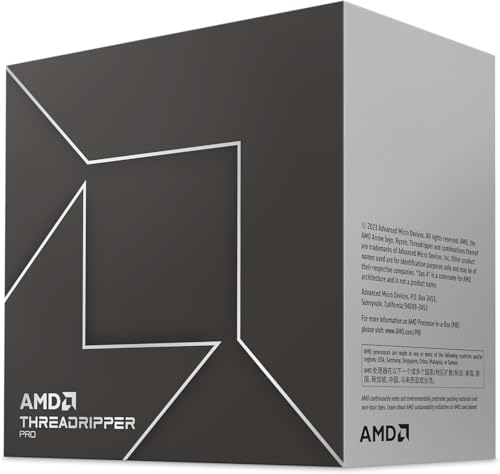
AMD Ryzen Threadripper PRO 7995WX
8.1/10

Overall score

Score
8.1/ 10
✕
What it is
Our main score for this model, 1–10. It combines specs, expert reviews, best-of lists and owners.
How we count it
Parts: Technical score 40%, Reviews score 25%, List score 25%, Sentiment score 10%
Marks: Each part gets a mark out of 10. For reviews, lists and owners, a typical model in this category gets about 8 and the best one gets 10.
No data yet: A part with no data shows "?". It counts as the mark of a weaker model in this category (4 in 5 models with data score higher). This way, models with reviews, lists and owners usually come out ahead.
Score distribution
â–¼
<55-66-77-88-99-10
Score components

40%

8.8

Technical score

25%

8.0

Reviews score

25%

?

List scoreNot enough data yet, so we use 7.5, the mark of a weaker model in this category

10%

?

Sentiment scoreNot enough data yet, so we use 7.0, the mark of a weaker model in this category

★Better than 96% of processors
6.0

Value for money

Value for money
6.0/ 10
✕
What it is
An indicator that combines the processor's overall rating with its cost.
When it matters
When you are looking for a processor with a good balance between performance, efficiency, and price.
Score distribution
â–¼
<55-66-77-88-99-10
Score components

70%

8.1

Overall score

30%

1.0

Price

â–¼Worse than 96%
8.8

Technical score

Technical score
8.8/ 10
✕
What it is
How good the specs are compared with the other models in this category, 1–10.
How we count it
Areas: We rate the specs in each area against the other models in this category.
Weighting: The areas that matter most to buyers count more. The shares are shown under Score components.
Share: The technical score is 40% of the overall score.
Score distribution
â–¼
<55-66-77-88-99-10
Score components

60%

9.5

Performance

18%

8.5

Architecture

10%

8.9

Memory & PCIe

7%

4.5

Power & Thermal

4%

9.0

Platform

1%

4.0

Integrated graphics

★Better than 99%
8.0

Reviews score

Reviews score
8.0/ 10
✕
What it is
Average grade from independent test sites, magazines and video reviewers, 1–10.
How we count it
Grades: Each review's own score is converted to 1–10; without one, we grade the review ourselves. Big test sites count more, short reviews half as much as full tests. A video review counts half.
Score: The average grade is 80% of the review mark; the number of reviews is the other 20% (1 review = 5, the typical number in this category = 8, the most-reviewed model = 10).
Enough data: With few reviews, the average grade is pulled toward the typical grade of this category. No reviews yet: 7.2 for now.
Share: Reviews count 25% of the overall score.
Score distribution
â–¼
<55-66-77-88-99-10

80%

7.9

Average grade

20%

8.4

Popularity

Grades by review (7)
3 reviews: 0 with a printed score, 3 estimated from the review. 4 video reviews, each counting half as much as a written test. Reviews count 25% of the overall score.
User ratings collected online are not part of this score.
â–²Better than 72%
?

List score

List score
7.5/ 10
✕
What it is
How often independent test sites, magazines and video reviewers put this model in their best-of lists for this category.
How we count it
Points: The model in the most lists of this category gets 10; the others get 8 to 10 in proportion. In no list yet: 7.5. Lists count 25% of the overall score.
Enough data: Every list counts, even a single one. With fewer than 5 best-of lists in the category, this part is left out.
Lists with this model (0)
Not in any best-of list yet, so this part counts as 7.5. Models in a list get 8 to 10.
Not in any best-of list yet
  • amd-ryzen-threadripper-pro-7995wx
  • amd-ryzen-threadripper-pro-7995wx
  • amd-ryzen-threadripper-pro-7995wx
  • amd-ryzen-threadripper-pro-7995wx
amd-ryzen-threadripper-pro-7995wx
Where to buy
*As an Amazon Associate, we earn from qualifying purchases.
Best rankings
Available: ranking among products currently available (including other versions of this product).All: ranking among all products in the database.

What reviewers say about the AMD Ryzen Threadripper PRO 7995WX

Based on 3 · 4

Reviewers love the expansion options and heavy multi-core rendering power, but the high power draw is the main sticking point.
Praised
Criticised
Pick a topic to see who said what
Loading...
Loading category ranking...

Technical Specifications of processor AMD Ryzen Threadripper PRO 7995WX

Technical score
Technical score
8.8/ 10
✕
What it is
How good the specs are compared with the other models in this category, 1–10.
How we count it
Areas: We rate the specs in each area against the other models in this category.
Weighting: The areas that matter most to buyers count more. The shares are shown under Score components.
Share: The technical score is 40% of the overall score.
Score distribution
â–¼
<55-66-77-88-99-10
Score components:

60%

9.5

Performance

18%

8.5

Architecture

10%

8.9

Memory & PCIe

7%

4.5

Power & Thermal

4%

9.0

Platform

1%

4.0

Integrated graphics

8.8
Reviews score
8.0
List score
?
Value for money
Value for money
6.0/ 10
✕
What it is
An indicator that combines the processor's overall rating with its cost.
When it matters
When you are looking for a processor with a good balance between performance, efficiency, and price.
Score distribution
â–¼
<55-66-77-88-99-10
Score components:

70%

8.1

Overall score

30%

1.0

Price

6.0
Processor type
workstation
This processor belongs to the workstation processor class, which is more advanced than that of 95.4% of processors and equal to that of 4.6% of processors.
professional workstation
CPU socket
sTR5
This processor uses the sTR5 CPU socket, which is newer than that of 93.6% of processors and equal to that of 1.3% of processors.
Chipset
WRX90, TRX50
This processor supports WRX90, TRX50 chipsets, which is broader compatibility than 99% of processors and equal to that of 1% of processors.
CPU architecture
x86-64
This processor uses the x86-64 architecture, which is more advanced than that of 1.8% of processors and equal to that of 98.2% of processors.
Instruction sets
MMX, SSE, SSE2, SSE3, SSSE3, SSE4A, SSE4.1, SSE4.2, AVX, AVX2, AVX-512, F16C, FMA3, AES, SHA, AMD-V
This processor supports MMX, SSE, SSE2, SSE3, SSSE3, SSE4A, SSE4.1, SSE4.2, AVX, AVX2, AVX-512, F16C, FMA3, AES, SHA, AMD-V instruction sets, which is broader support than 78.4% of processors and equal to that of 2.4% of processors.
Show more
N. of physical cores
96
This processor has 96 CPU cores, which is more than 99.9% of processors and equal to 0.1% of processors.
CPU threads
192
This processor offers 192 CPU threads, which is more than 99.9% of processors and equal to 0.1% of processors.
CPU boost clock speed
5.1 GHz
This processor reaches a boost clock of 5.1 GHz which is higher than that of 84.5% of processors and equal to that of 4.3% of processors.
CPU base clock speed
96x 2.5 GHz
This processor has a base clock of 96x2.5 GHz which is higher than that of 99.9% of processors and equal to that of 0.1% of processors.
PassMark multi-core score
140,927
This processor scores 140,927 in PassMark, which is higher than 99.8% of processors.
Show more
What reviewers say
Semiconductor size
5 nm
This processor uses a 5 nm process node, which is more advanced than that of 83.5% of processors and equal to that of 3.2% of processors.
Foundry
TSMC 5 nm
This processor is built on the TSMC 5 nm foundry process, which is more advanced than that of 83.1% of processors and equal to that of 3.2% of processors.
L3 cache
384 MB
This processor has an L3 cache of 384 MB which is larger than that of 99.9% of processors and equal to that of 0.1% of processors.
L2 cache
96 MB
This processor has an L2 cache of 96 MB which is larger than that of 99.9% of processors and equal to that of 0.1% of processors.
L1 cache
6,144 KB
This processor has an L1 cache of 6,144 KB which is larger than that of 99.8% of processors.
Show more
DDR memory version
DDR5
This processor supports DDR DDR5, which is newer than that of 64.2% of processors and equal to that of 12.8% of processors.
Maximum memory speed
5,200 MHz
This processor supports memory speeds up to 5,200 MHz, which is higher than that of 70.6% of processors and equal to 6.6% of processors.
Max memory speed (JEDEC)
DDR5-5200 MHz
This processor supports JEDEC memory speeds up to DDR5-5200 MHz, which is higher than that of 71% of processors and equal to 5.6% of processors.
Max memory speed (XMP / EXPO)
N/A
Maximum memory capacity
2 GB
This processor supports up to 2 TB of memory, which is more than 98.4% of processors and equal to 1.6% of processors.
Show more
What reviewers say
Integrated graphics
no
This processor does not include integrated graphics. 85.4% of processors offer this.
Integrated GPU model
N/A
Integrated GPU execution units
N/A
Integrated GPU base frequency
N/A
Integrated media encoders/decoders
N/A
Show more
TDP (Thermal design power)
350 W
This processor has a TDP of 350 W which is higher than that of 98.8% of processors and equal to that of 1.2% of processors.
Base power (PL1)
350 W
This processor has a base power of 350 W which is higher than that of 98.8% of processors and equal to that of 1.3% of processors.
Boost power (PL2)
?
Tau (power duration limit)
N/A
Configurable TDP
no
This processor does not support configurable TDP. 53.7% of processors offer this.
Show more
What reviewers say

AMD Ryzen Threadripper PRO 7995WX vs the average processor

246810TotalPlatformPerformanceArchitectureMemory & PCIeIntegrated graphicsPower & Thermal
  • 12.29x higher PassMark score
    This processor has a higher PassMark benchmark score than the average processor (140,927 vs 11,469). The average processor scores 11,469 in PassMark benchmark.
    140,927 vs 11,469
  • 4.71x higher multi-core score
    This processor has a higher Geekbench 6 multi-core score than the average processor (24,514 vs 5,209). The average processor scores 5,209 in Geekbench 6 multi-core.
    24,514 vs 5,209
  • 90 more CPU cores
    This processor has more CPU cores than the average processor (96 vs 6). The average processor has 6 CPU cores.
    96 vs 6
  • 22.29x better multi-core performance
    This processor has a higher multi-core performance than the average processor (62,500 vs 2,804.5). The average processor scores 2,804.5 in Cinebench R20 multi-core.
    62,500 vs 2,804.5
  • 92 more performance cores
    This processor has more performance cores than the average processor (96 vs 4). The average processor has 4 performance cores.
    96 vs 4
  • More advanced microarchitecture
    This processor uses a more advanced microarchitecture than the average processor (Storm Peak vs Kaby Lake).
    Storm Peak vs Kaby Lake
  • 184 more CPU threads
    This processor has more CPU threads than the average processor (192 vs 8). The average processor has 8 CPU threads.
    192 vs 8
  • 76.3% higher single-core score
    This processor has a higher Geekbench 6 single-core score than the average processor (2,706 vs 1,535). The average processor scores 1,535 in Geekbench 6 single-core.
    2,706 vs 1,535
  • 19.4% higher review score
    Reviews score
    8.0/ 10
    ✕
    What it is
    Average grade from independent test sites, magazines and video reviewers, 1–10.
    How we count it
    Grades: Each review's own score is converted to 1–10; without one, we grade the review ourselves. Big test sites count more, short reviews half as much as full tests. A video review counts half.
    Score: The average grade is 80% of the review mark; the number of reviews is the other 20% (1 review = 5, the typical number in this category = 8, the most-reviewed model = 10).
    Enough data: With few reviews, the average grade is pulled toward the typical grade of this category. No reviews yet: 7.2 for now.
    Share: Reviews count 25% of the overall score.
    Score distribution
    â–¼
    <55-66-77-88-99-10

    80%

    7.9

    Average grade

    20%

    8.4

    Popularity

    Grades by review (7)
    3 reviews: 0 with a printed score, 3 estimated from the review. 4 video reviews, each counting half as much as a written test. Reviews count 25% of the overall score.
    User ratings collected online are not part of this score.
    8.0 vs 6.7
  • Modern CPU socket
    This processor uses a more modern CPU socket than the average processor (sTR5 vs FP5).
    sTR5 vs FP5
  • Higher-end processor class
    This processor belongs to a higher-end processor class than the average processor (workstation vs mobile).
    professional workstation
    workstation vs mobile
  • 3 years newer release date
    This processor has a newer release date than the average processor (2023 vs 2020).
    November 2023
    2023 vs 2020
  • 12.29x higher PassMark score
    This processor has a higher PassMark benchmark score than the average processor (140,927 vs 11,469). The average processor scores 11,469 in PassMark benchmark.
    140,927 vs 11,469
  • 4.71x higher multi-core score
    This processor has a higher Geekbench 6 multi-core score than the average processor (24,514 vs 5,209). The average processor scores 5,209 in Geekbench 6 multi-core.
    24,514 vs 5,209
  • 90 more CPU cores
    This processor has more CPU cores than the average processor (96 vs 6). The average processor has 6 CPU cores.
    96 vs 6
  • 22.29x better multi-core performance
    This processor has a higher multi-core performance than the average processor (62,500 vs 2,804.5). The average processor scores 2,804.5 in Cinebench R20 multi-core.
    62,500 vs 2,804.5
  • 92 more performance cores
    This processor has more performance cores than the average processor (96 vs 4). The average processor has 4 performance cores.
    96 vs 4
  • 184 more CPU threads
    This processor has more CPU threads than the average processor (192 vs 8). The average processor has 8 CPU threads.
    192 vs 8
  • 76.3% higher single-core score
    This processor has a higher Geekbench 6 single-core score than the average processor (2,706 vs 1,535). The average processor scores 1,535 in Geekbench 6 single-core.
    2,706 vs 1,535
  • 49.8% better single-core performance
    This processor has a higher PassMark single-core score than the average processor (3,833 vs 2,558). The average processor scores 2,558 in PassMark single-core.
    3,833 vs 2,558
  • Higher base clock
    This processor has a higher base clock than the average processor (96x2.5 GHz vs 4x3.4 GHz).
    96x2.5 GHz vs 4x3.4 GHz
  • 6.12x faster classroom rendering
    This processor has a lower Blender Classroom render time than the average processor (2,82.7 vs 340.1). The average processor needs 340.075 for the Blender Classroom test.
    2,082.73 vs 340.075
  • 15.9% higher boost clock
    This processor has a higher boost clock speed than the average processor (5.1 GHz vs 4.4 GHz). The average processor reaches boost clock speed of 4.4 GHz.
    5.1 GHz vs 4.4 GHz
  • 58.2% higher Cinebench R20 single-core score
    This processor has a higher Cinebench R20 single-core score than the average processor (775 vs 490). The average processor scores 490 in Cinebench R20 single-core.
    775 vs 490
  • Unlocked for overclocking
    This processor has an unlocked multiplier, while the average processor does not. 22.6% of processors offer this.
  • 2x higher bus transfer rate
    This processor has a higher bus transfer rate than the average processor (16 GT/s vs 8 GT/s). The average processor offers bus transfer rate of 8 GT/s.
    16 GT/s vs 8 GT/s
  • More advanced microarchitecture
    This processor uses a more advanced microarchitecture than the average processor (Storm Peak vs Kaby Lake).
    Storm Peak vs Kaby Lake
  • 42.67x larger L3 cache
    This processor has a higher L3 cache than the average processor (384 MB vs 9 MB). The average processor has L3 cache of 9 MB.
    384 MB vs 9 MB
  • 32x larger L2 cache
    This processor has a higher L2 cache than the average processor (96 MB vs 3 MB). The average processor has L2 cache of 3 MB.
    96 MB vs 3 MB
  • 2.16x more L3 per core
    This processor has more L3 cache per core than the average processor (4 MB/core vs 1.85 MB/core). The average processor provides 1.85 MB/core of L3 cache per core.
    4 MB/core vs 1.85 MB/core
  • 16x larger L1 cache
    This processor has a higher L1 cache than the average processor (6,144 KB vs 384 KB). The average processor has L1 cache of 384 KB.
    6,144 KB vs 384 KB
  • 58.3% smaller process node
    This processor has a lower process node than the average processor (5 nm vs 12 nm). The average processor uses a process node of 12 nm.
    5 nm vs 12 nm
  • 15.93x more transistors
    This processor has more transistors than the average processor (78.8 billion vs 4.95 billion). The average processor has 4.95 billion transistors.
    78.84 billion vs 4.95 billion
  • More advanced foundry
    This processor uses a more advanced foundry process than the average processor (TSMC 5 nm vs Intel 14 nm).
    TSMC 5 nm vs Intel 14 nm
  • 2x more L2 per core
    This processor has more L2 cache per core than the average processor (1 MB/core vs 0.5 MB/core). The average processor provides 0.5 MB/core of L2 cache per core.
    1 MB/core vs 0.5 MB/core
  • 132 more PCIe lanes
    This processor has more PCIe lanes than the average processor (148 vs 16). The average processor offers 16 PCIe lanes.
    148 vs 16
  • Newer PCIe version
    This processor supports a newer PCIe version than the average processor (5 vs 3).
    5.0 vs 3.0
  • 32x more memory capacity
    This processor has more maximum memory capacity than the average processor (2 TB vs 64 GB). The average processor supports 64 GB of memory.
    2 TB vs 64 GB
  • 7.1x higher memory bandwidth
    This processor has a higher memory bandwidth than the average processor (332.8 GB/s vs 46.9 GB/s). The average processor offers memory bandwidth of 46.9 GB/s.
    332.8 GB/s vs 46.9 GB/s
  • Supports memory overclocking
    This processor supports memory overclocking, while the average processor does not. 43.9% of processors support memory overclocking.
  • Newer DDR support
    This processor supports a newer DDR generation than the average processor (DDR5 vs DDR4).
    DDR5 vs DDR4
  • 62.5% higher memory speed
    This processor has a higher maximum memory speed than the average processor (5,200 MHz vs 3,200 MHz). The average processor supports memory speed of 3,200 MHz.
    5,200 MHz vs 3,200 MHz
  • Supports ECC memory
    This processor supports ECC memory, while the average processor does not. 32% of processors support it.
  • Higher JEDEC memory speed
    This processor has a higher JEDEC memory speed than the average processor (DDR5-5200 MHz vs DDR4-3200 MHz). The average processor supports JEDEC memory speed of DDR4-3200 MHz.
    DDR5-5,200 MHz vs DDR4-3,200 MHz
  • 5 °C lower CPU temperature
    This processor has a lower CPU temperature than the average processor (95 °C vs 100 °C). The average processor runs at a CPU temperature of 100 °C.
    95 °C vs 100 °C
  • 7.78x higher base power
    This processor has a higher base power draw than the average processor (350 W vs 45 W). The average processor has a base power draw of 45 W.
    350 W vs 45 W
  • No configurable TDP
    This processor does not support configurable TDP, while the average processor does. 53.7% of processors support configurable TDP.
  • 7.01x larger die size
    This processor has a higher die size than the average processor (1,240 mm² vs 177 mm²). The average processor has a die size of 177 mm².
    1,240 mm² vs 177 mm²
  • 7.78x higher TDP
    This processor has a higher TDP than the average processor (350 W vs 45 W). The average processor has a TDP of 45 W.
    350 W vs 45 W
  • Limited PCIe bifurcation
    This processor supports less flexible PCIe bifurcation than the average processor (x8/x8, x4/x4/x4/x4 vs x16, x8/x8, x4/x4/x4/x4).
    x8/x8, x4/x4/x4/x4 vs x16, x8/x8, x4/x4/x4/x4
  • 33.6x more expensive
    AMD Ryzen Threadripper PRO 7995WX is more expensive than the average processor (£8,400 vs £250).
    £8,400 vs £250
  • 5 °C lower temperature limit
    This processor has a lower temperature limit than the average processor (95 °C vs 100 °C). The average processor can run up to 100 °C.
    95 °C vs 100 °C
  • 21.9% worse value for money
    AMD Ryzen Threadripper PRO 7995WX has worse value for money than the average processor (5.98 vs 7.3).
    5.98 vs 7.29
  • 33.6x more expensive
    AMD Ryzen Threadripper PRO 7995WX is more expensive than the average processor (£8,400 vs £250).
    £8,400 vs £250
  • 21.9% worse value for money
    AMD Ryzen Threadripper PRO 7995WX has worse value for money than the average processor (5.98 vs 7.3).
    5.98 vs 7.29
  • Weaker security extensions
    This processor provides less advanced security extensions than the average processor (AES-NI, SHA, NX bit, Memory Guard, Secure Processor, Secure Boot, Shadow Stack, GMET vs AES-NI, NX bit, Secure Key, TXT, OS Guard, Boot Guard, CET, MBEC, TME, TME-MK).
    AES-NI, SHA, NX bit, Memory Guard, Secure Processor, Secure Boot, Shadow Stack, GMET vs AES-NI, NX bit, Secure Key, TXT, OS Guard, Boot Guard, CET, MBEC, TME, TME-MK
  • Older TPM support
    This processor supports an older TPM version than the average processor (fTPM 2 vs PTT 2).
    fTPM 2.0 vs PTT 2.0
  • 7.01x larger die size
    This processor has a higher die size than the average processor (1,240 mm² vs 177 mm²). The average processor has a die size of 177 mm².
    1,240 mm² vs 177 mm²
  • Limited PCIe bifurcation
    This processor supports less flexible PCIe bifurcation than the average processor (x8/x8, x4/x4/x4/x4 vs x16, x8/x8, x4/x4/x4/x4).
    x8/x8, x4/x4/x4/x4 vs x16, x8/x8, x4/x4/x4/x4
  • 6 fewer memory channels
    This processor has fewer memory channels than the average processor (8 vs 2). The average processor supports 2 memory channels.
    8 vs 2
  • No integrated graphics
    This processor does not include integrated graphics, while the average processor does. 85.4% of processors include integrated graphics.
  • 7.78x higher base power
    This processor has a higher base power draw than the average processor (350 W vs 45 W). The average processor has a base power draw of 45 W.
    350 W vs 45 W
  • No configurable TDP
    This processor does not support configurable TDP, while the average processor does. 53.7% of processors support configurable TDP.
  • 7.78x higher TDP
    This processor has a higher TDP than the average processor (350 W vs 45 W). The average processor has a TDP of 45 W.
    350 W vs 45 W
  • 5 °C lower temperature limit
    This processor has a lower temperature limit than the average processor (95 °C vs 100 °C). The average processor can run up to 100 °C.
    95 °C vs 100 °C

Video reviews

Hands-on testing, unboxing, and real-world video evaluations

7.0
Digital Spaceport
≈ estimated
24/08/2024
Build and test · storage, local AI and thermal results
Verdict
AMD Ryzen Threadripper PRO 7995WX is not the best value for most tasks, but a strong choice if you need many GPUs or heavy training.
8.0
WootDini Tech & Tutorials
≈ estimated
25/06/2024
Hands-on review · benchmarks, temperatures and power tests
Verdict
AMD Ryzen Threadripper PRO 7995WX is impressive for the few who can afford and fully use it; most buyers would do better with the 7980X.
9.5
Dave's Garage
≈ estimated
27/11/2023
Hands-on review · benchmarks, compile times and stress tests
Verdict
AMD Ryzen Threadripper PRO 7995WX delivers excellent multi-core performance and fast compiles, making it a top pick for serious professional work.
Not graded
Brand video
Not graded
Hands-on video, no verdict
Not graded
Hands-on video, no verdict

Expert reviews

In-depth analysis and verdict from leading tech publications

6.0
pugetsystems.com
≈ estimated
06/12/2023
Content creation preview · 96-core CPU
Verdict
The AMD Ryzen Threadripper PRO 7995WX is a 96-core chip that excels at CPU rendering, but in Premiere Pro, Photoshop and Unreal Engine, smaller chips often beat it.
9.0
develop3d.com
≈ estimated
12/02/2024
Engineering review · Simulation and rendering
Verdict
The AMD Ryzen Threadripper PRO 7995WX is a 96-core chip for ray-traced rendering, but its 350W power limit caps the gains from its extra cores.
8.0
noobfeed.com
≈ estimated
07/03/2026
Workstation review · Creator benchmarks
Verdict
The AMD Ryzen Threadripper PRO 7995WX is a 96-core chip that dominates rendering, but in Photoshop the Ryzen 9 9950X is about 55% faster.

Third-party reviews

What customers like about AMD Ryzen Threadripper PRO 7995WX

  • Unmatched multi-threaded performance in highly parallel tasks like V-Ray and Blender rendering.
  • Significant generational leap with 96 Zen 4 cores, offering up to 50% better performance than the previous 64-core flagship.
  • Support for 8-channel DDR5 memory and up to 128 PCIe 5.0 lanes, ideal for high-bandwidth professional workflows.
  • Excellent single-core gains over previous generations due to improved boost clocks and architecture.
  • Highly efficient power-to-performance ratio compared to high-end consumer and competitor workstation chips.
  • Ideal for extreme multitasking and heavy simulation workloads (e.g., CFD or code compilation).

What customers don't like about AMD Ryzen Threadripper PRO 7995WX

  • Extremely high MSRP (~$9,999), making it an 'exercise in excess' for all but the most specialized professionals.
  • Diminishing returns in applications that cannot effectively scale to 96 cores, such as Lightroom Classic or Photoshop.
  • Poor performance-per-dollar for lightly-threaded or moderately-threaded content creation tasks.
  • Requires high-end cooling solutions and specific motherboards (WRX90) to reach full potential.
  • Software limitations in Windows can lead to sub-optimal core utilization in certain benchmarks.
  • Niche appeal; many users are better served by the more affordable 32-core or 64-core Threadripper 7000 models.

Verdict

The AMD Ryzen Threadripper PRO 7995WX is a flagship workstation processor built on the Zen 4 architecture, featuring a massive 96 cores and 192 threads. Key specifications include a 2.5 GHz base clock, a 5.1 GHz boost frequency, 384MB of L3 cache, and support for 128 PCIe 5.0 lanes and 8-channel DDR5-5200 ECC memory. Its main pros are unrivaled multi-threaded performance for heavy workloads like 3D rendering and scientific computing, significant IPC gains over the previous generation, and professional-grade manageability features. However, cons include a very high retail price (MSRP around $9,999), a steep 350W TDP that requires high-end cooling, and diminishing returns in software not optimized to scale across such a high core count.

Compare AMD Ryzen Threadripper PRO 7995WX with other processors

1Product to compare no. 1
VS
2Product to compare no. 2
VS
3Product to compare no. 3 (optional)

Graphic comparison of AMD Ryzen Threadripper PRO 7995WX and other processors

No results found