Scored using Processors Methodology v3.0
Processors Methodology v3.0
Mathematical & Unbiased Scoring
Products in this category are scored under Frontum Processors Methodology v3.0: the technical score from the specifications is the base, and independent expert and video reviews (up to ±0.5 points), owner opinions (up to ±0.3) and best-of lists (up to +0.3) move it up or down.
Explore Processors Methodology v3.0

AMD Ryzen Threadripper 3960X review: 74 specs compared

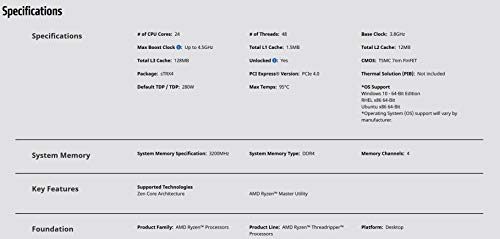
Avg. price:~£1,320PassMark multi-core score:54798N. of physical cores:24CPU boost clock speed:4.5 GHzCPU socket:sTRX4TDP (Thermal design power):280 W

AMD Ryzen Threadripper 3960X Review: Compare 74 technical specifications, 33 expert and video reviews and 2 best-of lists to see how this product ranks in the Processors category and whether it is worth buying.
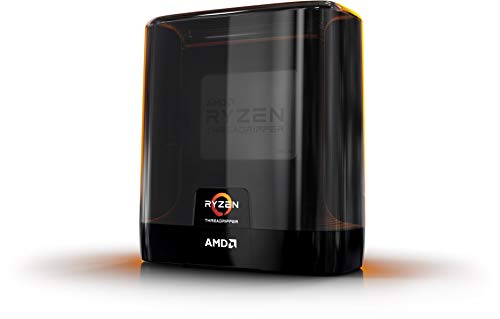
AMD Ryzen Threadripper 3960X
8.0/10

Overall score

Score
8.0/ 10
✕
What it is
Our main score for this model, 1–10. It combines specs, expert reviews, best-of lists and owners.
How we count it
Parts: Technical score 40%, Reviews score 25%, List score 25%, Sentiment score 10%
Marks: Each part gets a mark out of 10. For reviews, lists and owners, a typical model in this category gets about 8 and the best one gets 10.
No data yet: A part with no data shows "?". It counts as the mark of a weaker model in this category (4 in 5 models with data score higher). This way, models with reviews, lists and owners usually come out ahead.
Score distribution
▼
<55-66-77-88-99-10
Score components

40%

7.7

Technical score

25%

8.7

Reviews score

25%

7.7

List score

10%

8.5

Sentiment score

★Better than 95% of processors
6.7

Value for money

Value for money
6.7/ 10
✕
What it is
An indicator that combines the processor's overall rating with its cost.
When it matters
When you are looking for a processor with a good balance between performance, efficiency, and price.
Score distribution
▼
<55-66-77-88-99-10
Score components

70%

8.0

Overall score

30%

3.5

Price

▼Worse than 83%
7.7

Technical score

Technical score
7.7/ 10
✕
What it is
How good the specs are compared with the other models in this category, 1–10.
How we count it
Areas: We rate the specs in each area against the other models in this category.
Weighting: The areas that matter most to buyers count more. The shares are shown under Score components.
Share: The technical score is 40% of the overall score.
Score distribution
▼
<55-66-77-88-99-10
Score components

60%

8.1

Performance

18%

7.1

Architecture

10%

8.2

Memory & PCIe

7%

4.5

Power & Thermal

4%

9.0

Platform

1%

4.0

Integrated graphics

▲Better than 80%
8.7

Reviews score

Reviews score
8.7/ 10
✕
What it is
Average grade from independent test sites, magazines and video reviewers, 1–10.
How we count it
Grades: Each review's own score is converted to 1–10; without one, we grade the review ourselves. Big test sites count more, short reviews half as much as full tests. A video review counts half.
Score: The average grade is 80% of the review mark; the number of reviews is the other 20% (1 review = 5, the typical number in this category = 8, the most-reviewed model = 10).
Enough data: With few reviews, the average grade is pulled toward the typical grade of this category. No reviews yet: 7.2 for now.
Share: Reviews count 25% of the overall score.
Score distribution
▼
<55-66-77-88-99-10

80%

8.5

Average grade

20%

9.5

Popularity

Grades by review (33)
20 reviews: 11 with a printed score, 9 estimated from the review. 13 video reviews, each counting half as much as a written test. Reviews count 25% of the overall score.
User ratings collected online are not part of this score.
★Better than 97%
7.7

List score

List score
7.7/ 10
✕
What it is
How often independent test sites, magazines and video reviewers put this model in their best-of lists for this category.
How we count it
Points: The model in the most lists of this category gets 10; the others get 8 to 10 in proportion. In no list yet: 7.5. Lists count 25% of the overall score.
Enough data: Every list counts, even a single one. With fewer than 5 best-of lists in the category, this part is left out.
Lists with this model (2)
List score: in 2 of 87 lists (2%)
★Better than 94%
  • amd-ryzen-threadripper-3960x
  • amd-ryzen-threadripper-3960x
  • amd-ryzen-threadripper-3960x
  • amd-ryzen-threadripper-3960x
amd-ryzen-threadripper-3960x
Where to buy
*As an Amazon Associate, we earn from qualifying purchases.
Best rankings
Available: ranking among products currently available (including other versions of this product).All: ranking among all products in the database.

What reviewers say about the AMD Ryzen Threadripper 3960X

Based on 10 · 10

Reviewers love its huge multi-core power, but criticise costly, limited motherboards plus high power and heat; gaming views are split.
Praised
Mixed views
Criticised
Pick a topic to see who said what
Loading...
Loading category ranking...

Technical Specifications of processor AMD Ryzen Threadripper 3960X

Technical score
Technical score
7.7/ 10
✕
What it is
How good the specs are compared with the other models in this category, 1–10.
How we count it
Areas: We rate the specs in each area against the other models in this category.
Weighting: The areas that matter most to buyers count more. The shares are shown under Score components.
Share: The technical score is 40% of the overall score.
Score distribution
▼
<55-66-77-88-99-10
Score components:

60%

8.1

Performance

18%

7.1

Architecture

10%

8.2

Memory & PCIe

7%

4.5

Power & Thermal

4%

9.0

Platform

1%

4.0

Integrated graphics

7.7
Reviews score
8.7
List score
7.7
Value for money
Value for money
6.7/ 10
✕
What it is
An indicator that combines the processor's overall rating with its cost.
When it matters
When you are looking for a processor with a good balance between performance, efficiency, and price.
Score distribution
▼
<55-66-77-88-99-10
Score components:

70%

8.0

Overall score

30%

3.5

Price

6.7
Processor type
workstation
This processor belongs to the workstation processor class, which is more advanced than that of 95.4% of processors and equal to that of 4.6% of processors.
CPU socket
sTRX4
This processor uses the sTRX4 CPU socket, which is newer than that of 74.8% of processors and equal to that of 0.2% of processors.
Chipset
TRX40
This processor supports TRX40 chipsets, which is broader compatibility than 97.6% of processors and equal to that of 0.2% of processors.
CPU architecture
x86-64
This processor uses the x86-64 architecture, which is more advanced than that of 1.8% of processors and equal to that of 98.2% of processors.
Instruction sets
MMX, SSE, SSE2, SSE3, SSSE3, SSE4A, SSE4.1, SSE4.2, AVX, AVX2, F16C, FMA3, AES, SHA, CLMUL, BMI1, BMI2, ADX, RDRAND, RDSEED
This processor supports MMX, SSE, SSE2, SSE3, SSSE3, SSE4A, SSE4.1, SSE4.2, AVX, AVX2, F16C, FMA3, AES, SHA, CLMUL, BMI1, BMI2, ADX, RDRAND, RDSEED instruction sets, which is broader support than 99.9% of processors.
Show more
What reviewers say
N. of physical cores
24
This processor has 24 CPU cores, which is more than 96.3% of processors and equal to 2.4% of processors.
CPU threads
48
This processor offers 48 CPU threads, which is more than 98.4% of processors and equal to 0.4% of processors.
CPU boost clock speed
4.5 GHz
This processor reaches a boost clock of 4.5 GHz which is higher than that of 53.9% of processors and equal to that of 5.5% of processors.
CPU base clock speed
24x 3.8 GHz
This processor has a base clock of 24x3.8 GHz which is higher than that of 98.4% of processors and equal to that of 0.1% of processors.
PassMark multi-core score
54,798
This processor scores 54,798 in PassMark, which is higher than 96.4% of processors.
Show more
What reviewers say
Semiconductor size
7 nm
This processor uses a 7 nm process node, which is more advanced than that of 70.4% of processors and equal to that of 10.5% of processors.
Foundry
TSMC 7 nm
This processor is built on the TSMC 7 nm foundry process, which is more advanced than that of 55.6% of processors and equal to that of 9.2% of processors.
L3 cache
128 MB
This processor has an L3 cache of 128 MB which is larger than that of 98% of processors and equal to that of 1.3% of processors.
L2 cache
12 MB
This processor has an L2 cache of 12 MB which is larger than that of 83.1% of processors and equal to that of 2.9% of processors.
L1 cache
1,536 KB
This processor has an L1 cache of 1,536 KB which is larger than that of 94.5% of processors and equal to that of 0.4% of processors.
Show more
DDR memory version
DDR4
This processor supports DDR DDR4, which is newer than that of 25.2% of processors and equal to that of 31.1% of processors.
Maximum memory speed
3,200 MHz
This processor supports memory speeds up to 3,200 MHz, which is higher than that of 49.8% of processors and equal to 8.5% of processors.
Max memory speed (JEDEC)
DDR4-3200 MHz
This processor supports JEDEC memory speeds up to DDR4-3200 MHz, which is higher than that of 46.1% of processors and equal to 9.4% of processors.
Max memory speed (XMP / EXPO)
3,200 MHz
This processor supports XMP/EXPO memory speeds up to 3,200 MHz, which is higher than that of 91.2% of processors and equal to 1.4% of processors.
Maximum memory capacity
256 GB
This processor supports up to 256 GB of memory, which is more than 89% of processors and equal to 8.8% of processors.
Show more
What reviewers say
Integrated graphics
no
This processor does not include integrated graphics. 85.4% of processors offer this.
Integrated GPU model
N/A
Integrated GPU execution units
N/A
Integrated GPU base frequency
N/A
Integrated media encoders/decoders
N/A
Show more
TDP (Thermal design power)
280 W
This processor has a TDP of 280 W which is higher than that of 97.9% of processors and equal to that of 0.8% of processors.
Base power (PL1)
280 W
This processor has a base power of 280 W which is higher than that of 97.9% of processors and equal to that of 0.7% of processors.
Boost power (PL2)
?
Tau (power duration limit)
N/A
Configurable TDP
no
This processor does not support configurable TDP. 53.7% of processors offer this.
Show more
What reviewers say

AMD Ryzen Threadripper 3960X vs the average processor

246810TotalPlatformPerformanceArchitectureMemory & PCIeIntegrated graphicsPower & Thermal
  • 4.78x higher PassMark score
    This processor has a higher PassMark benchmark score than the average processor (54,798 vs 11,469). The average processor scores 11,469 in PassMark benchmark.
    54,798 vs 11,469
  • 18 more CPU cores
    This processor has more CPU cores than the average processor (24 vs 6). The average processor has 6 CPU cores.
    24 vs 6
  • 2.53x higher multi-core score
    This processor has a higher Geekbench 6 multi-core score than the average processor (13,185 vs 5,209). The average processor scores 5,209 in Geekbench 6 multi-core.
    13,185 vs 5,209
  • 4.83x better multi-core performance
    This processor has a higher multi-core performance than the average processor (13,551 vs 2,804.5). The average processor scores 2,804.5 in Cinebench R20 multi-core.
    13,551 vs 2,804.5
  • 20 more performance cores
    This processor has more performance cores than the average processor (24 vs 4). The average processor has 4 performance cores.
    24 vs 4
  • 40 more CPU threads
    This processor has more CPU threads than the average processor (48 vs 8). The average processor has 8 CPU threads.
    48 vs 8
  • 14.22x larger L3 cache
    This processor has a higher L3 cache than the average processor (128 MB vs 9 MB). The average processor has L3 cache of 9 MB.
    128 MB vs 9 MB
  • 72 more PCIe lanes
    This processor has more PCIe lanes than the average processor (88 vs 16). The average processor offers 16 PCIe lanes.
    72 usable lanes
    88 vs 16
  • 29.9% higher review score
    Reviews score
    8.7/ 10
    ✕
    What it is
    Average grade from independent test sites, magazines and video reviewers, 1–10.
    How we count it
    Grades: Each review's own score is converted to 1–10; without one, we grade the review ourselves. Big test sites count more, short reviews half as much as full tests. A video review counts half.
    Score: The average grade is 80% of the review mark; the number of reviews is the other 20% (1 review = 5, the typical number in this category = 8, the most-reviewed model = 10).
    Enough data: With few reviews, the average grade is pulled toward the typical grade of this category. No reviews yet: 7.2 for now.
    Share: Reviews count 25% of the overall score.
    Score distribution
    ▼
    <55-66-77-88-99-10

    80%

    8.5

    Average grade

    20%

    9.5

    Popularity

    Grades by review (33)
    20 reviews: 11 with a printed score, 9 estimated from the review. 13 video reviews, each counting half as much as a written test. Reviews count 25% of the overall score.
    User ratings collected online are not part of this score.
    8.7 vs 6.7
  • 18.1% higher sentiment score
    8.5 vs 7.2
  • Broader instruction support
    This processor supports a broader instruction set than the average processor (MMX, SSE, SSE2, SSE3, SSSE3, SSE4A, SSE4.1, SSE4.2, AVX, AVX2, F16C, FMA3, AES, SHA, CLMUL, BMI1, BMI2, ADX, RDRAND, RDSEED vs MMX, SSE, SSE2, SSE3, SSSE3, SSE4A, SSE4.1, SSE4.2, AVX, AVX2, F16C, FMA3, AES, SHA, AMD-V).
    MMX, SSE, SSE2, SSE3, SSSE3, SSE4A, SSE4.1, SSE4.2, AVX, AVX2, F16C, FMA3, AES, SHA, CLMUL, BMI1, BMI2, ADX, RDRAND, RDSEED vs MMX, SSE, SSE2, SSE3, SSSE3, SSE4A, SSE4.1, SSE4.2, AVX, AVX2, F16C, FMA3, AES, SHA, AMD-V
  • Modern CPU socket
    This processor uses a more modern CPU socket than the average processor (sTRX4 vs FP5).
    sTRX4 vs FP5
  • Higher-end processor class
    This processor belongs to a higher-end processor class than the average processor (workstation vs mobile).
    workstation vs mobile
  • 4.78x higher PassMark score
    This processor has a higher PassMark benchmark score than the average processor (54,798 vs 11,469). The average processor scores 11,469 in PassMark benchmark.
    54,798 vs 11,469
  • 18 more CPU cores
    This processor has more CPU cores than the average processor (24 vs 6). The average processor has 6 CPU cores.
    24 vs 6
  • 2.53x higher multi-core score
    This processor has a higher Geekbench 6 multi-core score than the average processor (13,185 vs 5,209). The average processor scores 5,209 in Geekbench 6 multi-core.
    13,185 vs 5,209
  • 4.83x better multi-core performance
    This processor has a higher multi-core performance than the average processor (13,551 vs 2,804.5). The average processor scores 2,804.5 in Cinebench R20 multi-core.
    13,551 vs 2,804.5
  • 20 more performance cores
    This processor has more performance cores than the average processor (24 vs 4). The average processor has 4 performance cores.
    24 vs 4
  • 40 more CPU threads
    This processor has more CPU threads than the average processor (48 vs 8). The average processor has 8 CPU threads.
    48 vs 8
  • Higher base clock
    This processor has a higher base clock than the average processor (24x3.8 GHz vs 4x3.4 GHz).
    24x3.8 GHz vs 4x3.4 GHz
  • Unlocked for overclocking
    This processor has an unlocked multiplier, while the average processor does not. 22.6% of processors offer this.
  • 9.2% higher single-core score
    This processor has a higher Geekbench 6 single-core score than the average processor (1,676 vs 1,535). The average processor scores 1,535 in Geekbench 6 single-core.
    1,676 vs 1,535
  • 2x higher bus transfer rate
    This processor has a higher bus transfer rate than the average processor (16 GT/s vs 8 GT/s). The average processor offers bus transfer rate of 8 GT/s.
    16 GT/s vs 8 GT/s
  • 10 higher clock multiplier
    This processor has a higher clock multiplier than the average processor (38 vs 28). The average processor has a clock multiplier of 28.
    38 vs 28
  • 14.22x larger L3 cache
    This processor has a higher L3 cache than the average processor (128 MB vs 9 MB). The average processor has L3 cache of 9 MB.
    128 MB vs 9 MB
  • 4x larger L2 cache
    This processor has a higher L2 cache than the average processor (12 MB vs 3 MB). The average processor has L2 cache of 3 MB.
    12 MB vs 3 MB
  • 2.88x more L3 per core
    This processor has more L3 cache per core than the average processor (5.3 MB/core vs 1.85 MB/core). The average processor provides 1.85 MB/core of L3 cache per core.
    5.33 MB/core vs 1.85 MB/core
  • 4x larger L1 cache
    This processor has a higher L1 cache than the average processor (1,536 KB vs 384 KB). The average processor has L1 cache of 384 KB.
    1,536 KB vs 384 KB
  • 41.7% smaller process node
    This processor has a lower process node than the average processor (7 nm vs 12 nm). The average processor uses a process node of 12 nm.
    7 nm vs 12 nm
  • 4.84x more transistors
    This processor has more transistors than the average processor (23.9 billion vs 4.95 billion). The average processor has 4.95 billion transistors.
    23.94 billion vs 4.95 billion
  • More advanced foundry
    This processor uses a more advanced foundry process than the average processor (TSMC 7 nm vs Intel 14 nm).
    TSMC 7 nm vs Intel 14 nm
  • 72 more PCIe lanes
    This processor has more PCIe lanes than the average processor (88 vs 16). The average processor offers 16 PCIe lanes.
    72 usable lanes
    88 vs 16
  • 4x more memory capacity
    This processor has more maximum memory capacity than the average processor (256 GB vs 64 GB). The average processor supports 64 GB of memory.
    256 GB vs 64 GB
  • 2.18x higher memory bandwidth
    This processor has a higher memory bandwidth than the average processor (102.4 GB/s vs 46.9 GB/s). The average processor offers memory bandwidth of 46.9 GB/s.
    102.4 GB/s vs 46.9 GB/s
  • Newer PCIe version
    This processor supports a newer PCIe version than the average processor (4 vs 3).
    4 vs 3
  • Supports memory overclocking
    This processor supports memory overclocking, while the average processor does not. 43.9% of processors support memory overclocking.
  • Supports ECC memory
    This processor supports ECC memory, while the average processor does not. 32% of processors support it.
  • 5 °C lower CPU temperature
    This processor has a lower CPU temperature than the average processor (95 °C vs 100 °C). The average processor runs at a CPU temperature of 100 °C.
    95 °C vs 100 °C
  • 6.22x higher base power
    This processor has a higher base power draw than the average processor (280 W vs 45 W). The average processor has a base power draw of 45 W.
    280 W vs 45 W
  • No configurable TDP
    This processor does not support configurable TDP, while the average processor does. 53.7% of processors support configurable TDP.
  • 85.1% slower Blender rendering
    This processor has a higher Blender BMW27 render time than the average processor (59.4 vs 398). The average processor needs 398.015 for the Blender BMW27 test.
    59.4 vs 398.015
  • Less advanced microarchitecture
    This processor uses a less advanced microarchitecture than the average processor (Castle Peak vs Kaby Lake).
    Castle Peak vs Kaby Lake
  • 4.02x larger die size
    This processor has a higher die size than the average processor (712 mm² vs 177 mm²). The average processor has a die size of 177 mm².
    712 mm² vs 177 mm²
  • 6.22x higher TDP
    This processor has a higher TDP than the average processor (280 W vs 45 W). The average processor has a TDP of 45 W.
    280 W vs 45 W
  • 5 °C lower temperature limit
    This processor has a lower temperature limit than the average processor (95 °C vs 100 °C). The average processor can run up to 100 °C.
    95 °C vs 100 °C
  • 5.28x more expensive
    AMD Ryzen Threadripper 3960X is more expensive than the average processor (£1,320 vs £250).
    £1,320 vs £250
  • 5.28x more expensive
    AMD Ryzen Threadripper 3960X is more expensive than the average processor (£1,320 vs £250).
    £1,320 vs £250
  • 9.1% worse value for money
    AMD Ryzen Threadripper 3960X has worse value for money than the average processor (6.68 vs 7.3).
    6.68 vs 7.29
  • Weaker security extensions
    This processor provides less advanced security extensions than the average processor (AES-NI, SHA, NX bit, SMAP, SMEP, Secure Processor, SME, SEV vs AES-NI, NX bit, Secure Key, TXT, OS Guard, Boot Guard, CET, MBEC, TME, TME-MK).
    AES-NI, SHA, NX bit, SMAP, SMEP, Secure Processor, SME, SEV vs AES-NI, NX bit, Secure Key, TXT, OS Guard, Boot Guard, CET, MBEC, TME, TME-MK
  • Older TPM support
    This processor supports an older TPM version than the average processor (fTPM 2 vs PTT 2).
    fTPM 2.0 vs PTT 2.0
  • 85.1% slower Blender rendering
    This processor has a higher Blender BMW27 render time than the average processor (59.4 vs 398). The average processor needs 398.015 for the Blender BMW27 test.
    59.4 vs 398.015
  • 46.5% slower classroom rendering
    This processor has a higher Blender Classroom render time than the average processor (182.1 vs 340.1). The average processor needs 340.075 for the Blender Classroom test.
    182.1 vs 340.075
  • Less advanced microarchitecture
    This processor uses a less advanced microarchitecture than the average processor (Castle Peak vs Kaby Lake).
    Castle Peak vs Kaby Lake
  • 4.02x larger die size
    This processor has a higher die size than the average processor (712 mm² vs 177 mm²). The average processor has a die size of 177 mm².
    712 mm² vs 177 mm²
  • 2 fewer memory channels
    This processor has fewer memory channels than the average processor (4 vs 2). The average processor supports 2 memory channels.
    4 vs 2
  • No integrated graphics
    This processor does not include integrated graphics, while the average processor does. 85.4% of processors include integrated graphics.
  • 6.22x higher base power
    This processor has a higher base power draw than the average processor (280 W vs 45 W). The average processor has a base power draw of 45 W.
    280 W vs 45 W
  • No configurable TDP
    This processor does not support configurable TDP, while the average processor does. 53.7% of processors support configurable TDP.
  • 6.22x higher TDP
    This processor has a higher TDP than the average processor (280 W vs 45 W). The average processor has a TDP of 45 W.
    280 W vs 45 W
  • 5 °C lower temperature limit
    This processor has a lower temperature limit than the average processor (95 °C vs 100 °C). The average processor can run up to 100 °C.
    95 °C vs 100 °C

Video reviews

Hands-on testing, unboxing, and real-world video evaluations

8.0
Ethically Sourced Hardware
≈ estimated
22/04/2024
Build and benchmarks · gaming tests with a 3070
Verdict
AMD Ryzen Threadripper 3960X is a strong all-rounder for work and gaming, though older tech limits some titles and Game Mode costs performance.
8.0
MOBHouse
✓ explicit
27/03/2021
Review · performance vs 5950X and Threadripper upgrade
Verdict
AMD Ryzen Threadripper 3960X is worth it for heavy 3D and video work, but it is a very niche processor for most buyers.
8.0
Stanley Yan
≈ estimated
27/02/2020
Overclocking test · hand-tuned overclock vs PBO, temperatures and power
Verdict
AMD Ryzen Threadripper 3960X is best run with stock-style PBO and good cooling, since hand-tuned overclocking adds little for much more heat.
9.0
Nicolas11x12 English
≈ estimated
18/12/2019
Long-term creator workflow test · rendering, stabilisation and gaming
Verdict
AMD Ryzen Threadripper 3960X is great value for heavy video production, but it is not a CPU made for everyone.
9.0
Tech for Techs
≈ estimated
16/12/2019
Hands-on review · benchmarks, overclocking and gaming tests
Verdict
AMD Ryzen Threadripper 3960X is strong for heavy multi-core workloads, but Intel is the cheaper pick if you mainly game.
9.0
EposVox
≈ estimated
25/11/2019
Streaming and creative benchmarks · hands-on studio testing
Verdict
AMD Ryzen Threadripper 3960X, the 24-core model, is the sweet spot for most creators, not the 32-core upgrade.
9.0
Gear Seekers
≈ estimated
25/11/2019
Benchmarks · Windows and Linux CPU tests
Verdict
AMD Ryzen Threadripper 3960X is a solid choice for heavy workloads, especially for owners of first-generation Threadripper chips.
5.0
Nicolas11x12 English
≈ estimated
22/03/2023
Head-to-head comparison · benchmarks, gaming and power draw
Verdict
AMD Ryzen Threadripper 3960X is beaten by the newer, cheaper 16-core chip, though it remains strong in heavy multi-core workloads.
9.5
Hardware Canucks
≈ estimated
25/11/2019
Review · rendering, productivity and gaming benchmarks
Verdict
AMD Ryzen Threadripper 3960X is a strong pick for professional rendering and creator work, though platform costs are high.
9.0
Hardware Unboxed
≈ estimated
25/11/2019
Hands-on review · benchmarks of 3970X and 3960X
Verdict
AMD Ryzen Threadripper 3960X is a third-gen Threadripper with no real trade-offs, and its price is acceptable given the performance.
9.0
KitGuruTech
≈ estimated
25/11/2019
Deep-dive review · performance, pricing and TRX40 platform
Verdict
AMD Ryzen Threadripper 3960X is expensive, but it is a good choice for demanding workloads that can use all of its cores.
Overview video

Expert reviews

In-depth analysis and verdict from leading tech publications

8.0
pcmag.com
✓ explicit
25/11/2019
Benchmark review · Content creation CPU
Verdict
The AMD Ryzen Threadripper 3960X delivers about 80 percent of the 3970X's speed for rendering and video work, but single-core speed still trails Intel.
9.0
servethehome.com
≈ estimated
02/01/2020
Workstation review · Lab tests
Verdict
The AMD Ryzen Threadripper 3960X is a 24-core workstation chip with 128MB of L3 cache and PCIe 4.0, but it needs a new TRX40 board.
9.0
techgage.com
≈ estimated
29/11/2019
Workstation benchmark · Windows testing
Verdict
The AMD Ryzen Threadripper 3960X is a fast 24-core workstation chip that needs a new TRX40 board, so it suits people building a new system.
8.0
uk.pcmag.com
✓ explicit
25/11/2019
Benchmark review · Content creation
Verdict
The Threadripper 3960X is a strong content-creation chip that beats Intel's chips in multi-core work, but trails in single-core tasks and needs a new motherboard.
10
techpowerup.com
✓ explicit
07/02/2020
Overclocking guide · Memory settings
Verdict
The AMD Ryzen Threadripper 3960X adds dozens of new BIOS settings, with a focus on memory tuning, which suits enthusiasts chasing benchmark records.
9.0
tomshardware.com
✓ explicit
20/12/2019
Lab review · Workstation benchmarks
Verdict
The AMD Ryzen Threadripper 3960X suits creators who want 24 cores and PCIe 4.0, but it needs a new TRX40 motherboard.
9.0
computerbase.de
≈ estimated
25/11/2019
Lab test · 24-core workstation chip
Verdict
The AMD Ryzen Threadripper 3960X is a 24-core Zen 2 chip that lifts multi-core speed about 50 percent over its predecessor, but it draws 280W and runs hot.
9.8
chip.de
✓ explicit
20/02/2020
Benchmark test · Workstation CPU
Verdict
The AMD Ryzen Threadripper 3960X is a fast 24-core chip for video editing and rendering, but it runs very hot and needs a separate cooler.
9.8
hardwareinside.de
✓ explicit
18/02/2020
Benchmark test · Core scaling
Verdict
The AMD Ryzen Threadripper 3960X leads multicore rendering tests, but it needs a new TRX40 board, so older Threadripper chips won't fit.
6.0
lesnumeriques.com
✓ explicit
25/11/2019
Lab test · Creator chip
Verdict
The Threadripper 3960X is a 24-core chip that handles creative work well and suits creators and enthusiasts, though some games need Game Mode and a restart.
8.0
hardwarecooking.fr
≈ estimated
13/12/2019
Lab test · Platform and packaging
Verdict
The AMD Ryzen Threadripper 3960X offers 24 cores at up to 4.5GHz and still fits many TR4 coolers, but it needs a new sTRX4 board.
9.2
profesionalreview.com
✓ explicit
25 de noviembre de 2019
Full review · Socket and benchmarks
Verdict
The Threadripper 3960X is a 24-core, 48-thread chip with PCIe 4.0 and a 4.5 GHz boost, but it needs a new TRX40 motherboard and a cooler bought separately.
7.0
geeknetic.es
✓ explicit
25 de noviembre de 2019
Full review · Architecture and overclocking
Verdict
The Threadripper 3960X is a 24-core, 48-thread chip built on Zen 2 that suits heavy workstation work, but it overclocks poorly and needs a fan-cooled chipset.
8.0
hwupgrade.it
≈ estimated
14/01/2020
Benchmark test · Power and gaming
Verdict
The AMD Ryzen Threadripper 3960X is the second-fastest chip tested, behind only the 3970X, but its power draw is high and games don't use its 24 cores.

Third-party reviews

What customers like about AMD Ryzen Threadripper 3960X

  • Excellent multi-threaded performance for 24 cores/48 threads, ideal for rendering, video encoding, and data science.
  • Superior price-to-performance ratio compared to competing Intel Core i9-10980XE processors.
  • Massive 128MB L3 cache and high base clock speeds (3.8 GHz) provide strong IPC improvements.
  • Broad connectivity with 88 PCIe 4.0 lanes for high-speed storage and multiple GPUs.
  • Supports quad-channel memory and up to 256GB of RAM, including ECC support on specific motherboards.
  • Competent gaming performance that avoids the need to disable cores, unlike previous generations.

What customers don't like about AMD Ryzen Threadripper 3960X

  • Requires a new, expensive TRX40 platform motherboard; not backward compatible with older TR4 sockets.
  • High power consumption with a 280W TDP, requiring robust and often expensive cooling solutions.
  • Finicky overclocking experience due to the complexity of managing 24 cores.
  • Overkill and less cost-effective for users focused solely on gaming compared to mainstream Ryzen chips.
  • Single-core performance, while improved, can still trail Intel's top consumer chips in specific older applications.
  • Limited future upgrade path as the sTRX4 socket has been succeeded by newer platforms.

Verdict

The AMD Ryzen Threadripper 3960X is a high-end desktop (HEDT) processor based on the 7nm Zen 2 architecture, featuring 24 cores and 48 threads with a base clock of 3.8GHz and a boost clock of up to 4.5GHz. It is equipped with a massive 140MB of combined L2 and L3 cache, supports quad-channel DDR4-3200 memory with ECC options, and provides a total of 88 PCIe 4.0 lanes for extensive storage and GPU configurations. Its primary advantages include elite multi-threaded performance for professional workloads like 3D rendering and video editing, superior power efficiency compared to competing Intel Xeon chips, and industry-leading I/O bandwidth via the TRX40 platform. However, it requires a significant financial investment due to its high price and the need for a specific, often expensive, sTRX4 motherboard, while its 280W TDP necessitates robust cooling solutions and high-wattage power supplies.

Compare AMD Ryzen Threadripper 3960X with other processors

1Product to compare no. 1
VS
2Product to compare no. 2
VS
3Product to compare no. 3 (optional)

Graphic comparison of AMD Ryzen Threadripper 3960X and other processors

No results found