Scored using Graphics cards Methodology v3.0
Graphics cards Methodology v3.0
Mathematical & Unbiased Scoring
Products in this category are scored under Frontum Graphics cards Methodology v3.0: the technical score from the specifications is the base, and independent expert and video reviews (up to ±0.5 points), owner opinions (up to ±0.3) and best-of lists (up to +0.3) move it up or down.
Explore Graphics cards Methodology v3.0

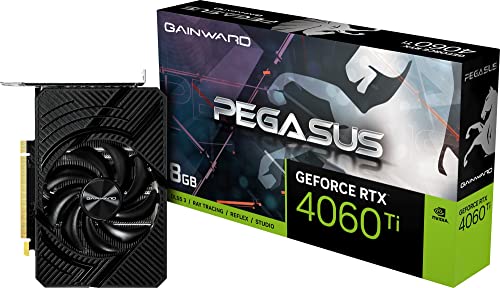
Gainward GeForce RTX 4060 Ti Pegasus OC 8GB review: 117 specs compared

Avg. price:~£390VRAM:8 GBMemory bus width:128 bitThermal Design Power (TDP):160 W

Gainward GeForce RTX 4060 Ti Pegasus OC 8GB Review: Compare 117 technical specifications to see how this product ranks in the Graphics cards category and whether it is worth buying.
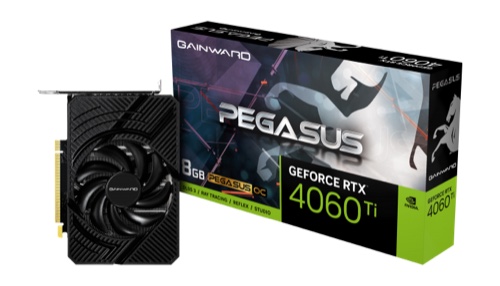
Gainward GeForce RTX 4060 Ti Pegasus OC 8GB
7.2/10

Overall score

Score
7.2/ 10
✕
What it is
Our main score for this model, 1–10. It combines specs, expert reviews, best-of lists and owners.
How we count it
Parts: Technical score 40%, Reviews score 25%, List score 25%, Sentiment score 10%
Marks: Each part gets a mark out of 10. For reviews, lists and owners, a typical model in this category gets about 8 and the best one gets 10.
No data yet: A part with no data shows "?". It counts as the mark of a weaker model in this category (4 in 5 models with data score higher). This way, models with reviews, lists and owners usually come out ahead.
Score distribution
▼
<55-66-77-88-99-10
Score components

40%

6.5

Technical score

25%

?

Reviews scoreNot enough data yet, so we use 7.6, the mark of a weaker model in this category

25%

?

List scoreNot enough data yet, so we use 7.5, the mark of a weaker model in this category

10%

8.8

Sentiment score

▼Worse than 57% of graphics cards
7.6

Value for money

Value for money
7.6/ 10
✕
What it is
An indicator that combines the graphics card's overall rating with its cost.
When it matters
When you are looking for a graphics card that offers a strong balance of performance, features, and price.
Score distribution
▼
<55-66-77-88-99-10
Score components

70%

7.2

Overall score

30%

8.5

Price

▲Better than 62%
6.5

Technical score

Technical score
6.5/ 10
✕
What it is
How good the specs are compared with the other models in this category, 1–10.
How we count it
Areas: We rate the specs in each area against the other models in this category.
Weighting: The areas that matter most to buyers count more. The shares are shown under Score components.
Share: The technical score is 40% of the overall score.
Score distribution
▼
<55-66-77-88-99-10
Score components

44%

6.1

Performance

24%

4.2

Memory

12%

7.7

Power

11%

9.5

Features

5%

8.4

Design

4%

9.6

Connectivity

▼Worse than 62%
?

Reviews score

Reviews score
✕
What it is
Average grade from independent test sites, magazines and video reviewers, 1–10.
How we count it
Grades: Each review's own score is converted to 1–10; without one, we grade the review ourselves. Big test sites count more, short reviews half as much as full tests. A video review counts half.
Score: The average grade is 80% of the review mark; the number of reviews is the other 20% (1 review = 5, the typical number in this category = 8, the most-reviewed model = 10).
Enough data: With few reviews, the average grade is pulled toward the typical grade of this category. No reviews yet: 7.6 for now.
Share: Reviews count 25% of the overall score.
Score distribution
▼
<55-66-77-88-99-10
Grades by review (0)
We have not found an independent test of this model yet. Until we do, its review part counts as 7.6.
User ratings collected online are not part of this score.
No expert tests yet
?

List score

List score
7.5/ 10
✕
What it is
How often independent test sites, magazines and video reviewers put this model in their best-of lists for this category.
How we count it
Points: The model in the most lists of this category gets 10; the others get 8 to 10 in proportion. In no list yet: 7.5. Lists count 25% of the overall score.
Enough data: Every list counts, even a single one. With fewer than 5 best-of lists in the category, this part is left out.
Lists with this model (0)
Not in any best-of list yet, so this part counts as 7.5. Models in a list get 8 to 10.
Not in any best-of list yet
  • gainward-geforce-rtx-4060-ti-pegasus-oc-8gb
gainward-geforce-rtx-4060-ti-pegasus-oc-8gb
Where to buy
    N/A~ £390

What owners say about the Gainward GeForce RTX 4060 Ti Pegasus OC 8GB

Based on 151 owners sharing their experience in online comments

77%positive13%mixed10%negative

Owners praise its efficient gaming and AI performance, while price and limited memory cause the most frustration.

What owners dislike

  • Many owners feel the price is high for the performance, especially at launch, and say it was better value when it dropped to around 400 to 450 dollars or euros.14
  • Games that use more than 8GB of VRAM stutter, freeze, or run out of memory at higher settings, so owners of the 8GB version report problems in newer titles.7
  • Owners report games crashing or freezing when VRAM fills up, for example in Resident Evil 4 and Spider-Man Remastered, and some report crashes with ray tracing enabled.3
  • Owners say it is a 1080p card rather than a 1440p card, and say 1440p or 4K performance drops below expectations in demanding games.3

Points mentioned by at least 3 owners, most mentioned first.

Loading...
Loading category ranking...

Technical Specifications of graphics card Gainward GeForce RTX 4060 Ti Pegasus OC 8GB

Technical score
Technical score
6.5/ 10
✕
What it is
How good the specs are compared with the other models in this category, 1–10.
How we count it
Areas: We rate the specs in each area against the other models in this category.
Weighting: The areas that matter most to buyers count more. The shares are shown under Score components.
Share: The technical score is 40% of the overall score.
Score distribution
▼
<55-66-77-88-99-10
Score components:

44%

6.1

Performance

24%

4.2

Memory

12%

7.7

Power

11%

9.5

Features

5%

8.4

Design

4%

9.6

Connectivity

6.5
Reviews score
7.6
List score
?
Value for money
Value for money
7.6/ 10
✕
What it is
An indicator that combines the graphics card's overall rating with its cost.
When it matters
When you are looking for a graphics card that offers a strong balance of performance, features, and price.
Score distribution
▼
<55-66-77-88-99-10
Score components:

70%

7.2

Overall score

30%

8.5

Price

7.6
3DMark Time Spy benchmark score
13,200 points
This graphics card scores 13,200 points in 3DMark Time Spy, which is lower than 58.2% of graphics cards and equal to 0.1% of graphics cards.
3DMark Port Royal score
8,000 points
This graphics card scores 8,000 points in 3DMark Port Royal, which is lower than 58.6% of graphics cards and equal to 0.9% of graphics cards.
PassMark (G3D) result
22,638 points
This graphics card scores 22,638 points in PassMark G3D, which is higher than 48.9% of graphics cards and equal to 1.3% of graphics cards.
PassMark (DirectCompute) result
12,074 points
This graphics card scores 12,074 points in PassMark DirectCompute, which is higher than 50.1% of graphics cards and equal to 0.7% of graphics cards.
FP32 performance
22.06 TFLOPS
This graphics card delivers 22.06 TFLOPS FP32 performance, which is lower than that of 52.2% of graphics cards and equal to that of 1.9% of graphics cards.
Show more
VRAM
8 GB
This graphics card has 8 GB of VRAM, which is less than 56.8% of graphics cards and equal to 25.7% of graphics cards.
Memory type
GDDR6
This graphics card uses GDDR6 memory, which is newer than on 16.4% of graphics cards and equal to 40.3% of graphics cards.
Memory bus width
128 bit
This graphics card uses a 128 bit memory bus, which is narrower than that of 68.6% of graphics cards and equal to that of 26.7% of graphics cards.
Maximum memory bandwidth
288 GB/s
This graphics card reaches 288 GB/s memory bandwidth, which is lower than that of 69.9% of graphics cards and equal to that of 6.5% of graphics cards.
Effective memory speed
18,000 MHz
This graphics card reaches an effective memory speed of 18,000 MHz, which is slower than that of 51.5% of graphics cards and equal to that of 8.9% of graphics cards.
Show more
PCI Express (PCIe) version
4
This graphics card supports PCIe 4, which is newer than on 22.5% of graphics cards and equal to 50.5% of graphics cards.
PCIe lanes
x8
This graphics card uses x8 PCIe lanes, which is fewer than 75.9% of graphics cards and equal to 22.9% of graphics cards.
DirectX version
12 Ultimate
This graphics card supports DirectX 12 Ultimate, which is more advanced than on 22.8% of graphics cards and equal to 77.2% of graphics cards.
Vulkan version
1.4
This graphics card supports Vulkan 1.4, which is more advanced than on 20.8% of graphics cards and equal to 79.2% of graphics cards.
OpenGL version
4.6
This graphics card supports OpenGL 4.6, which is more advanced than on 2% of graphics cards and equal to 98% of graphics cards.
Show more
Max displays supported
4
This graphics card supports up to 4 displays, which is more than 9% of graphics cards and equal to 88.2% of graphics cards.
Max digital resolution
7680x4320
This graphics card supports a maximum digital resolution of 7680x4320, which is higher than that of 9.2% of graphics cards and equal to that of 90.9% of graphics cards.
DisplayPort outputs
3
This graphics card offers 3 DisplayPort outputs, which is more than 21.7% of graphics cards and equal to 76% of graphics cards.
DisplayPort version
1.4a
This graphics card supports DisplayPort 1.4a, which is more advanced than on 19.3% of graphics cards and equal to 46.3% of graphics cards.
DisplayPort link rates
32.4 Gbps
This graphics card supports DisplayPort link rates up to 32.4 Gbps, which is faster than on 56.6% of graphics cards and equal to 20.9% of graphics cards.
Show more
Thermal Design Power (TDP)
160 W
This graphics card has a TDP of 160 W, which is lower than that of 67.8% of graphics cards and equal to that of 4.8% of graphics cards.
Power consumption while under peak load
160 W
This graphics card draws 160 W under peak load, which is lower than 71.4% of graphics cards and equal to 3.8% of graphics cards.
Recommended PSU wattage
550 W
This graphics card recommends a 550 W PSU, which is lower than that of 61.8% of graphics cards and equal to that of 13.3% of graphics cards.
Board power limit
160 W
This graphics card has a board power limit of 160 W, which is lower than that of 71.5% of graphics cards and equal to that of 3.7% of graphics cards.
PCIe power spec
160 W
Show more
Size
170x 112.8x 40 mm
Length
170 mm
This graphics card is 170 mm long, which is shorter than 94.3% of graphics cards and equal in length to 0.7% of graphics cards.
Height
124.1 mm
This graphics card is 124.1 mm tall, which is shorter than 51.7% of graphics cards and equal in height to 0.1% of graphics cards.
Slot width
2 slot/s
This graphics card occupies 2 slot/s, which is slimmer than 52.4% of graphics cards and equal in width to 43.4% of graphics cards.
Weight
715 g
This graphics card weighs 715 g, which is lighter than 76.9% of Graphics cards and equal to 0.1% of Graphics cards.
Show more

Gainward GeForce RTX 4060 Ti Pegasus OC 8GB vs the average graphics card

246810TotalPerformanceMemoryFeaturesConnectivityPowerDesign
  • 6.6% higher boost clock speed
    This graphics card has a higher boost GPU clock than the average graphics card (2,670 MHz vs 2,505 MHz). The average graphics card has a boost GPU clock of 2,505 MHz.
    2,670 MHz vs 2,505 MHz
  • 20.3% higher base clock speed
    This graphics card has a higher base GPU clock than the average graphics card (2,310 MHz vs 1920 MHz). The average graphics card has a base GPU clock of 1920 MHz.
    2,310 MHz vs 1,920 MHz
  • 112.2 mm shorter card length
    This graphics card is shorter than the average graphics card (170 mm vs 282.2 mm). The average graphics card has a length of 282.2 mm.
    170 mm vs 282.2 mm
  • 28.6% faster VRAM clock
    This graphics card has a higher VRAM clock than the average graphics card (2,250 MHz vs 1,750 MHz). The average graphics card runs its VRAM at 1,750 MHz.
    2,250 MHz vs 1,750 MHz
  • 25.6% lower TDP
    This graphics card has a lower TDP than the average graphics card (160 W vs 215 W). The average graphics card has a TDP of 215 W.
    160 W vs 215 W
  • 0.5 slot/s slimmer design
    This graphics card occupies fewer slots than the average graphics card (2 slot/s vs 2.5 slot/s). The average graphics card occupies 2.5 slot/s.
    2 slot/s vs 2.5 slot/s
  • 15.4% lower PSU requirement
    This graphics card has a lower PSU requirement than the average graphics card (550 W vs 650 W). The average graphics card has a PSU requirement of 650 W.
    550 W vs 650 W
  • 4x higher HDMI bandwidth
    This graphics card has a higher HDMI bandwidth than the average graphics card (48 Gbps vs 12 Gbps). The average graphics card has HDMI bandwidth of 12 Gbps.
    48 Gbps vs 12 Gbps
  • 12.8% higher sentiment score
    8.8 vs 7.8
  • 6.6% higher boost clock speed
    This graphics card has a higher boost GPU clock than the average graphics card (2,670 MHz vs 2,505 MHz). The average graphics card has a boost GPU clock of 2,505 MHz.
    2,670 MHz vs 2,505 MHz
  • 20.3% higher base clock speed
    This graphics card has a higher base GPU clock than the average graphics card (2,310 MHz vs 1920 MHz). The average graphics card has a base GPU clock of 1920 MHz.
    2,310 MHz vs 1,920 MHz
  • 28.6% faster VRAM clock
    This graphics card has a higher VRAM clock than the average graphics card (2,250 MHz vs 1,750 MHz). The average graphics card runs its VRAM at 1,750 MHz.
    2,250 MHz vs 1,750 MHz
  • 8x more Infinity Cache
    This graphics card has more Infinity Cache than the average graphics card (32 MB vs 4 MB). The average graphics card has 4 MB Infinity Cache.
    32 MB vs 4 MB
  • 4x higher HDMI bandwidth
    This graphics card has a higher HDMI bandwidth than the average graphics card (48 Gbps vs 12 Gbps). The average graphics card has HDMI bandwidth of 12 Gbps.
    48 Gbps vs 12 Gbps
  • 25.6% lower TDP
    This graphics card has a lower TDP than the average graphics card (160 W vs 215 W). The average graphics card has a TDP of 215 W.
    160 W vs 215 W
  • 15.4% lower PSU requirement
    This graphics card has a lower PSU requirement than the average graphics card (550 W vs 650 W). The average graphics card has a PSU requirement of 650 W.
    550 W vs 650 W
  • 27.3% lower board power limit
    This graphics card has a lower board power limit than the average graphics card (160 W vs 220 W). The average graphics card has a board power limit of 220 W.
    160 W vs 220 W
  • 112.2 mm shorter card length
    This graphics card is shorter than the average graphics card (170 mm vs 282.2 mm). The average graphics card has a length of 282.2 mm.
    170 mm vs 282.2 mm
  • 0.5 slot/s slimmer design
    This graphics card occupies fewer slots than the average graphics card (2 slot/s vs 2.5 slot/s). The average graphics card occupies 2.5 slot/s.
    2 slot/s vs 2.5 slot/s
  • 2 fewer fans
    This graphics card has fewer fans than the average graphics card (1 vs 3).
    1 vs 3
  • 4 GB less VRAM
    This graphics card has fewer VRAM than the average graphics card (8 GB vs 12 GB). The average graphics card has 12 GB VRAM.
    8 GB vs 12 GB
  • No dual BIOS
    This graphics card does not include dual BIOS, the average graphics card does.
  • 64 bit narrower memory bus
    This graphics card has a narrower memory bus than the average graphics card (128 bit vs 192 bit). The average graphics card has a memory bus width of 192 bit.
    128 bit vs 192 bit
  • Fewer PCIe lanes
    This graphics card has fewer PCIe lanes than the average graphics card (x8 vs x16). The average graphics card has x16 PCIe lanes.
    x8 vs x16
  • Less advanced frame generation
    This graphics card has less advanced frame generation than the average graphics card (frame generation vs multi frame generation).
    frame generation vs multi frame generation
  • 35.7% lower memory bandwidth
    This graphics card has a lower memory bandwidth than the average graphics card (288 GB/s vs 448 GB/s). The average graphics card has a memory bandwidth of 448 GB/s.
    288 GB/s vs 448 GB/s
  • No backplate
    This graphics card does not include a backplate, the average graphics card does.
  • 48 fewer TMUs
    This graphics card has fewer TMUs than the average graphics card (136 vs 184). The average graphics card has 184 TMUs.
    136 vs 184
  • 16 fewer ROPs
    This graphics card has fewer ROPs than the average graphics card (48 vs 64). The average graphics card has 64 ROPs.
    48 vs 64
  • 6 fewer compute units
    This graphics card has fewer compute units than the average graphics card (34 vs 40). The average graphics card has 40 compute units.
    34 vs 40
  • 6 fewer ray tracing cores
    This graphics card has fewer ray tracing cores than the average graphics card (34 vs 40). The average graphics card has 40 ray tracing cores.
    34 vs 40
  • 20.5% lower pixel rate
    This graphics card has a lower pixel rate than the average graphics card (128.2 GPixel/s vs 161.3 GPixel/s). The average graphics card has a pixel rate of 161.3 GPixel/s.
    128.2 GPixel/s vs 161.3 GPixel/s
  • 9.6% lower texture rate
    This graphics card has a lower texture rate than the average graphics card (341.8 GTexel/s vs 378 GTexel/s). The average graphics card has a texture rate of 378 GTexel/s.
    341.8 GTexel/s vs 378 GTexel/s
  • 4 GB less VRAM
    This graphics card has fewer VRAM than the average graphics card (8 GB vs 12 GB). The average graphics card has 12 GB VRAM.
    8 GB vs 12 GB
  • 64 bit narrower memory bus
    This graphics card has a narrower memory bus than the average graphics card (128 bit vs 192 bit). The average graphics card has a memory bus width of 192 bit.
    128 bit vs 192 bit
  • 35.7% lower memory bandwidth
    This graphics card has a lower memory bandwidth than the average graphics card (288 GB/s vs 448 GB/s). The average graphics card has a memory bandwidth of 448 GB/s.
    288 GB/s vs 448 GB/s
  • 5.3% slower memory speed
    This graphics card has a lower effective memory speed than the average graphics card (18,000 MHz vs 19,000 MHz). The average graphics card reaches an effective memory speed of 19,000 MHz.
    18,000 MHz vs 19,000 MHz
  • Fewer PCIe lanes
    This graphics card has fewer PCIe lanes than the average graphics card (x8 vs x16). The average graphics card has x16 PCIe lanes.
    x8 vs x16
  • Less advanced frame generation
    This graphics card has less advanced frame generation than the average graphics card (frame generation vs multi frame generation).
    frame generation vs multi frame generation
  • Older shader model
    This graphics card supports an older shader model than the average graphics card (6.7 vs 6.8).
    6.7 vs 6.8
  • More basic codec support
    This graphics card encodes more basic formats than the average graphics card (H.264/H.265/AV1 vs H.264/H.265/AV1/VP9).
    H.264/H.265/AV1 vs H.264/H.265/AV1/VP9
  • Older NVDEC generation
    This graphics card has a lower NVDEC generation than the average graphics card (5 vs 6). The average graphics card offers NVDEC generation 6.
    5 vs 6
  • 2 fewer fans
    This graphics card has fewer fans than the average graphics card (1 vs 3).
    1 vs 3
  • No dual BIOS
    This graphics card does not include dual BIOS, the average graphics card does.
  • 3.6 dB noisier under load
    This graphics card has a higher load noise level than the average graphics card (39 dB vs 35.4 dB). The average graphics card has a load noise level of 35.4 dB.
    39 dB vs 35.4 dB
  • No backplate
    This graphics card does not include a backplate, the average graphics card does.
  • No RGB lighting
    This graphics card does not include RGB lighting, the average graphics card does.

Third-party reviews

What customers like about Gainward GeForce RTX 4060 Ti Pegasus OC 8GB

  • Ultra-compact 17cm length makes it ideal for small form factor (Mini-ITX) builds
  • Support for DLSS 3 Frame Generation provides significant performance boosts in compatible titles
  • Highly power-efficient design with lower wattage than previous generations
  • Includes AV1 encoding support, which is a major benefit for streamers
  • Single-fan design maintains quiet operation during light tasks via idle modes

What customers don't like about Gainward GeForce RTX 4060 Ti Pegasus OC 8GB

  • 8GB of VRAM is widely considered insufficient for modern, memory-intensive gaming
  • Limited 128-bit memory interface results in poor performance scaling at resolutions above 1080p
  • The single-fan cooling system can lead to higher operating temperatures (up to 84°C) under heavy load
  • Very minimal performance uplift over the previous-generation RTX 3060 Ti
  • Perceived poor value due to the $400 price point combined with hardware compromises

Verdict

The Gainward GeForce RTX 4060 Ti Pegasus OC 8GB is a compact, ultra-efficient graphics card built on the NVIDIA Ada Lovelace architecture, featuring 4352 CUDA cores, a boost clock of 2670 MHz, and 8GB of GDDR6 memory on a 128-bit bus with 288 GB/s bandwidth. Its primary strength lies in its 17cm single-fan design, making it an ideal choice for Mini-ITX builds and small PC setups that require powerful performance in a limited space. Main characteristics include support for DLSS 3 frame generation, 3rd-Gen Ray Tracing, and AV1 encoding, all while maintaining a low 160W TDP for exceptional energy efficiency. However, the card faces limitations due to its 8GB VRAM buffer and narrow 128-bit memory interface, which can bottleneck performance at 1440p resolutions or higher in modern AAA titles, and the single-fan cooling solution may run warmer or louder under heavy sustained loads compared to larger multi-fan models.

Compare Gainward GeForce RTX 4060 Ti Pegasus OC 8GB with other products in the Graphics cards category

1Product to compare no. 1
VS
2Product to compare no. 2
VS
3Product to compare no. 3 (optional)

Graphic comparison of Gainward GeForce RTX 4060 Ti Pegasus OC 8GB and other products in the Graphics cards category

No results found