Scored using Graphics cards Methodology v1.0
Graphics cards Methodology v1.0
Mathematical & Unbiased Scoring
Products in this category are scored under Frontum Graphics cards Methodology v1.0: technical specifications plus authentic consumer ratings, with 0% commercial bias.
Explore Graphics cards Methodology v1.0

ASUS Turbo GeForce GTX 1080 Ti Review | 118 Data compared

Avg. price:~£140VRAM:11 GBMemory bus width:352 bitThermal Design Power (TDP):220 W

ASUS Turbo GeForce GTX 1080 Ti Review: Compare 118 technical specifications and user reviews to see how this product ranks in the Graphics cards category and whether it is worth buying.
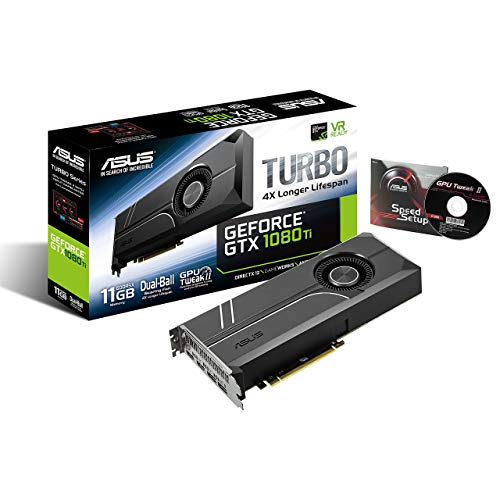
ASUS Turbo GeForce GTX 1080 Ti
5.9/10

Overall score

Score
5.9/ 10
✕
What it is
An overall evaluation of the graphics card's quality, based on technical analyses and user reviews.
When it matters
When you need a quick reference to identify the best graphics cards on the market.
Score distribution
▼
<55-66-77-88-99-10
Score components

90%

5.7

Technical score

10%

8.3

User score

▼Worse than 76% of graphics cards
7.1

Value for money

Value for money
7.1/ 10
✕
What it is
An indicator that combines the graphics card's overall rating with its cost.
When it matters
When you are looking for a graphics card that offers a strong balance of performance, features, and price.
Score distribution
▼
<55-66-77-88-99-10
Score components

70%

5.9

Overall score

30%

9.8

Price

▼Worse than 58%
5.7

Technical score

Technical score
5.7/ 10
✕
What it is
An assessment of technical performance for products in the Graphics cards category across these key areas: Performance, Memory, Platform & Features, Connectivity & Media, Power & Cooling, Design.
When it matters
When you want to compare graphics cards based on technical performance and available features.
Score distribution
▼
<55-66-77-88-99-10
Score components

44%

4.2

Performance

24%

6.1

Memory

12%

6.8

Power & Cooling

11%

7.5

Platform & Features

5%

8.5

Design

4%

7.6

Connectivity & Media

▼Worse than 77%
8.3

User score

User score
8.3/ 10
✕
What it is
A rating that combines user reviews and the total number of reviews received by the graphics card.
When it matters
When you want to understand how a graphics card performs in real use and how reliable it is in terms of performance, temperatures, noise, stability, and long-term ownership.
Score distribution
▼
<55-66-77-88-99-10
Score components

70%

8.6

User ratings

30%

7.6

Number of reviews

Based on ratings from across the web.
▲Better than 67%
  • asus-turbo-geforce-gtx-1080-ti
  • asus-turbo-geforce-gtx-1080-ti
  • asus-turbo-geforce-gtx-1080-ti
  • asus-turbo-geforce-gtx-1080-ti
  • asus-turbo-geforce-gtx-1080-ti
  • asus-turbo-geforce-gtx-1080-ti
  • asus-turbo-geforce-gtx-1080-ti
asus-turbo-geforce-gtx-1080-ti
Best prices
*As an Amazon Associate, we earn from qualifying purchases.
Best rankings
Available: ranking among products currently available (including other versions of this product).All: ranking among all products in the database.
Loading...
Loading category ranking...

Graphics cards model ranking

Ranked #943 of 2,195 models in Graphics cards (Overall score)

Technical Specifications of graphics card ASUS Turbo GeForce GTX 1080 Ti

Technical score
Technical score
5.7/ 10
✕
What it is
An assessment of technical performance for products in the Graphics cards category across these key areas: Performance, Memory, Platform & Features, Connectivity & Media, Power & Cooling, Design.
When it matters
When you want to compare graphics cards based on technical performance and available features.
Score distribution
▼
<55-66-77-88-99-10
Score components:

44%

4.2

Performance

24%

6.1

Memory

12%

6.8

Power & Cooling

11%

7.5

Platform & Features

5%

8.5

Design

4%

7.6

Connectivity & Media

5.7
User score
User score
8.3/ 10
✕
What it is
A rating that combines user reviews and the total number of reviews received by the graphics card.
When it matters
When you want to understand how a graphics card performs in real use and how reliable it is in terms of performance, temperatures, noise, stability, and long-term ownership.
Score distribution
▼
<55-66-77-88-99-10
Score components

70%

8.6

User ratings

30%

7.6

Number of reviews

Based on ratings from across the web.
8.3
Popularity
Popularity
7.6/ 10
✕
What it is
An indicator based on the number of reviews received by the graphics card.
When it matters
When you prefer a graphics card that has already been chosen and reviewed by many other users.
Score distribution
▼
<55-66-77-88-99-10
Popularity:
ASUS Turbo GeForce GTX 1080 Ti has a popularity score of 7.6 points, which is higher than that of 70.9% of products in this category.
7.6
Value for money
Value for money
7.1/ 10
✕
What it is
An indicator that combines the graphics card's overall rating with its cost.
When it matters
When you are looking for a graphics card that offers a strong balance of performance, features, and price.
Score distribution
▼
<55-66-77-88-99-10
Score components:

70%

5.9

Overall score

30%

9.8

Price

7.1
3DMark Time Spy benchmark score
10,300 points
This graphics card scores 10,300 points in 3DMark Time Spy, which is lower than 69.8% of graphics cards.
3DMark Port Royal score
0 points
This graphics card scores 0 points in 3DMark Port Royal, which is lower than 83.2% of graphics cards and equal to 16.8% of graphics cards.
PassMark (G3D) result
18,597 points
This graphics card scores 18,597 points in PassMark G3D, which is lower than 64.5% of graphics cards and equal to 0.2% of graphics cards.
PassMark (DirectCompute) result
9,591 points
This graphics card scores 9,591 points in PassMark DirectCompute, which is lower than 61.9% of graphics cards.
Floating-point performance
11.34 TFLOPS
This graphics card delivers 11.34 TFLOPS floating-point performance, which is lower than that of 72.9% of graphics cards and equal to that of 0.2% of graphics cards.
Show more
VRAM
11 GB
This graphics card has 11 GB of VRAM, which is less than 54.6% of graphics cards and equal to 1.5% of graphics cards.
Memory type
GDDR5X
GDDR version
GDDR5X
This graphics card uses GDDR5X memory, which is older than on 84.2% of graphics cards and equal to 1.6% of graphics cards.
Memory bus width
352 bit
This graphics card uses a 352 bit memory bus, which is wider than that of 87.8% of graphics cards and equal to that of 1.5% of graphics cards.
Maximum memory bandwidth
484 GB/s
This graphics card reaches 484 GB/s memory bandwidth, which is higher than that of 52.7% of graphics cards and equal to that of 0.5% of graphics cards.
Show more
PCI Express (PCIe) version
3
This graphics card supports PCIe 3, which is older than on 77.7% of graphics cards and equal to 20.3% of graphics cards.
PCIe lanes
x16
This graphics card uses x16 PCIe lanes, which is more than 23.4% of graphics cards and equal to 76.6% of graphics cards.
DirectX version
12
This graphics card supports DirectX 12, which is older than on 81.8% of graphics cards and equal to 16.9% of graphics cards.
Vulkan version
1.4
This graphics card supports Vulkan 1.4, which is more advanced than on 20.7% of graphics cards and equal to 79.3% of graphics cards.
OpenGL version
4.6
This graphics card supports OpenGL 4.6, which is more advanced than on 1.9% of graphics cards and equal to 98.1% of graphics cards.
Show more
Max displays supported
4
This graphics card supports up to 4 displays, which is more than 8.3% of graphics cards and equal to 88.9% of graphics cards.
Max digital resolution
7680x4320
This graphics card supports a maximum digital resolution of 7680x4320, which is higher than that of 9% of graphics cards and equal to that of 91% of graphics cards.
DisplayPort outputs
2
This graphics card offers 2 DisplayPort outputs, which is fewer than 79.1% of graphics cards and equal to 9.5% of graphics cards.
DisplayPort version
1.4
This graphics card supports DisplayPort 1.4, which is older than on 80.6% of graphics cards and equal to 13.3% of graphics cards.
DisplayPort link rates
32.4 Gbps
This graphics card supports DisplayPort link rates up to 32.4 Gbps, which is faster than on 57.6% of graphics cards and equal to 21.5% of graphics cards.
Show more
Thermal Design Power (TDP)
220 W
This graphics card has a TDP of 220 W, which is higher than that of 50.1% of graphics cards and equal to that of 4.2% of graphics cards.
Power consumption while under peak load
250 W
This graphics card draws 250 W under peak load, which is higher than 56.8% of graphics cards and equal to 4.8% of graphics cards.
Recommended PSU wattage
600 W
This graphics card recommends a 600 W PSU, which is lower than that of 54.3% of graphics cards and equal to that of 7.9% of graphics cards.
Board power limit
250 W
This graphics card has a board power limit of 250 W, which is higher than that of 55.1% of graphics cards and equal to that of 4.4% of graphics cards.
PCIe power spec
75 W
Show more
Size
267x 111x 38 mm
Length
267 mm
This graphics card is 267 mm long, which is shorter than 59.7% of graphics cards and equal in length to 3.5% of graphics cards.
Height
111.2 mm
This graphics card is 111.2 mm tall, which is shorter than 80% of graphics cards and equal in height to 0.7% of graphics cards.
Slot width
2 slot/s
This graphics card occupies 2 slot/s, which is slimmer than 53.4% of graphics cards and equal in width to 42.5% of graphics cards.
Weight
1,266 g
This graphics card weighs 1,266 g, which is heavier than 63.6% of graphics cards.
Show more

ASUS Turbo GeForce GTX 1080 Ti vs the average graphics card

246810TotalPerformanceMemoryPlatform & FeaturesConnectivity & MediaPower & CoolingDesign
  • 96 bit wider memory bus
    This graphics card has a wider memory bus than the average graphics card (352 bit vs 256 bit). The average graphics card has a memory bus width of 256 bit.
    352 bit vs 256 bit
  • 24 more ROPs
    This graphics card has more ROPs than the average graphics card (88 vs 64). The average graphics card has 64 ROPs.
    88 vs 64
  • 13.8 mm lower card height
    This graphics card is shorter than the average graphics card (111.2 mm vs 125 mm). The average graphics card has a height of 125 mm.
    111.2 mm vs 125 mm
  • 0.5 slot/s slimmer design
    This graphics card occupies fewer slots than the average graphics card (2 slot/s vs 2.5 slot/s). The average graphics card occupies 2.5 slot/s.
    2 slot/s vs 2.5 slot/s
  • 40 more TMUs
    This graphics card has more TMUs than the average graphics card (224 vs 184). The average graphics card has 184 TMUs.
    224 vs 184
  • 2 more GPUs supported
    This graphics card supports more GPUs in multi-GPU mode than the average graphics card (2 vs 0). The average graphics card supports 0 GPUs in multi-GPU mode.
    2 vs 0
  • 3.79x cheaper
    ASUS Turbo GeForce GTX 1080 Ti is cheaper than the average graphics card (£140 vs £530).
    £140 vs £530
  • Supports multi-GPU linking
    This graphics card supports multi-GPU linking, the average graphics card does not.
  • 3.79x cheaper
    ASUS Turbo GeForce GTX 1080 Ti is cheaper than the average graphics card (£140 vs £530).
    £140 vs £530
  • 3.8% higher user score
    User score
    8.3/ 10
    ✕
    What it is
    A rating that combines user reviews and the total number of reviews received by the graphics card.
    When it matters
    When you want to understand how a graphics card performs in real use and how reliable it is in terms of performance, temperatures, noise, stability, and long-term ownership.
    Score distribution
    ▼
    ▼
    <55-66-77-88-99-10
    ASUS Turbo GeForce GTX 1080 Ti
    the average graphics card
    ASUS Turbo GeForce GTX 1080 Ti has a higher user score than the average graphics card (8.30 vs 8.000).
    8.3 vs 8
  • 24 more ROPs
    This graphics card has more ROPs than the average graphics card (88 vs 64). The average graphics card has 64 ROPs.
    88 vs 64
  • 40 more TMUs
    This graphics card has more TMUs than the average graphics card (224 vs 184). The average graphics card has 184 TMUs.
    224 vs 184
  • 96 bit wider memory bus
    This graphics card has a wider memory bus than the average graphics card (352 bit vs 256 bit). The average graphics card has a memory bus width of 256 bit.
    352 bit vs 256 bit
  • 8% higher memory bandwidth
    This graphics card has a higher memory bandwidth than the average graphics card (484 GB/s vs 448 GB/s). The average graphics card has a memory bandwidth of 448 GB/s.
    484 GB/s vs 448 GB/s
  • 2 more GPUs supported
    This graphics card supports more GPUs in multi-GPU mode than the average graphics card (2 vs 0). The average graphics card supports 0 GPUs in multi-GPU mode.
    2 vs 0
  • Supports multi-GPU linking
    This graphics card supports multi-GPU linking, the average graphics card does not.
  • 7.7% lower PSU requirement
    This graphics card has a lower PSU requirement than the average graphics card (600 W vs 650 W). The average graphics card has a PSU requirement of 650 W.
    600 W vs 650 W
  • 13.8 mm lower card height
    This graphics card is shorter than the average graphics card (111.2 mm vs 125 mm). The average graphics card has a height of 125 mm.
    111.2 mm vs 125 mm
  • 0.5 slot/s slimmer design
    This graphics card occupies fewer slots than the average graphics card (2 slot/s vs 2.5 slot/s). The average graphics card occupies 2.5 slot/s.
    2 slot/s vs 2.5 slot/s
  • 36.8% lower boost clock speed
    This graphics card has a lower boost GPU clock than the average graphics card (1582 MHz vs 2505 MHz). The average graphics card has a boost GPU clock of 2505 MHz.
    1,582 MHz vs 2,505 MHz
  • 40 fewer ray tracing cores
    This graphics card has fewer ray tracing cores than the average graphics card (0 vs 40). The average graphics card has 40 ray tracing cores.
    0 vs 40
  • 2 fewer fans
    This graphics card has fewer fans than the average graphics card (1 vs 3).
    1 vs 3
  • 3.2x larger process node
    This graphics card has a higher process node than the average graphics card (16 nm vs 5 nm). The average graphics card uses a process node of 5 nm.
    16 nm vs 5 nm
  • No DLSS support
    This graphics card does not support DLSS, the average graphics card does.
    No vs yes
  • No ray tracing
    This graphics card does not support ray tracing, the average graphics card does.
  • 12 fewer compute units
    This graphics card has fewer compute units than the average graphics card (28 vs 40). The average graphics card has 40 compute units.
    28 vs 40
  • 144 fewer AI cores
    This graphics card has fewer AI cores than the average graphics card (0 vs 144). The average graphics card has 144 AI cores.
    0 vs 144
  • 36.8% lower boost clock speed
    This graphics card has a lower boost GPU clock than the average graphics card (1582 MHz vs 2505 MHz). The average graphics card has a boost GPU clock of 2505 MHz.
    1,582 MHz vs 2,505 MHz
  • 40 fewer ray tracing cores
    This graphics card has fewer ray tracing cores than the average graphics card (0 vs 40). The average graphics card has 40 ray tracing cores.
    0 vs 40
  • 12 fewer compute units
    This graphics card has fewer compute units than the average graphics card (28 vs 40). The average graphics card has 40 compute units.
    28 vs 40
  • 144 fewer AI cores
    This graphics card has fewer AI cores than the average graphics card (0 vs 144). The average graphics card has 144 AI cores.
    0 vs 144
  • 22.9% lower base clock speed
    This graphics card has a lower base GPU clock than the average graphics card (1480 MHz vs 1920 MHz). The average graphics card has a base GPU clock of 1920 MHz.
    1,480 MHz vs 1,920 MHz
  • 49.8% lower FP32 performance
    This graphics card has a lower FP32 performance than the average graphics card (11.3 TFLOPS vs 22.57 TFLOPS). The average graphics card has FP32 performance of 22.57 TFLOPS.
    11.34 TFLOPS vs 22.57 TFLOPS
  • 29.8% lower gaming score
    This graphics card has a lower gaming score than the average graphics card (10300 points vs 14678.5 points). The average graphics card has a gaming score of 14678.5 points.
    10,300 points vs 14,678.5 points
  • 14.7% lower pixel rate
    This graphics card has a lower pixel rate than the average graphics card (139.2 GPixel/s vs 163.2 GPixel/s). The average graphics card has a pixel rate of 163.2 GPixel/s.
    139.2 GPixel/s vs 163.2 GPixel/s
  • 17.9% lower PassMark score
    This graphics card has a lower PassMark score than the average graphics card (18597 points vs 22653 points). The average graphics card has a PassMark score of 22653 points.
    18,597 points vs 22,653 points
  • 99.4% lower FP16 performance
    This graphics card has a lower FP16 performance than the average graphics card (0.2 TFLOPS vs 29.7 TFLOPS). The average graphics card has FP16 performance of 29.725 TFLOPS.
    0.18 TFLOPS vs 29.725 TFLOPS
  • 7% lower texture rate
    This graphics card has a lower texture rate than the average graphics card (354.4 GTexel/s vs 381.2 GTexel/s). The average graphics card has a texture rate of 381.2 GTexel/s.
    354.4 GTexel/s vs 381.2 GTexel/s
  • 42.1% slower memory speed
    This graphics card has a lower effective memory speed than the average graphics card (11000 MHz vs 19000 MHz). The average graphics card reaches an effective memory speed of 19000 MHz.
    11,000 MHz vs 19,000 MHz
  • 91.7% smaller L2 cache
    This graphics card has fewer L2 cache than the average graphics card (2 MB vs 24 MB). The average graphics card has 24 MB L2 cache.
    2 MB vs 24 MB
  • 1 GB less VRAM
    This graphics card has fewer VRAM than the average graphics card (11 GB vs 12 GB). The average graphics card has 12 GB VRAM.
    11 GB vs 12 GB
  • 21.4% slower VRAM clock
    This graphics card has a lower VRAM clock than the average graphics card (1376 MHz vs 1750 MHz). The average graphics card runs its VRAM at 1750 MHz.
    1,376 MHz vs 1,750 MHz
  • 62.5% smaller L1 cache
    This graphics card has fewer L1 cache than the average graphics card (48 vs 128). The average graphics card has 128 L1 cache.
    48 vs 128
  • 3.2x larger process node
    This graphics card has a higher process node than the average graphics card (16 nm vs 5 nm). The average graphics card uses a process node of 5 nm.
    16 nm vs 5 nm
  • No DLSS support
    This graphics card does not support DLSS, the average graphics card does.
    No vs yes
  • No ray tracing
    This graphics card does not support ray tracing, the average graphics card does.
  • Older PCIe version
    This graphics card supports an older PCIe version than the average graphics card (3 vs 4).
    3.0 vs 4.0
  • No AI upscalers
    This graphics card does not support AI upscalers, the average graphics card does.
  • 6 older
    This graphics card was released earlier than the average graphics card (2017 vs 2023).
    March 2017
    2,017 vs 2,023
  • No mesh shaders
    This graphics card does not support mesh shaders, the average graphics card does.
    No vs yes
  • Worse SAM support
    This graphics card offers worse SAM support than the average graphics card (no vs yes).
  • Older DirectX version
    This graphics card supports an older DirectX version than the average graphics card (12 vs 12 Ultimate).
    12 vs 12 Ultimate
  • Older encoder generation
    This graphics card uses an older encoder generation than the average graphics card (6 vs 8). The average graphics card uses encoder generation 8.
    6 vs 8
  • Older OpenCL version
    This graphics card supports an older OpenCL version than the average graphics card (1.2 vs 3).
    1.2 vs 3.0
  • No sampler feedback
    This graphics card does not support sampler feedback, the average graphics card does.
  • 59.7% larger GPU die
    This graphics card has a higher GPU die size than the average graphics card (471 mm² vs 295 mm²). The average graphics card has a GPU die size of 295 mm².
    471 mm² vs 295 mm²
  • 47.6% fewer transistors
    This graphics card has fewer transistors than the average graphics card (12000 million vs 22900 million). The average graphics card has 22900 million transistors.
    12,000 million vs 22,900 million
  • No AV1 encoding
    This graphics card does not support AV1 encoding, the average graphics card does.
  • No AV1 decoding
    This graphics card does not support AV1 decoding, the average graphics card does.
    No vs yes
  • 1 fewer DisplayPort outputs
    This graphics card has fewer DisplayPort outputs than the average graphics card (2 vs 3). The average graphics card has 3 DisplayPort outputs.
    2 vs 3
  • No DSC support
    This graphics card does not support DSC, the average graphics card does.
    No vs yes
  • Older DisplayPort version
    This graphics card supports an older DisplayPort version than the average graphics card (1.4 vs 1.4a).
    1.4 vs 1.4a
  • Narrower decode codec support
    This graphics card supports narrower hardware decode codec support than the average graphics card (H.264/H.265/VP9/MPEG-2/VC-1 vs H.264/H.265/AV1/VP9/MPEG-2/VC-1).
    H.264/H.265/VP9/MPEG-2/VC-1 vs H.264/H.265/AV1/VP9/MPEG-2/VC-1
  • Older HDMI version
    This graphics card supports an older HDMI version than the average graphics card (2.0b vs 2.1).
    2.0b vs 2.1
  • Narrower encode codec support
    This graphics card supports narrower hardware encode codec support than the average graphics card (H.264/H.265/VP9 vs H.264/H.265/AV1/VP9).
    H.264/H.265/VP9 vs H.264/H.265/AV1/VP9
  • Older HDCP version
    This graphics card supports an older HDCP version than the average graphics card (2.2 vs 2.3).
    2.2 vs 2.3
  • Older NVDEC generation
    This graphics card has a lower NVDEC generation than the average graphics card (3 vs 6). The average graphics card offers NVDEC generation 6.
    3 vs 6
  • 2 fewer fans
    This graphics card has fewer fans than the average graphics card (1 vs 3).
    1 vs 3
  • No dual BIOS
    This graphics card does not include dual BIOS, the average graphics card does.
  • No fan stop
    This graphics card does not support fan stop, the average graphics card does.
  • 17 °C higher load temperature
    This graphics card has a higher load temperature than the average graphics card (84 °C vs 67 °C). The average graphics card has a load temperature of 67 °C.
    84 °C vs 67 °C
  • 28 dB noisier at idle
    This graphics card has a higher idle noise level than the average graphics card (28 dB vs 0 dB). The average graphics card has an idle noise level of 0 dB.
    28 dB vs 0 dB
  • 4.6 dB noisier under load
    This graphics card has a higher load noise level than the average graphics card (40 dB vs 35.4 dB). The average graphics card has a load noise level of 35.4 dB.
    40 dB vs 35.4 dB
  • No backplate
    This graphics card does not include a backplate, the average graphics card does.
    No vs yes

Video reviews

Hands-on testing, unboxing, and real-world video evaluations

Expert reviews

In-depth analysis and verdict from leading tech publications

H
hardware.info
17/05/2017
Summary of the review

Third-party reviews

Based on ratings from across the web.
Reviews last updated: June 2026 · How we calculate this

What we like about ASUS Turbo GeForce GTX 1080 Ti

  • High performance for the price, delivering core GTX 1080 Ti speeds
  • Compact blower-style design is ideal for small form factor builds (miniITX, microATX)
  • Exhausts hot air directly out of the chassis, aiding internal system temperatures
  • Dual ball bearing fan offers an extended lifespan and IP5X dust resistance
  • Includes a fully custom PCB with an 8+2 power phase design for stable power delivery
  • Strong overclocking potential when paired with manual fan profiles or aftermarket cooling

What we don't like about ASUS Turbo GeForce GTX 1080 Ti

  • Single-fan blower cooler runs significantly hotter and louder than triple-fan models
  • Prone to thermal throttling under heavy loads due to high operating temperatures (often 80°C+)
  • Lacks a backplate, which some users find reduces aesthetic appeal and structural rigidity
  • No '0dB' fan technology; the fan is always audible even at idle
  • Minimal RGB lighting and plain monochromatic aesthetics compared to premium ROG Strix models
  • Non-reference PCB layout can make finding compatible full-cover water blocks difficult

Verdict

The Asus Turbo GeForce GTX 1080 Ti is a high-performance graphics card built on the NVIDIA Pascal architecture, featuring 3,584 CUDA cores and a massive 11GB of GDDR5X memory on a 352-bit interface. It operates at a base clock of 1,480 MHz with a boost clock of 1,582 MHz, delivering a significant performance leap over standard GTX 1080 models. Its primary characteristic is a space-efficient blower-style cooling system equipped with a dual ball-bearing fan for extended longevity and an IP5X dust-resistance rating. Main pros include its dual-slot design that makes it ideal for smaller form factor builds or multi-GPU SLI configurations, as it effectively exhausts hot air directly out of the chassis. Additionally, its 'VR-ready' design features dual HDMI 2.0 ports for seamless headset connectivity. However, notable cons include its tendency to run hotter and louder under heavy load compared to open-air cooling variants, which may lead to thermal throttling in cases with poor ventilation.

Compare ASUS Turbo GeForce GTX 1080 Ti with other products in the Graphics cards category

1Product to compare no. 1
VS
2Product to compare no. 2
VS
3Product to compare no. 3 (optional)

Graphic comparison of ASUS Turbo GeForce GTX 1080 Ti and other products in the Graphics cards category

No results found