Scored using Projectors Methodology v3.0
Projectors Methodology v3.0
Mathematical & Unbiased Scoring
Products in this category are scored under Frontum Projectors Methodology v3.0: the technical score from the specifications is the base, and independent expert and video reviews (up to ±0.5 points), owner opinions (up to ±0.3) and best-of lists (up to +0.3) move it up or down.
Explore Projectors Methodology v3.0

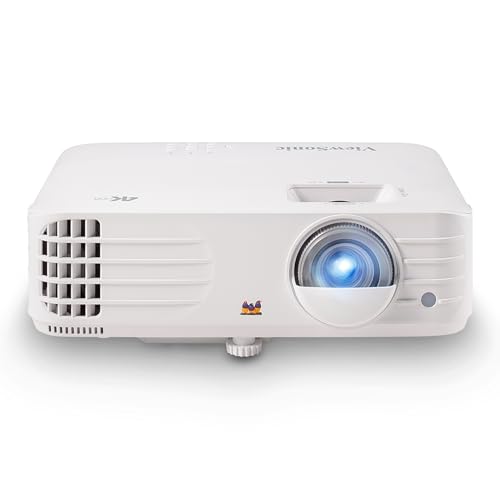
ViewSonic PJD6531W review: 86 specs compared

Avg. price:~£840Native panel resolution:1280x800ANSI lumens:3200Throw ratio:1.5-1.83:1Lamp life:4000 hours

ViewSonic PJD6531W Review: Compare 86 technical specifications and 3 expert reviews to see how this product ranks in the Projectors category and whether it is worth buying.

ViewSonic PJD6531W
6.4/10

Overall score

Score
6.4/ 10
✕
What it is
Our main score for this model, 1–10. It combines specs, best-of lists, expert reviews and owners.
How we count it
Parts: Technical score 35%, List score 30%, Reviews score 25%, Sentiment score 10%
Marks: Each part gets a mark out of 10. For reviews, lists and owners, a typical model in this category gets about 8 and the best one gets 10.
No data yet: A part with no data shows "?". It counts as the mark of a weaker model in this category (4 in 5 models with data score higher). This way, models with reviews, lists and owners usually come out ahead.
Score distribution
▼
<55-66-77-88-99-10
Score components

35%

5.8

Technical score

30%

?

List scoreNot enough data yet, so we use 7.5, the mark of a weaker model in this category

25%

5.8

Reviews score

10%

?

Sentiment scoreNot enough data yet, so we use 6.8, the mark of a weaker model in this category

▼Worse than 88% of projectors
6.3

Value for money

Value for money
6.3/ 10
✕
What it is
An indicator that combines the projector's overall rating with its cost.
When it matters
When you are looking for a projector with a good balance between quality and price.
Score distribution
▼
<55-66-77-88-99-10
Score components

70%

6.4

Overall score

30%

6.1

Price

▼Worse than 71%
5.8

Technical score

Technical score
5.8/ 10
✕
What it is
How good the specs are compared with the other models in this category, 1–10.
How we count it
Areas: We rate the specs in each area against the other models in this category.
Weighting: The areas that matter most to buyers count more. The shares are shown under Score components.
Share: The technical score is 35% of the overall score.
Score distribution
▼
<55-66-77-88-99-10
Score components

42%

6.6

Image Quality

22%

5.2

Projection & Lens

12%

5.0

HDMI & Gaming

10%

6.9

Audio & Features

8%

4.3

Connectivity

6%

4.8

Design & Power

▼Worse than 79%
5.8

Reviews score

Reviews score
5.8/ 10
✕
What it is
Average grade from independent test sites, magazines and video reviewers, 1–10.
How we count it
Grades: Each review's own score is converted to 1–10; without one, we grade the review ourselves. Big test sites count more, short reviews half as much as full tests. A video review counts half.
Score: The average grade is 80% of the review mark; the number of reviews is the other 20% (1 review = 5, the typical number in this category = 8, the most-reviewed model = 10).
Enough data: With few reviews, the average grade is pulled toward the typical grade of this category. No reviews yet: 7.8 for now.
Share: Reviews count 25% of the overall score.
Score distribution
▼
<55-66-77-88-99-10

5.8

Mark 8.0 is below the typical mark 8.2 of this category, so it cannot lift the score above the technical score

80%

8.3

Average grade

20%

6.7

Popularity

Grades by review (3)
3 reviews: 1 with a printed score, 2 estimated from the review. Reviews count 25% of the overall score.
User ratings collected online are not part of this score.
▼Worse than 87%
?

List score

List score
7.5/ 10
✕
What it is
How often independent test sites, magazines and video reviewers put this model in their best-of lists for this category.
How we count it
Points: The model in the most lists of this category gets 10; the others get 8 to 10 in proportion. In no list yet: 7.5. Lists count 30% of the overall score.
Enough data: Every list counts, even a single one. With fewer than 5 best-of lists in the category, this part is left out.
Lists with this model (0)
Not in any best-of list yet, so this part counts as 7.5. Models in a list get 8 to 10.
Not in any best-of list yet
  • viewsonic-pjd6531w
  • viewsonic-pjd6531w
  • viewsonic-pjd6531w
  • viewsonic-pjd6531w
  • viewsonic-pjd6531w
viewsonic-pjd6531w
viewsonic-pjd6531w
viewsonic-pjd6531w
viewsonic-pjd6531w
viewsonic-pjd6531w
Where to buy
*As an Amazon Associate, we earn from qualifying purchases.
Best rankings
Available: ranking among products currently available (including other versions of this product).All: ranking among all products in the database.

What reviewers say about the ViewSonic PJD6531W

Based on 3

Reviewers agree it delivers a bright picture, with no major complaint standing out.
Praised
Pick a topic to see who said what
Loading...
Loading category ranking...

Technical Specifications of projector ViewSonic PJD6531W

Technical score
Technical score
5.8/ 10
✕
What it is
How good the specs are compared with the other models in this category, 1–10.
How we count it
Areas: We rate the specs in each area against the other models in this category.
Weighting: The areas that matter most to buyers count more. The shares are shown under Score components.
Share: The technical score is 35% of the overall score.
Score distribution
▼
<55-66-77-88-99-10
Score components:

42%

6.6

Image Quality

22%

5.2

Projection & Lens

12%

5.0

HDMI & Gaming

10%

6.9

Audio & Features

8%

4.3

Connectivity

6%

4.8

Design & Power

5.8
Reviews score
5.8
List score
?
Value for money
Value for money
6.3/ 10
✕
What it is
An indicator that combines the projector's overall rating with its cost.
When it matters
When you are looking for a projector with a good balance between quality and price.
Score distribution
▼
<55-66-77-88-99-10
Score components:

70%

6.4

Overall score

30%

6.1

Price

6.3
ANSI lumens
3,200
This projector reaches 3,200 ANSI lumens, brighter than 72% of projectors and equal to 2.8% of projectors.
Contrast ratio
3,200:1
This projector has a contrast ratio of 3200:1, lower than 63% of projectors.
Dynamic contrast ratio.
Native panel resolution
1280x800
This projector uses a native resolution of 1280x800, lower than 73.7% of projectors and equal to 8.2% of projectors.
Output resolution
1280x800
This projector supports output resolution up to 1280x800, lower than 74.8% of projectors and equal to 8.4% of projectors.
Projection technology
DLP
Show more
What reviewers say
Throw ratio
1.5-1.83:1
Min throw distance
1.2 m
This projector needs a minimum throw distance of 1.2 m, longer than 62.1% of projectors and equal to 7.4% of projectors.
Max projection size
300 inch
This projector supports projection sizes up to 300 inch, larger than 51.5% of projectors and equal to 38% of projectors.
Zoom ratio
1.2
This projector offers a zoom ratio of 1.2, narrower than 59.8% of projectors and equal to 21.6% of projectors.
Motorized zoom
no
This projector does not have motorised zoom. 14.8% of projectors offer this.
Show more
Input lag
?
Auto low latency mode (ALLM)
no
This projector does not switch to low-latency mode automatically. 16.1% of projectors offer this.
Variable refresh rate (VRR)
no
This projector does not support variable refresh rate. 1.8% of projectors offer this.
HDMI version
1.3
This projector supports HDMI 1.3, older than 89.8% of projectors and equal to 7.3% of projectors.
Max HDMI bandwidth
10.2 Gbps
This projector supports HDMI bandwidth up to 10.2 Gbps, lower than 51.2% of projectors and equal to 46.5% of projectors.
Show more
N. of HDMI ports
1
This projector has 1 HDMI port/s, fewer than 54.2% of projectors and equal to 42.9% of projectors.
Wi-Fi connectivity
no
This projector does not connect to Wi-Fi networks. 53.4% of projectors offer this.
Wi-Fi version
N/A
Bluetooth connectivity
no
This projector does not support Bluetooth. 50.7% of projectors offer this.
Bluetooth version
N/A
Show more
Smart TV features
no
This projector does not have built-in smart TV features. 43.9% of projectors offer this.
Operating system
none
Android OS
no
This projector does not run Android OS. 19.1% of projectors run Android OS.
Dedicated smartphone app
no
This projector does not come with a dedicated smartphone app. 36.8% of projectors come with a dedicated smartphone app.
Remote control
yes
This projector includes a remote control. 1.5% of projectors offer this.
Show more
Light source type
lamp
This projector uses lamp light source technology, less advanced than 66.5% of projectors and equal to 33.5% of projectors.
Laser light source
no
This projector does not have a laser light source. 26.8% of projectors offer this.
Lamp life
4,000 hours
This projector offers lamp life of 4,000 hours, longer than 78.8% of projectors and equal to 9.6% of projectors.
Lamp life (eco mode)
6,000 hours
This projector offers eco-mode lamp life of 6,000 hours, longer than 78.8% of projectors and equal to 7.3% of projectors.
Operating power consumption
?
Show more

ViewSonic PJD6531W vs the average projector

246810TotalImage QualityProjection & LensHDMI & GamingConnectivityAudio & FeaturesDesign & Power
  • 45.5% brighter image
    This projector has higher ANSI lumens than the average projector (3,200 vs 2,200). The average projector has 2,200 ANSI lumens.
    3,200 vs 2,200
  • 2 more audio input ports
    This projector has more audio input ports than the average projector (2 vs 0). The average projector has 0 audio input ports.
    2 vs 0
  • 10 degrees more vertical correction
    This projector offers more vertical keystone correction than the average projector (40 degrees vs 30 degrees). The average projector offers vertical keystone correction of 30 degrees.
    40 degrees vs 30 degrees
  • Includes stereo speakers
    This projector has stereo speakers, while the average projector does not. 47.8% of projectors have stereo speakers.
  • Wider color gamut
    This projector has a higher color gamut coverage than the average projector (70% NTSC % vs 99% Rec.709 %). The average projector has 99% Rec.709 % of color gamut coverage.
    70% NTSC % vs 99% Rec.709 %
  • 0.18 inch larger DMD chip
    This projector has a higher DMD chip size than the average projector (0.7 inch vs 0.47 inch). The average projector has 0.47 inch of DMD chip size.
    0.65 inch vs 0.47 inch
  • 41.2% higher refresh rate
    This projector has a higher refresh rate than the average projector (120 Hz vs 85 Hz). The average projector has 85 Hz of refresh rate.
    120 Hz vs 85 Hz
  • 1 more RJ45 ports
    This projector has more RJ45 ports than the average projector (1 vs 0). The average projector has 0 RJ45 ports.
    1 vs 0
  • 45.5% brighter image
    This projector has higher ANSI lumens than the average projector (3,200 vs 2,200). The average projector has 2,200 ANSI lumens.
    3,200 vs 2,200
  • Wider color gamut
    This projector has a higher color gamut coverage than the average projector (70% NTSC % vs 99% Rec.709 %). The average projector has 99% Rec.709 % of color gamut coverage.
    70% NTSC % vs 99% Rec.709 %
  • 0.18 inch larger DMD chip
    This projector has a higher DMD chip size than the average projector (0.7 inch vs 0.47 inch). The average projector has 0.47 inch of DMD chip size.
    0.65 inch vs 0.47 inch
  • 41.2% higher refresh rate
    This projector has a higher refresh rate than the average projector (120 Hz vs 85 Hz). The average projector has 85 Hz of refresh rate.
    120 Hz vs 85 Hz
  • 10 degrees more vertical correction
    This projector offers more vertical keystone correction than the average projector (40 degrees vs 30 degrees). The average projector offers vertical keystone correction of 30 degrees.
    40 degrees vs 30 degrees
  • 50 inch larger image size
    This projector has a higher projection size than the average projector (300 inch vs 250 inch). The average projector has 250 inch of projection size.
    300 inch vs 250 inch
  • 1 more RJ45 ports
    This projector has more RJ45 ports than the average projector (1 vs 0). The average projector has 0 RJ45 ports.
    1 vs 0
  • VGA input included
    This projector supports VGA input, while the average projector does not. 44.1% of projectors support VGA input.
  • 2 more audio input ports
    This projector has more audio input ports than the average projector (2 vs 0). The average projector has 0 audio input ports.
    2 vs 0
  • Includes stereo speakers
    This projector has stereo speakers, while the average projector does not. 47.8% of projectors have stereo speakers.
  • 2 dB quieter operation
    This projector has a lower audible noise than the average projector (29 dB vs 31 dB). The average projector has 31 dB of audible noise.
    Eco mode figure.
    29 dB vs 31 dB
  • Limited HDMI format
    This projector supports a less capable max HDMI input format than the average projector (1080p/60Hz vs 4K/120Hz). The average projector supports a max HDMI input format of 4K/120Hz.
    1080p/60Hz vs 4K/120Hz
  • Basic light source
    This projector has Basic light source than the average projector (lamp vs laser). The average projector uses a laser light source.
    lamp vs laser
  • No HDR10 support
    This projector does not support HDR10, while the average projector does. 57.6% of projectors support HDR10.
  • 1 fewer HDMI ports
    This projector has fewer HDMI ports than the average projector (1 vs 2). The average projector has 2 HDMI ports.
    1 vs 2
  • 2 bit lower color depth
    This projector has a lower color depth than the average projector (8 bit vs 10 bit). The average projector has 10 bit of color depth.
    8 bit vs 10 bit
  • Older HDMI version
    This projector has Old HDMI standard than the average projector (1.3 vs 2). The average projector supports HDMI 2.
    1.3 vs 2
  • Low native resolution
    This projector has a lower native panel resolution than the average projector (1280x800 vs 1920x1080). The average projector has a native panel resolution of 1920x1080.
    1280x800 vs 1920x1080
  • Lower output resolution
    This projector supports a lower output resolution than the average projector (1280x800 vs 1920x1080). The average projector outputs at 1920x1080 resolution.
    1280x800 vs 1920x1080
  • 21.6% lower review score
    Reviews score
    5.8/ 10
    ✕
    What it is
    Average grade from independent test sites, magazines and video reviewers, 1–10.
    How we count it
    Grades: Each review's own score is converted to 1–10; without one, we grade the review ourselves. Big test sites count more, short reviews half as much as full tests. A video review counts half.
    Score: The average grade is 80% of the review mark; the number of reviews is the other 20% (1 review = 5, the typical number in this category = 8, the most-reviewed model = 10).
    Enough data: With few reviews, the average grade is pulled toward the typical grade of this category. No reviews yet: 7.8 for now.
    Share: Reviews count 25% of the overall score.
    Score distribution
    ▼
    <55-66-77-88-99-10

    5.8

    Mark 8.0 is below the typical mark 8.2 of this category, so it cannot lift the score above the technical score

    80%

    8.3

    Average grade

    20%

    6.7

    Popularity

    Grades by review (3)
    3 reviews: 1 with a printed score, 2 estimated from the review. Reviews count 25% of the overall score.
    User ratings collected online are not part of this score.
    5.8 vs 7.4
  • 9.8% worse value for money
    ViewSonic PJD6531W has a lower value-for-money score than the average projector (6.33 vs 6.9).
    6.33 vs 6.95
  • No HDR10 support
    This projector does not support HDR10, while the average projector does. 57.6% of projectors support HDR10.
  • 2 bit lower color depth
    This projector has a lower color depth than the average projector (8 bit vs 10 bit). The average projector has 10 bit of color depth.
    8 bit vs 10 bit
  • Low native resolution
    This projector has a lower native panel resolution than the average projector (1280x800 vs 1920x1080). The average projector has a native panel resolution of 1920x1080.
    1280x800 vs 1920x1080
  • Lower output resolution
    This projector supports a lower output resolution than the average projector (1280x800 vs 1920x1080). The average projector outputs at 1920x1080 resolution.
    1280x800 vs 1920x1080
  • 11 earlier release
    This projector was released earlier than the average projector (2010 vs 2021). The average projector was released in 2021.
    February 2010
    2010 vs 2021
  • Lower contrast ratio
    This projector has a lower contrast ratio than the average projector (3200:1 vs 10000:1). The average projector has 10000:1 of contrast ratio.
    Dynamic contrast ratio.
    3,200:1 vs 10,000:1
  • 30 degrees less horizontal correction
    This projector offers less horizontal keystone correction than the average projector (0 degrees vs 30 degrees). The average projector offers horizontal keystone correction of 30 degrees.
    0 degrees vs 30 degrees
  • 0.19 m longer throw distance
    This projector has a higher throw distance than the average projector (1.2 m vs 1 m). The average projector has 1.0055 m of throw distance.
    1.2 m vs 1.0055 m
  • 0.1 2x narrower zoom range
    This projector has a lower zoom ratio than the average projector (1.2 vs 1.3). The average projector has 1.3 of zoom ratio.
    1.2 vs 1.3
  • Limited HDMI format
    This projector supports a less capable max HDMI input format than the average projector (1080p/60Hz vs 4K/120Hz). The average projector supports a max HDMI input format of 4K/120Hz.
    1080p/60Hz vs 4K/120Hz
  • Older HDMI version
    This projector has Old HDMI standard than the average projector (1.3 vs 2). The average projector supports HDMI 2.
    1.3 vs 2
  • 43.3% lower HDMI bandwidth
    This projector has a lower HDMI bandwidth than the average projector (10.2 Gbps vs 18 Gbps). The average projector has 18 Gbps of HDMI bandwidth.
    10.2 Gbps vs 18 Gbps
  • More outdated HDCP support
    This projector supports an older HDCP version than the average projector (1.3 vs 2.2).
    Different digital inputs use HDCP 1.3 and 1.1.
    1.3 vs 2.2
  • 1 fewer HDMI ports
    This projector has fewer HDMI ports than the average projector (1 vs 2). The average projector has 2 HDMI ports.
    1 vs 2
  • No Wi-Fi connectivity
    This projector does not connect to Wi-Fi networks, while the average projector does. 53.4% of projectors offer this.
  • No Bluetooth connectivity
    This projector does not support Bluetooth, while the average projector does. 50.6% of projectors offer this.
  • Basic light source
    This projector has Basic light source than the average projector (lamp vs laser). The average projector uses a laser light source.
    lamp vs laser
  • 16,000 hours shorter lamp life
    This projector has a lower lamp life than the average projector (4,000 hours vs 20,000 hours). The average projector has 20,000 hours of lamp life.
    4,000 hours vs 20,000 hours
  • 14,000 hours shorter eco lamp life
    This projector has a lower lamp life in eco mode than the average projector (6,000 hours vs 20,000 hours). The average projector has 20,000 hours of lamp life in eco mode.
    6,000 hours vs 20,000 hours
  • 1 dB louder eco mode
    This projector has a higher audible noise in eco mode than the average projector (29 dB vs 28 dB). The average projector has 28 dB of audible noise in eco mode.
    Eco mode figure.
    29 dB vs 28 dB
  • 0.5 W higher standby power
    This projector uses more standby power than the average projector (1 W vs 0.5 W). The average projector uses 0.5 W of standby power.
    1 W vs 0.5 W
  • 68 mm thicker body
    This projector is thicker than the average projector (218 mm vs 150 mm). The average projector has a thickness of 150 mm.
    218 mm vs 150 mm

Video reviews

Hands-on testing, unboxing, and real-world video evaluations

Overview video
Not graded

Expert reviews

In-depth analysis and verdict from leading tech publications

8.0
reviewed.com
≈ estimated
09/07/2010
Lab test · Color and brightness
Verdict
The ViewSonic PJD6531w is bright with good color once calibrated, but its blues look violet and it struggles under office lighting.
9.0
pcquest.com
≈ estimated
05/01/2011
Hands-on review · Movies and games
Verdict
The ViewSonic PJD6531w is very bright, with blur-free motion and rich color for movies and games, though it takes about 30 seconds to show a picture.
7.0
uk.pcmag.com
✓ explicit
19/08/2011
Hands-on review · Office and video
Verdict
The ViewSonic PJD6531w is a compact, fairly bright projector with solid picture quality and a three-year warranty, but it cannot play presentations from a USB drive.

Third-party reviews

What customers like about ViewSonic PJD6531W

  • High brightness (rated at 3,200 lumens) suitable for well-lit rooms
  • Solid image quality for both data and video content
  • 3D-ready capability with 120Hz refresh rate
  • Extensive connectivity options including HDMI, VGA, and RJ45
  • Compact and easily portable design including a carrying case
  • Long lamp life rated up to 6,000 hours in certain modes
  • Good value for money compared to similarly priced models

What customers don't like about ViewSonic PJD6531W

  • Audible fan noise can be loud during operation
  • Generates a significant amount of heat during use
  • Faint audio quality from the built-in 5W speakers
  • Lack of USB port for direct presentations from thumb drives
  • Susceptible to the 'rainbow effect' common in DLP projectors
  • Noticeable image stretching when fitting 720p content to native 16:10 resolution
  • Reported compatibility issues with newer Nvidia 3D drivers

Verdict

The ViewSonic PJD6531w is a high-brightness WXGA (1280x800) DLP projector featuring 3,200 ANSI lumens, a 3200:1 contrast ratio, and a native 16:10 aspect ratio. It stands out with its 120Hz refresh rate and 3D-ready capabilities, supporting various signals from 480p up to 1080p. Key pros include its versatile connectivity—including HDMI, dual VGA, and RJ-45 for network control—as well as integrated 10W speakers and a relatively long lamp life of up to 6,000 hours in Eco mode. However, notable cons include its bulkier 5.9 lb frame compared to similar portable units, lack of a USB port for standalone presentations, a measured 'rainbow effect' common in DLP models, and significant fan noise and heat output during standard operation.

Compare ViewSonic PJD6531W with other products in the Projectors category

1Product to compare no. 1
VS
2Product to compare no. 2
VS
3Product to compare no. 3 (optional)

Graphic comparison of ViewSonic PJD6531W and other products in the Projectors category

No results found