Scored using Processors Methodology v3.0
Processors Methodology v3.0
Mathematical & Unbiased Scoring
Products in this category are scored under Frontum Processors Methodology v3.0: the technical score from the specifications is the base, and independent expert and video reviews (up to ±0.5 points), owner opinions (up to ±0.3) and best-of lists (up to +0.3) move it up or down.
Explore Processors Methodology v3.0

AMD Ryzen 9 7945HX3D review: 74 specs compared

Avg. price:~£2,730PassMark multi-core score:57779N. of physical cores:16CPU boost clock speed:5.4 GHzCPU socket:FL1TDP (Thermal design power):55 W

AMD Ryzen 9 7945HX3D Review: Compare 74 technical specifications, 10 expert and video reviews and 1 best-of list to see how this product ranks in the Processors category and whether it is worth buying.
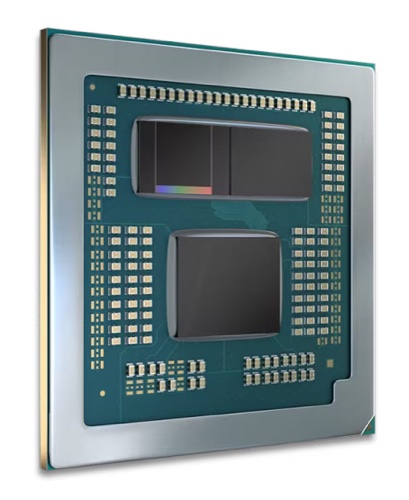
AMD Ryzen 9 7945HX3D
8.4/10

Overall score

Score
8.4/ 10
✕
What it is
Our main score for this model, 1–10. It combines specs, expert reviews, best-of lists and owners.
How we count it
Parts: Technical score 40%, Reviews score 25%, List score 25%, Sentiment score 10%
Marks: Each part gets a mark out of 10. For reviews, lists and owners, a typical model in this category gets about 8 and the best one gets 10.
No data yet: A part with no data shows "?". It counts as the mark of a weaker model in this category (4 in 5 models with data score higher). This way, models with reviews, lists and owners usually come out ahead.
Score distribution
▼
<55-66-77-88-99-10
Score components

40%

9.1

Technical score

25%

8.2

Reviews score

25%

8.0

List score

10%

?

Sentiment scoreNot enough data yet, so we use 7.0, the mark of a weaker model in this category

★Better than 99% of processors
6.2

Value for money

Value for money
6.2/ 10
✕
What it is
An indicator that combines the processor's overall rating with its cost.
When it matters
When you are looking for a processor with a good balance between performance, efficiency, and price.
Score distribution
▼
<55-66-77-88-99-10
Score components

70%

8.4

Overall score

30%

1.0

Price

▼Worse than 94%
9.1

Technical score

Technical score
9.1/ 10
✕
What it is
How good the specs are compared with the other models in this category, 1–10.
How we count it
Areas: We rate the specs in each area against the other models in this category.
Weighting: The areas that matter most to buyers count more. The shares are shown under Score components.
Share: The technical score is 40% of the overall score.
Score distribution
▼
<55-66-77-88-99-10
Score components

60%

9.5

Performance

18%

9.2

Architecture

10%

8.3

Memory & PCIe

7%

6.4

Power & Thermal

4%

8.6

Platform

1%

7.9

Integrated graphics

★Better than 99%
8.2

Reviews score

Reviews score
8.2/ 10
✕
What it is
Average grade from independent test sites, magazines and video reviewers, 1–10.
How we count it
Grades: Each review's own score is converted to 1–10; without one, we grade the review ourselves. Big test sites count more, short reviews half as much as full tests. A video review counts half.
Score: The average grade is 80% of the review mark; the number of reviews is the other 20% (1 review = 5, the typical number in this category = 8, the most-reviewed model = 10).
Enough data: With few reviews, the average grade is pulled toward the typical grade of this category. No reviews yet: 7.2 for now.
Share: Reviews count 25% of the overall score.
Score distribution
▼
<55-66-77-88-99-10

80%

8.1

Average grade

20%

8.7

Popularity

Grades by review (10)
7 reviews: 3 with a printed score, 4 estimated from the review. 3 video reviews, each counting half as much as a written test. Reviews count 25% of the overall score.
User ratings collected online are not part of this score.
▲Better than 83%
8.0

List score

List score
8.0/ 10
✕
What it is
How often independent test sites, magazines and video reviewers put this model in their best-of lists for this category.
How we count it
Points: The model in the most lists of this category gets 10; the others get 8 to 10 in proportion. In no list yet: 7.5. Lists count 25% of the overall score.
Enough data: Every list counts, even a single one. With fewer than 5 best-of lists in the category, this part is left out.
Lists with this model (1)
List score: in 1 of 85 lists (1%)
▲Better than 89%
  • amd-ryzen-9-7945hx3d
amd-ryzen-9-7945hx3d
Where to buy
    N/A~ £2,730
Best rankings
Available: ranking among products currently available (including other versions of this product).All: ranking among all products in the database.

What reviewers say about the AMD Ryzen 9 7945HX3D

Based on 5 · 3

Reviewers agree overall performance is excellent, but find it bulky, heavy and expensive, with gaming results splitting opinion.
Praised
Mixed views
Criticised
Pick a topic to see who said what
Loading...
Loading category ranking...

Technical Specifications of processor AMD Ryzen 9 7945HX3D

Technical score
Technical score
9.1/ 10
✕
What it is
How good the specs are compared with the other models in this category, 1–10.
How we count it
Areas: We rate the specs in each area against the other models in this category.
Weighting: The areas that matter most to buyers count more. The shares are shown under Score components.
Share: The technical score is 40% of the overall score.
Score distribution
▼
<55-66-77-88-99-10
Score components:

60%

9.5

Performance

18%

9.2

Architecture

10%

8.3

Memory & PCIe

7%

6.4

Power & Thermal

4%

8.6

Platform

1%

7.9

Integrated graphics

9.1
Reviews score
8.2
List score
8.0
Value for money
Value for money
6.2/ 10
✕
What it is
An indicator that combines the processor's overall rating with its cost.
When it matters
When you are looking for a processor with a good balance between performance, efficiency, and price.
Score distribution
▼
<55-66-77-88-99-10
Score components:

70%

8.4

Overall score

30%

1.0

Price

6.2
Processor type
mobile
This processor belongs to the mobile processor class, which is more advanced than that of 6.9% of processors and equal to that of 47.7% of processors.
CPU socket
FL1
This processor uses the FL1 CPU socket, which is older than that of 63.2% of processors and equal to that of 1% of processors.
Chipset
X870E, X870, B850, B840, X670E, X670, B650E, B650, A620
This processor supports X870E, X870, B850, B840, X670E, X670, B650E, B650, A620 chipsets, which is broader compatibility than 92% of processors and equal to that of 3.3% of processors.
CPU architecture
x86-64
This processor uses the x86-64 architecture, which is more advanced than that of 1.8% of processors and equal to that of 98.2% of processors.
Instruction sets
MMX, SSE, SSE2, SSE3, SSSE3, SSE4A, SSE4.1, SSE4.2, AVX, AVX2, AVX-512, FMA3, AES, SHA, AMD-V
This processor supports MMX, SSE, SSE2, SSE3, SSSE3, SSE4A, SSE4.1, SSE4.2, AVX, AVX2, AVX-512, FMA3, AES, SHA, AMD-V instruction sets, which is broader support than 69.3% of processors and equal to that of 7.1% of processors.
Show more
N. of physical cores
16
This processor has 16 CPU cores, which is more than 90% of processors and equal to 4.6% of processors.
CPU threads
32
This processor offers 32 CPU threads, which is more than 94.9% of processors and equal to 3.2% of processors.
CPU boost clock speed
5.4 GHz
This processor reaches a boost clock of 5.4 GHz which is higher than that of 94.3% of processors and equal to that of 2.6% of processors.
CPU base clock speed
16x 2.3 GHz
This processor has a base clock of 16x2.3 GHz which is higher than that of 89.7% of processors.
PassMark multi-core score
57,779
This processor scores 57,779 in PassMark, which is higher than 97.1% of processors.
Show more
What reviewers say
Semiconductor size
5 nm
This processor uses a 5 nm process node, which is more advanced than that of 83.5% of processors and equal to that of 3.2% of processors.
Foundry
TSMC 5 nm
This processor is built on the TSMC 5 nm foundry process, which is more advanced than that of 83.1% of processors and equal to that of 3.2% of processors.
L3 cache
128 MB
This processor has an L3 cache of 128 MB which is larger than that of 98% of processors and equal to that of 1.3% of processors.
L2 cache
16 MB
This processor has an L2 cache of 16 MB which is larger than that of 88.4% of processors and equal to that of 3.1% of processors.
L1 cache
1,024 KB
This processor has an L1 cache of 1,024 KB which is larger than that of 85.7% of processors and equal to that of 1.5% of processors.
Show more
DDR memory version
DDR5
This processor supports DDR DDR5, which is newer than that of 64.2% of processors and equal to that of 12.8% of processors.
Maximum memory speed
5,200 MHz
This processor supports memory speeds up to 5,200 MHz, which is higher than that of 70.6% of processors and equal to 6.6% of processors.
Max memory speed (JEDEC)
DDR5-5200 MHz
This processor supports JEDEC memory speeds up to DDR5-5200 MHz, which is higher than that of 71% of processors and equal to 5.6% of processors.
Max memory speed (XMP / EXPO)
5,200 MHz
This processor supports XMP/EXPO memory speeds up to 5,200 MHz, which is higher than that of 94.7% of processors and equal to 1.4% of processors.
Maximum memory capacity
64 GB
This processor supports up to 64 GB of memory, which is more than 27.2% of processors and equal to 26.1% of processors.
Show more
Integrated graphics
yes
This processor includes integrated graphics. 14.7% of processors offer this.
Integrated GPU model
Radeon 610M
This processor uses the Radeon 610M integrated GPU, which is more advanced than that in 88.9% of processors and equal to that in 1.9% of processors.
Integrated GPU execution units
2
This processor has 2 GPU execution units, which is fewer than 95.5% of processors and equal to 4.5% of processors.
Integrated GPU base frequency
400 MHz
This processor has an integrated GPU clock of 400 MHz which is higher than that of 68.4% of processors and equal to that of 8.3% of processors.
Integrated media encoders/decoders
H.264 (HW decode/encode), H.265 (HW decode/encode), VP9 (HW decode), AV1 (HW decode)
This processor supports H.264 (HW decode/encode), H.265 (HW decode/encode), VP9 (HW decode), AV1 (HW decode) media codecs, which is broader support than 82.1% of processors and equal to 3.1% of processors.
Show more
TDP (Thermal design power)
55 W
This processor has a TDP of 55 W which is higher than that of 61.7% of processors and equal to that of 4.2% of processors.
Base power (PL1)
55 W
This processor has a base power of 55 W which is higher than that of 61.8% of processors and equal to that of 4.3% of processors.
Boost power (PL2)
?
Tau (power duration limit)
N/A
Configurable TDP
yes
This processor supports configurable TDP. 46.4% of processors offer this.
Show more

AMD Ryzen 9 7945HX3D vs the average processor

246810TotalPlatformPerformanceArchitectureMemory & PCIeIntegrated graphicsPower & Thermal
  • 5.04x higher PassMark score
    This processor has a higher PassMark benchmark score than the average processor (57,779 vs 11,469). The average processor scores 11,469 in PassMark benchmark.
    57,779 vs 11,469
  • 3.09x higher multi-core score
    This processor has a higher Geekbench 6 multi-core score than the average processor (16,080 vs 5,209). The average processor scores 5,209 in Geekbench 6 multi-core.
    16,080 vs 5,209
  • 10 more CPU cores
    This processor has more CPU cores than the average processor (16 vs 6). The average processor has 6 CPU cores.
    16 vs 6
  • 4.65x better multi-core performance
    This processor has a higher multi-core performance than the average processor (13,036 vs 2,804.5). The average processor scores 2,804.5 in Cinebench R20 multi-core.
    13,036 vs 2,804.5
  • 12 more performance cores
    This processor has more performance cores than the average processor (16 vs 4). The average processor has 4 performance cores.
    16 vs 4
  • More advanced microarchitecture
    This processor uses a more advanced microarchitecture than the average processor (Dragon Range vs Kaby Lake).
    Dragon Range vs Kaby Lake
  • 58.9% better single-core performance
    This processor has a higher PassMark single-core score than the average processor (4,064 vs 2,558). The average processor scores 2,558 in PassMark single-core.
    4,064 vs 2,558
  • 24 more CPU threads
    This processor has more CPU threads than the average processor (32 vs 8). The average processor has 8 CPU threads.
    32 vs 8
  • 22.4% higher review score
    Reviews score
    8.2/ 10
    ✕
    What it is
    Average grade from independent test sites, magazines and video reviewers, 1–10.
    How we count it
    Grades: Each review's own score is converted to 1–10; without one, we grade the review ourselves. Big test sites count more, short reviews half as much as full tests. A video review counts half.
    Score: The average grade is 80% of the review mark; the number of reviews is the other 20% (1 review = 5, the typical number in this category = 8, the most-reviewed model = 10).
    Enough data: With few reviews, the average grade is pulled toward the typical grade of this category. No reviews yet: 7.2 for now.
    Share: Reviews count 25% of the overall score.
    Score distribution
    ▼
    <55-66-77-88-99-10

    80%

    8.1

    Average grade

    20%

    8.7

    Popularity

    Grades by review (10)
    7 reviews: 3 with a printed score, 4 estimated from the review. 3 video reviews, each counting half as much as a written test. Reviews count 25% of the overall score.
    User ratings collected online are not part of this score.
    8.2 vs 6.7
  • 3 years newer release date
    This processor has a newer release date than the average processor (2023 vs 2020).
    August 2023
    2023 vs 2020
  • 5.04x higher PassMark score
    This processor has a higher PassMark benchmark score than the average processor (57,779 vs 11,469). The average processor scores 11,469 in PassMark benchmark.
    57,779 vs 11,469
  • 3.09x higher multi-core score
    This processor has a higher Geekbench 6 multi-core score than the average processor (16,080 vs 5,209). The average processor scores 5,209 in Geekbench 6 multi-core.
    16,080 vs 5,209
  • 10 more CPU cores
    This processor has more CPU cores than the average processor (16 vs 6). The average processor has 6 CPU cores.
    16 vs 6
  • 4.65x better multi-core performance
    This processor has a higher multi-core performance than the average processor (13,036 vs 2,804.5). The average processor scores 2,804.5 in Cinebench R20 multi-core.
    13,036 vs 2,804.5
  • 12 more performance cores
    This processor has more performance cores than the average processor (16 vs 4). The average processor has 4 performance cores.
    16 vs 4
  • 58.9% better single-core performance
    This processor has a higher PassMark single-core score than the average processor (4,064 vs 2,558). The average processor scores 2,558 in PassMark single-core.
    4,064 vs 2,558
  • 24 more CPU threads
    This processor has more CPU threads than the average processor (32 vs 8). The average processor has 8 CPU threads.
    32 vs 8
  • 81.3% higher single-core score
    This processor has a higher Geekbench 6 single-core score than the average processor (2,783 vs 1,535). The average processor scores 1,535 in Geekbench 6 single-core.
    2,783 vs 1,535
  • 22.7% higher boost clock
    This processor has a higher boost clock speed than the average processor (5.4 GHz vs 4.4 GHz). The average processor reaches boost clock speed of 4.4 GHz.
    5.4 GHz vs 4.4 GHz
  • 52.4% higher Cinebench R20 single-core score
    This processor has a higher Cinebench R20 single-core score than the average processor (747 vs 490). The average processor scores 490 in Cinebench R20 single-core.
    747 vs 490
  • Unlocked for overclocking
    This processor has an unlocked multiplier, while the average processor does not. 22.6% of processors offer this.
  • Higher base clock
    This processor has a higher base clock than the average processor (16x2.3 GHz vs 4x3.4 GHz).
    16x2.3 GHz vs 4x3.4 GHz
  • 2 wider front-end design
    This processor has a higher front-end width than the average processor (6 vs 4). The average processor uses front-end width of 4.
    6 vs 4
  • 2x higher bus transfer rate
    This processor has a higher bus transfer rate than the average processor (16 GT/s vs 8 GT/s). The average processor offers bus transfer rate of 8 GT/s.
    16 GT/s vs 8 GT/s
  • More advanced microarchitecture
    This processor uses a more advanced microarchitecture than the average processor (Dragon Range vs Kaby Lake).
    Dragon Range vs Kaby Lake
  • 14.22x larger L3 cache
    This processor has a higher L3 cache than the average processor (128 MB vs 9 MB). The average processor has L3 cache of 9 MB.
    128 MB vs 9 MB
  • 5.33x larger L2 cache
    This processor has a higher L2 cache than the average processor (16 MB vs 3 MB). The average processor has L2 cache of 3 MB.
    16 MB vs 3 MB
  • 4.32x more L3 per core
    This processor has more L3 cache per core than the average processor (8 MB/core vs 1.85 MB/core). The average processor provides 1.85 MB/core of L3 cache per core.
    8 MB/core vs 1.85 MB/core
  • Supports stacked cache
    This processor has stacked 3D cache, while the average processor does not. 1.1% of processors offer this.
  • 58.3% smaller process node
    This processor has a lower process node than the average processor (5 nm vs 12 nm). The average processor uses a process node of 12 nm.
    5 nm vs 12 nm
  • 59.9% smaller die size
    This processor has a lower die size than the average processor (71 mm² vs 177 mm²). The average processor has a die size of 177 mm².
    71 mm² vs 177 mm²
  • 2.67x larger L1 cache
    This processor has a higher L1 cache than the average processor (1,024 KB vs 384 KB). The average processor has L1 cache of 384 KB.
    1,024 KB vs 384 KB
  • More advanced foundry
    This processor uses a more advanced foundry process than the average processor (TSMC 5 nm vs Intel 14 nm).
    TSMC 5 nm vs Intel 14 nm
  • 2x more L2 per core
    This processor has more L2 cache per core than the average processor (1 MB/core vs 0.5 MB/core). The average processor provides 0.5 MB/core of L2 cache per core.
    1 MB/core vs 0.5 MB/core
  • 3.6x more transistors
    This processor has more transistors than the average processor (17.8 billion vs 4.95 billion). The average processor has 4.95 billion transistors.
    17.84 billion vs 4.95 billion
  • 12 more PCIe lanes
    This processor has more PCIe lanes than the average processor (28 vs 16). The average processor offers 16 PCIe lanes.
    28 vs 16
  • Newer PCIe version
    This processor supports a newer PCIe version than the average processor (5 vs 3).
    5 vs 3
  • Supports memory overclocking
    This processor supports memory overclocking, while the average processor does not. 43.9% of processors support memory overclocking.
  • 77.4% higher memory bandwidth
    This processor has a higher memory bandwidth than the average processor (83.2 GB/s vs 46.9 GB/s). The average processor offers memory bandwidth of 46.9 GB/s.
    83.2 GB/s vs 46.9 GB/s
  • Newer DDR support
    This processor supports a newer DDR generation than the average processor (DDR5 vs DDR4).
    DDR5 vs DDR4
  • 62.5% higher memory speed
    This processor has a higher maximum memory speed than the average processor (5,200 MHz vs 3,200 MHz). The average processor supports memory speed of 3,200 MHz.
    5,200 MHz vs 3,200 MHz
  • Higher JEDEC memory speed
    This processor has a higher JEDEC memory speed than the average processor (DDR5-5200 MHz vs DDR4-3200 MHz). The average processor supports JEDEC memory speed of DDR4-3200 MHz.
    DDR5-5,200 MHz vs DDR4-3,200 MHz
  • Better integrated GPU
    This processor uses a better integrated GPU than the average processor (Radeon 610M vs Intel UHD Graphics 630).
    Radeon 610M vs Intel UHD Graphics 630
  • 1 more supported displays
    This processor has more supported displays than the average processor (4 vs 3). The average processor supports 3 displays.
    4 vs 3
  • Weaker security extensions
    This processor provides less advanced security extensions than the average processor (AES-NI, SHA, SMAP, SMEP, Secure Processor, GMET vs AES-NI, NX bit, Secure Key, TXT, OS Guard, Boot Guard, CET, MBEC, TME, TME-MK).
    AES-NI, SHA, SMAP, SMEP, Secure Processor, GMET vs AES-NI, NX bit, Secure Key, TXT, OS Guard, Boot Guard, CET, MBEC, TME, TME-MK
  • 11 °C lower temperature limit
    This processor has a lower temperature limit than the average processor (89 °C vs 100 °C). The average processor can run up to 100 °C.
    89 °C vs 100 °C
  • 10.92x more expensive
    AMD Ryzen 9 7945HX3D is more expensive than the average processor (£2,730 vs £250).
    £2,730 vs £250
  • 17.8% worse value for money
    AMD Ryzen 9 7945HX3D has worse value for money than the average processor (6.18 vs 7.3).
    6.18 vs 7.29
  • 91.7% fewer GPU execution units
    This processor has fewer GPU execution units than the average processor (2 vs 24). The average processor has 24 GPU execution units.
    2 vs 24
  • 22.2% higher base power
    This processor has a higher base power draw than the average processor (55 W vs 45 W). The average processor has a base power draw of 45 W.
    55 W vs 45 W
  • Limited PCIe bifurcation
    This processor supports less flexible PCIe bifurcation than the average processor (x16, x8/x8, x8/x4/x4 vs x16, x8/x8, x4/x4/x4/x4).
    x16, x8/x8, x8/x4/x4 vs x16, x8/x8, x4/x4/x4/x4
  • Older TPM support
    This processor supports an older TPM version than the average processor (fTPM 2 vs PTT 2).
    fTPM 2.0 vs PTT 2.0
  • 10.92x more expensive
    AMD Ryzen 9 7945HX3D is more expensive than the average processor (£2,730 vs £250).
    £2,730 vs £250
  • 17.8% worse value for money
    AMD Ryzen 9 7945HX3D has worse value for money than the average processor (6.18 vs 7.3).
    6.18 vs 7.29
  • Weaker security extensions
    This processor provides less advanced security extensions than the average processor (AES-NI, SHA, SMAP, SMEP, Secure Processor, GMET vs AES-NI, NX bit, Secure Key, TXT, OS Guard, Boot Guard, CET, MBEC, TME, TME-MK).
    AES-NI, SHA, SMAP, SMEP, Secure Processor, GMET vs AES-NI, NX bit, Secure Key, TXT, OS Guard, Boot Guard, CET, MBEC, TME, TME-MK
  • Older TPM support
    This processor supports an older TPM version than the average processor (fTPM 2 vs PTT 2).
    fTPM 2.0 vs PTT 2.0
  • Limited PCIe bifurcation
    This processor supports less flexible PCIe bifurcation than the average processor (x16, x8/x8, x8/x4/x4 vs x16, x8/x8, x4/x4/x4/x4).
    x16, x8/x8, x8/x4/x4 vs x16, x8/x8, x4/x4/x4/x4
  • 91.7% fewer GPU execution units
    This processor has fewer GPU execution units than the average processor (2 vs 24). The average processor has 24 GPU execution units.
    2 vs 24
  • 11 °C lower temperature limit
    This processor has a lower temperature limit than the average processor (89 °C vs 100 °C). The average processor can run up to 100 °C.
    89 °C vs 100 °C
  • 22.2% higher base power
    This processor has a higher base power draw than the average processor (55 W vs 45 W). The average processor has a base power draw of 45 W.
    55 W vs 45 W
  • 22.2% higher TDP
    This processor has a higher TDP than the average processor (55 W vs 45 W). The average processor has a TDP of 45 W.
    55 W vs 45 W

Video reviews

Hands-on testing, unboxing, and real-world video evaluations

8.0
Hardware Busters
≈ estimated
23/08/2023
Hands-on laptop review · performance, noise, power and battery tests
Verdict
AMD Ryzen 9 7945HX3D is a fast gaming CPU, but it is expensive, loud and prone to power spikes, so it is not for everyone.
9.0
Matthew Moniz
≈ estimated
22/08/2023
Hands-on laptop review · gaming, benchmark and temperature tests
Verdict
AMD Ryzen 9 7945HX3D is the fastest gaming laptop tested, worth it only if the price premium stays small.
5.0
Thirdstring Tech
≈ estimated
24/06/2025
Comparison · game benchmarks against the 5800X3D
Verdict
AMD Ryzen 9 7945HX3D impresses for a laptop chip, but it is poor value for a gaming-only build next to mainstream desktop CPUs.
Overview video
Overview video
Overview video
Not graded
Overview video
Overview video

Expert reviews

In-depth analysis and verdict from leading tech publications
10
guru3d.com
✓ explicit
22/08/2023
Laptop review · Gaming CPU
Verdict
The AMD Ryzen 9 7945HX3D is a 16-core gaming laptop chip whose extra cache lifts game performance in the ASUS ROG Strix SCAR 17.
9.0
pcgamer.com
≈ estimated
22/08/2023
Hands-on test · Gaming laptop CPU
Verdict
The AMD Ryzen 9 7945HX3D is the fastest mobile gaming chip tested, though its gains are small in GPU-limited games and it trails the regular 7945HX in heavy multithreading.
8.0
reviewed.com
≈ estimated
06/03/2024
Lab test · Gaming laptop CPU
Verdict
The AMD Ryzen 9 7945HX3D is a clear gaming upgrade, most visible in Far Cry 6 and Shadow of the Tomb Raider, but offers little gain for work tasks.
9.0
windowscentral.com
≈ estimated
22/08/2023
Hands-on test · Gaming laptop CPU
Verdict
The AMD Ryzen 9 7945HX3D is a very fast laptop chip that beat most machines in Cinebench R23, though the bulky Asus chassis doesn't feel premium.
8.7
notebookcheck.net
✓ explicit
22/08/2023
Lab test · Gaming laptop CPU
Verdict
The AMD Ryzen 9 7945HX3D matches the regular 7945HX in single-core speed and uses less single-core power than Intel rivals, but its multi-core cooling holds it back.

Third-party reviews

What customers like about AMD Ryzen 9 7945HX3D

  • Unrivaled gaming performance, especially in CPU-bound titles like Far Cry 6 or simulation games.
  • Exceptional power efficiency under heavy multi-core loads, rivaling desktop-class chips at lower wattages.
  • Massive 128MB L3 cache significantly reduces latency and improves minimum frame rates.
  • Desktop-equivalent 16-core/32-thread architecture provides robust performance for creative and workstation tasks.

What customers don't like about AMD Ryzen 9 7945HX3D

  • Extremely limited availability, historically exclusive to the Asus ROG Strix Scar 17.
  • High idle power consumption compared to Intel HX and other AMD mobile chips, impacting battery life.
  • Diminishing returns in performance at higher resolutions (4K) where GPU bottlenecks become more prominent.
  • Performance inconsistency in some titles if they fail to utilize the specific CCD containing the 3D V-Cache.
  • Operating temperatures can frequently exceed 90°C during intensive tasks.

Verdict

The AMD Ryzen 9 7945HX3D is a flagship mobile processor from the Dragon Range series, featuring 16 cores, 32 threads, and a Zen 4 architecture on a 5nm process. Its defining characteristic is the 128MB of L3 3D V-Cache (144MB total cache), which significantly boosts gaming performance, specifically at 1080p where it can be up to 15% faster than the standard 7945HX. Key specifications include a max boost clock of 5.4 GHz, a base clock of 2.3 GHz, and a configurable TDP of 55W to 75W+. Main pros include world-class mobile gaming performance and exceptional multi-core efficiency compared to Intel's top-tier alternatives. Notable cons include its very limited availability, as it is primarily restricted to high-end laptops like the ASUS ROG Strix SCAR 17, and a slightly lower base clock speed compared to the non-3D version.

Compare AMD Ryzen 9 7945HX3D with other processors

1Product to compare no. 1
VS
2Product to compare no. 2
VS
3Product to compare no. 3 (optional)

Graphic comparison of AMD Ryzen 9 7945HX3D and other processors

No results found