Scored using Processors Methodology v3.0
Processors Methodology v3.0
Mathematical & Unbiased Scoring
Products in this category are scored under Frontum Processors Methodology v3.0: the technical score from the specifications is the base, and independent expert and video reviews (up to ±0.5 points), owner opinions (up to ±0.3) and best-of lists (up to +0.3) move it up or down.
Explore Processors Methodology v3.0

AMD Ryzen 3 3200G review: 74 specs compared

Avg. price:~£55PassMark multi-core score:6988N. of physical cores:4CPU boost clock speed:4.0 GHzCPU socket:AM4TDP (Thermal design power):65 W

AMD Ryzen 3 3200G Review: Compare 74 technical specifications, 38 expert and video reviews and 1 best-of list to see how this product ranks in the Processors category and whether it is worth buying.
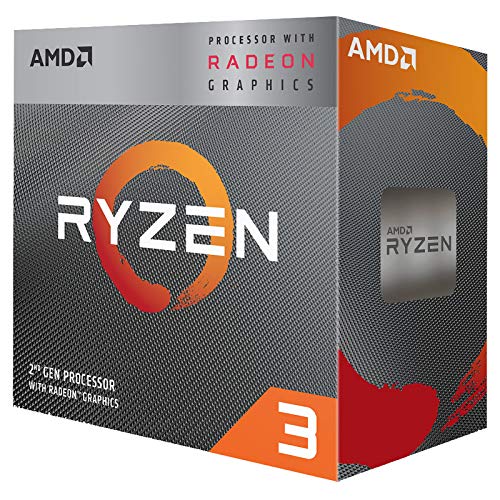
AMD Ryzen 3 3200G
5.3/10

Overall score

Score
5.3/ 10
✕
What it is
Our main score for this model, 1–10. It combines specs, expert reviews, best-of lists and owners.
How we count it
Parts: Technical score 40%, Reviews score 25%, List score 25%, Sentiment score 10%
Marks: Each part gets a mark out of 10. For reviews, lists and owners, a typical model in this category gets about 8 and the best one gets 10.
No data yet: A part with no data shows "?". It counts as the mark of a weaker model in this category (4 in 5 models with data score higher). This way, models with reviews, lists and owners usually come out ahead.
Score distribution
▼
<55-66-77-88-99-10
Score components

40%

4.5

Technical score

25%

7.7

Reviews score

25%

4.5

List score

10%

4.5

Sentiment score

▼Worse than 92% of processors
6.7

Value for money

Value for money
6.7/ 10
✕
What it is
An indicator that combines the processor's overall rating with its cost.
When it matters
When you are looking for a processor with a good balance between performance, efficiency, and price.
Score distribution
▼
<55-66-77-88-99-10
Score components

70%

5.3

Overall score

30%

10

Price

▼Worse than 83%
4.5

Technical score

Technical score
4.5/ 10
✕
What it is
How good the specs are compared with the other models in this category, 1–10.
How we count it
Areas: We rate the specs in each area against the other models in this category.
Weighting: The areas that matter most to buyers count more. The shares are shown under Score components.
Share: The technical score is 40% of the overall score.
Score distribution
▼
<55-66-77-88-99-10
Score components

60%

3.6

Performance

18%

4.3

Architecture

10%

6.2

Memory & PCIe

7%

8.0

Power & Thermal

4%

8.4

Platform

1%

6.9

Integrated graphics

▼Worse than 71%
7.7

Reviews score

Reviews score
7.7/ 10
✕
What it is
Average grade from independent test sites, magazines and video reviewers, 1–10.
How we count it
Grades: Each review's own score is converted to 1–10; without one, we grade the review ourselves. Big test sites count more, short reviews half as much as full tests. A video review counts half.
Score: The average grade is 80% of the review mark; the number of reviews is the other 20% (1 review = 5, the typical number in this category = 8, the most-reviewed model = 10).
Enough data: With few reviews, the average grade is pulled toward the typical grade of this category. No reviews yet: 7.2 for now.
Share: Reviews count 25% of the overall score.
Score distribution
▼
<55-66-77-88-99-10

80%

7.3

Average grade

20%

9.6

Popularity

Grades by review (38)
6 reviews: 3 with a printed score, 3 estimated from the review. 32 video reviews, each counting half as much as a written test. Reviews count 25% of the overall score.
User ratings collected online are not part of this score.
▲Better than 55%
4.5

List score

List score
4.5/ 10
✕
What it is
How often independent test sites, magazines and video reviewers put this model in their best-of lists for this category.
How we count it
Points: The model in the most lists of this category gets 10; the others get 8 to 10 in proportion. In no list yet: 7.5. Lists count 25% of the overall score.
Enough data: Every list counts, even a single one. With fewer than 5 best-of lists in the category, this part is left out.
Lists with this model (1)
List score: in 1 of 87 lists (1%)
▲Better than 89%
  • amd-ryzen-3-3200g
  • amd-ryzen-3-3200g
  • amd-ryzen-3-3200g
  • amd-ryzen-3-3200g
amd-ryzen-3-3200g
amd-ryzen-3-3200g
amd-ryzen-3-3200g
amd-ryzen-3-3200g
Where to buy
*As an Amazon Associate, we earn from qualifying purchases.
Best rankings
Available: ranking among products currently available (including other versions of this product).All: ranking among all products in the database.

What reviewers say about the AMD Ryzen 3 3200G

Based on 4 · 34

Reviewers praise the value and capable integrated graphics, split on gaming, and find it a poor match for a dedicated graphics card.
Praised
Mixed views
Criticised
Pick a topic to see who said what

What owners say about the AMD Ryzen 3 3200G

Based on 208 owners sharing their experience in online comments

55%positive8%mixed37%negative

Owners like its budget gaming performance, though low frame rates and stuttering limit more demanding games.

What owners dislike

  • Some owners see 20–30 FPS in Rocket League, Dota 2, GTA 5 and Valorant at low settings, and a few say driver or setup problems cause the slowdown.40
  • Owners report sudden frame drops and freezes in Warzone, Fortnite and PUBG, and the CPU hits 100% usage, causing stutter and hitching.21
  • Owners report the PC restarting or crashing during gameplay, sometimes after a few seconds, and blue screens with a 'thread stuck in device driver' error.12
  • Owners report no display or signal after a driver update or a second GPU install, and the screen stuck on Microsoft Basic Display Adapter at low resolution.11
  • Owners say GTA 5, Fortnite and Warzone reach only 20–50 FPS even at low settings, and playable frame rates need 720p with reduced resolution scale.10
  • Owners with a single 8GB RAM stick say frame rates are unstable, and a single channel drops FPS to about 5 in Valorant, while dual channel fixes it.6
  • Owners report textures failing to load in Fortnite and GTA 5, and some say the CPU hitting 100% causes the stutter and loading problems.6
  • Owners report CPU usage at 100% in Warzone, PUBG and other demanding games, causing constant frame drops and stuttering even with few background apps.5
  • Owners report temperatures of 60–65°C or GPU temperatures near 96°C during gaming, and one reports repeated crashes from CPU overheating in Minecraft.4
  • Owners who pair it with a GTX 970, GTX 1650 or RX 6400 say the chip holds back the graphics card in some games, causing bottlenecks.4

Points mentioned by at least 3 owners, most mentioned first.

Loading...
Loading category ranking...

Technical Specifications of processor AMD Ryzen 3 3200G

Technical score
Technical score
4.5/ 10
✕
What it is
How good the specs are compared with the other models in this category, 1–10.
How we count it
Areas: We rate the specs in each area against the other models in this category.
Weighting: The areas that matter most to buyers count more. The shares are shown under Score components.
Share: The technical score is 40% of the overall score.
Score distribution
▼
<55-66-77-88-99-10
Score components:

60%

3.6

Performance

18%

4.3

Architecture

10%

6.2

Memory & PCIe

7%

8.0

Power & Thermal

4%

8.4

Platform

1%

6.9

Integrated graphics

4.5
Reviews score
7.7
List score
4.5
Value for money
Value for money
6.7/ 10
✕
What it is
An indicator that combines the processor's overall rating with its cost.
When it matters
When you are looking for a processor with a good balance between performance, efficiency, and price.
Score distribution
▼
<55-66-77-88-99-10
Score components:

70%

5.3

Overall score

30%

10

Price

6.7
Processor type
desktop
This processor belongs to the desktop processor class, which is more advanced than that of 54.7% of processors and equal to that of 39.5% of processors.
CPU socket
AM4
This processor uses the AM4 CPU socket, which is newer than that of 75.1% of processors and equal to that of 9.4% of processors.
Chipset
X570, B550, A520, X470, B450, X370, B350, A320
This processor supports X570, B550, A520, X470, B450, X370, B350, A320 chipsets, which is broader compatibility than 74.1% of processors and equal to that of 4.4% of processors.
CPU architecture
x86-64
This processor uses the x86-64 architecture, which is more advanced than that of 1.8% of processors and equal to that of 98.2% of processors.
Instruction sets
MMX, SSE, SSE2, SSE3, SSSE3, SSE4A, SSE4.1, SSE4.2, AVX, AVX2, F16C, FMA3, AES, SHA, BMI1, BMI2, AMD-V
This processor supports MMX, SSE, SSE2, SSE3, SSSE3, SSE4A, SSE4.1, SSE4.2, AVX, AVX2, F16C, FMA3, AES, SHA, BMI1, BMI2, AMD-V instruction sets, which is broader support than 85.3% of processors and equal to that of 6% of processors.
Show more
What reviewers say
N. of physical cores
4
This processor has 4 CPU cores, which is fewer than 52.8% of processors and equal to 27.5% of processors.
CPU threads
4
This processor offers 4 CPU threads, which is fewer than 69% of processors and equal to 25.2% of processors.
CPU boost clock speed
4 GHz
This processor reaches a boost clock of 4 GHz which is lower than that of 62.1% of processors and equal to that of 4.8% of processors.
CPU base clock speed
4x 3.6 GHz
This processor has a base clock of 4x3.6 GHz which is higher than that of 50.3% of processors and equal to that of 1.6% of processors.
PassMark multi-core score
6,988
This processor scores 6,988 in PassMark, which is lower than 63.6% of processors.
Show more
What reviewers say
Semiconductor size
12 nm
This processor uses a 12 nm process node, which is more advanced than that of 48% of processors and equal to that of 2.7% of processors.
Foundry
GlobalFoundries 12 nm
This processor is built on the GlobalFoundries 12 nm foundry process, which is more advanced than that of 48.5% of processors and equal to that of 2.8% of processors.
L3 cache
4 MB
This processor has an L3 cache of 4 MB which is smaller than that of 71.7% of processors and equal to that of 13.8% of processors.
L2 cache
2 MB
This processor has an L2 cache of 2 MB which is smaller than that of 52.9% of processors and equal to that of 10.8% of processors.
L1 cache
384 KB
This processor has an L1 cache of 384 KB which is larger than that of 44% of processors and equal to that of 15.7% of processors.
Show more
DDR memory version
DDR4
This processor supports DDR DDR4, which is newer than that of 25.2% of processors and equal to that of 31.1% of processors.
Maximum memory speed
2,933 MHz
This processor supports memory speeds up to 2,933 MHz, which is lower than that of 50.3% of processors and equal to 5.1% of processors.
Max memory speed (JEDEC)
DDR4-2933 MHz
This processor supports JEDEC memory speeds up to DDR4-2933 MHz, which is lower than that of 54% of processors and equal to 4.5% of processors.
Max memory speed (XMP / EXPO)
?
Maximum memory capacity
64 GB
This processor supports up to 64 GB of memory, which is more than 27.2% of processors and equal to 26.1% of processors.
Show more
What reviewers say
Integrated graphics
yes
This processor includes integrated graphics. 14.7% of processors offer this.
Integrated GPU model
Radeon Vega 8
This processor uses the Radeon Vega 8 integrated GPU, which is more advanced than that in 73% of processors and equal to that in 3.3% of processors.
Integrated GPU execution units
8
This processor has 8 GPU execution units, which is fewer than 73.9% of processors and equal to 7.1% of processors.
Integrated GPU base frequency
1,250 MHz
This processor has an integrated GPU clock of 1,250 MHz which is higher than that of 95.5% of processors and equal to that of 0.3% of processors.
Integrated media encoders/decoders
VP9 (HW decode)
This processor supports VP9 (HW decode) media codecs, which is narrower support than 73.9% of processors and equal to 3.5% of processors.
Show more
What reviewers say
TDP (Thermal design power)
65 W
This processor has a TDP of 65 W which is higher than that of 68% of processors and equal to that of 17% of processors.
Base power (PL1)
65 W
This processor has a base power of 65 W which is higher than that of 68.1% of processors and equal to that of 17.4% of processors.
Boost power (PL2)
?
Tau (power duration limit)
N/A
Configurable TDP
yes
This processor supports configurable TDP. 46.4% of processors offer this.
cTDP: 45-65 W
Show more
What reviewers say

AMD Ryzen 3 3200G vs the average processor

246810TotalPlatformPerformanceArchitectureMemory & PCIeIntegrated graphicsPower & Thermal
  • 5.89x faster classroom rendering
    This processor has a lower Blender Classroom render time than the average processor (2,4.1 vs 340.1). The average processor needs 340.075 for the Blender Classroom test.
    2,004.1 vs 340.075
  • Unlocked for overclocking
    This processor has an unlocked multiplier, while the average processor does not. 22.6% of processors offer this.
  • Includes a cooler
    This processor includes a cooler, while the average processor does not. 26.9% of processors include a cooler.
  • Supports memory overclocking
    This processor supports memory overclocking, while the average processor does not. 43.9% of processors support memory overclocking.
  • 5 °C lower CPU temperature
    This processor has a lower CPU temperature than the average processor (95 °C vs 100 °C). The average processor runs at a CPU temperature of 100 °C.
    95 °C vs 100 °C
  • 14.9% higher review score
    Reviews score
    7.7/ 10
    ✕
    What it is
    Average grade from independent test sites, magazines and video reviewers, 1–10.
    How we count it
    Grades: Each review's own score is converted to 1–10; without one, we grade the review ourselves. Big test sites count more, short reviews half as much as full tests. A video review counts half.
    Score: The average grade is 80% of the review mark; the number of reviews is the other 20% (1 review = 5, the typical number in this category = 8, the most-reviewed model = 10).
    Enough data: With few reviews, the average grade is pulled toward the typical grade of this category. No reviews yet: 7.2 for now.
    Share: Reviews count 25% of the overall score.
    Score distribution
    ▼
    <55-66-77-88-99-10

    80%

    7.3

    Average grade

    20%

    9.6

    Popularity

    Grades by review (38)
    6 reviews: 3 with a printed score, 3 estimated from the review. 32 video reviews, each counting half as much as a written test. Reviews count 25% of the overall score.
    User ratings collected online are not part of this score.
    7.7 vs 6.7
  • 57.2% faster Blender rendering
    This processor has a lower Blender BMW27 render time than the average processor (625.5 vs 398). The average processor needs 398.015 for the Blender BMW27 test.
    625.5 vs 398.015
  • Modern CPU socket
    This processor uses a more modern CPU socket than the average processor (AM4 vs FP5).
    AM4 vs FP5
  • 14.9% higher review score
    Reviews score
    7.7/ 10
    ✕
    What it is
    Average grade from independent test sites, magazines and video reviewers, 1–10.
    How we count it
    Grades: Each review's own score is converted to 1–10; without one, we grade the review ourselves. Big test sites count more, short reviews half as much as full tests. A video review counts half.
    Score: The average grade is 80% of the review mark; the number of reviews is the other 20% (1 review = 5, the typical number in this category = 8, the most-reviewed model = 10).
    Enough data: With few reviews, the average grade is pulled toward the typical grade of this category. No reviews yet: 7.2 for now.
    Share: Reviews count 25% of the overall score.
    Score distribution
    ▼
    <55-66-77-88-99-10

    80%

    7.3

    Average grade

    20%

    9.6

    Popularity

    Grades by review (38)
    6 reviews: 3 with a printed score, 3 estimated from the review. 32 video reviews, each counting half as much as a written test. Reviews count 25% of the overall score.
    User ratings collected online are not part of this score.
    7.7 vs 6.7
  • 4.55x cheaper
    AMD Ryzen 3 3200G is cheaper than the average processor (£55 vs £250).
    £55 vs £250
  • Modern CPU socket
    This processor uses a more modern CPU socket than the average processor (AM4 vs FP5).
    AM4 vs FP5
  • Broader instruction support
    This processor supports a broader instruction set than the average processor (MMX, SSE, SSE2, SSE3, SSSE3, SSE4A, SSE4.1, SSE4.2, AVX, AVX2, F16C, FMA3, AES, SHA, BMI1, BMI2, AMD-V vs MMX, SSE, SSE2, SSE3, SSSE3, SSE4A, SSE4.1, SSE4.2, AVX, AVX2, F16C, FMA3, AES, SHA, AMD-V).
    MMX, SSE, SSE2, SSE3, SSSE3, SSE4A, SSE4.1, SSE4.2, AVX, AVX2, F16C, FMA3, AES, SHA, BMI1, BMI2, AMD-V vs MMX, SSE, SSE2, SSE3, SSSE3, SSE4A, SSE4.1, SSE4.2, AVX, AVX2, F16C, FMA3, AES, SHA, AMD-V
  • 5.89x faster classroom rendering
    This processor has a lower Blender Classroom render time than the average processor (2,4.1 vs 340.1). The average processor needs 340.075 for the Blender Classroom test.
    2,004.1 vs 340.075
  • Unlocked for overclocking
    This processor has an unlocked multiplier, while the average processor does not. 22.6% of processors offer this.
  • 57.2% faster Blender rendering
    This processor has a lower Blender BMW27 render time than the average processor (625.5 vs 398). The average processor needs 398.015 for the Blender BMW27 test.
    625.5 vs 398.015
  • More advanced foundry
    This processor uses a more advanced foundry process than the average processor (GlobalFoundries 12 nm vs Intel 14 nm).
    GlobalFoundries 12 nm vs Intel 14 nm
  • Supports memory overclocking
    This processor supports memory overclocking, while the average processor does not. 43.9% of processors support memory overclocking.
  • 3.57x higher GPU clock speed
    This processor has a higher integrated GPU frequency than the average processor (1,250 MHz vs 350 MHz). The average processor has integrated GPU frequency of 350 MHz.
    1,250 MHz vs 350 MHz
  • Includes a cooler
    This processor includes a cooler, while the average processor does not. 26.9% of processors include a cooler.
  • 5 °C lower CPU temperature
    This processor has a lower CPU temperature than the average processor (95 °C vs 100 °C). The average processor runs at a CPU temperature of 100 °C.
    95 °C vs 100 °C
  • 42.3% lower list score
    List score
    4.5/ 10
    ✕
    What it is
    How often independent test sites, magazines and video reviewers put this model in their best-of lists for this category.
    How we count it
    Points: The model in the most lists of this category gets 10; the others get 8 to 10 in proportion. In no list yet: 7.5. Lists count 25% of the overall score.
    Enough data: Every list counts, even a single one. With fewer than 5 best-of lists in the category, this part is left out.
    Lists with this model (1)
    List score: in 1 of 87 lists (1%)
    4.5 vs 7.8
  • Less advanced microarchitecture
    This processor uses a less advanced microarchitecture than the average processor (Picasso vs Kaby Lake).
    Picasso vs Kaby Lake
  • 2 fewer CPU cores
    This processor has fewer CPU cores than the average processor (4 vs 6). The average processor has 6 CPU cores.
    4 vs 6
  • 30% lower single-core score
    This processor has a lower Geekbench 6 single-core score than the average processor (1,075 vs 1,535). The average processor scores 1,535 in Geekbench 6 single-core.
    1,075 vs 1,535
  • 41.1% lower multi-core score
    This processor has a lower Geekbench 6 multi-core score than the average processor (3,067 vs 5,209). The average processor scores 5,209 in Geekbench 6 multi-core.
    3,067 vs 5,209
  • 47.2% weaker multi-core performance
    This processor has a lower multi-core performance than the average processor (1,481 vs 2,804.5). The average processor scores 2,804.5 in Cinebench R20 multi-core.
    1,481 vs 2,804.5
  • 39.1% lower PassMark score
    This processor has a lower PassMark benchmark score than the average processor (6,988 vs 11,469). The average processor scores 11,469 in PassMark benchmark.
    6,988 vs 11,469
  • 45.9% less L3 per core
    This processor has less L3 cache per core than the average processor (1 MB/core vs 1.85 MB/core). The average processor provides 1.85 MB/core of L3 cache per core.
    1 MB/core vs 1.85 MB/core
  • 42.3% lower list score
    List score
    4.5/ 10
    ✕
    What it is
    How often independent test sites, magazines and video reviewers put this model in their best-of lists for this category.
    How we count it
    Points: The model in the most lists of this category gets 10; the others get 8 to 10 in proportion. In no list yet: 7.5. Lists count 25% of the overall score.
    Enough data: Every list counts, even a single one. With fewer than 5 best-of lists in the category, this part is left out.
    Lists with this model (1)
    List score: in 1 of 87 lists (1%)
    4.5 vs 7.8
  • 37.5% lower sentiment score
    4.5 vs 7.2
  • 8.4% worse value for money
    AMD Ryzen 3 3200G has worse value for money than the average processor (6.72 vs 7.3).
    6.72 vs 7.29
  • Weaker security extensions
    This processor provides less advanced security extensions than the average processor (AES-NI, SHA, NX bit, SMAP, SMEP vs AES-NI, NX bit, Secure Key, TXT, OS Guard, Boot Guard, CET, MBEC, TME, TME-MK).
    AES-NI, SHA, NX bit, SMAP, SMEP vs AES-NI, NX bit, Secure Key, TXT, OS Guard, Boot Guard, CET, MBEC, TME, TME-MK
  • Older TPM support
    This processor supports an older TPM version than the average processor (fTPM 2 vs PTT 2).
    fTPM 2.0 vs PTT 2.0
  • 30% lower single-core score
    This processor has a lower Geekbench 6 single-core score than the average processor (1,075 vs 1,535). The average processor scores 1,535 in Geekbench 6 single-core.
    1,075 vs 1,535
  • 2 fewer CPU cores
    This processor has fewer CPU cores than the average processor (4 vs 6). The average processor has 6 CPU cores.
    4 vs 6
  • 47.2% weaker multi-core performance
    This processor has a lower multi-core performance than the average processor (1,481 vs 2,804.5). The average processor scores 2,804.5 in Cinebench R20 multi-core.
    1,481 vs 2,804.5
  • 41.1% lower multi-core score
    This processor has a lower Geekbench 6 multi-core score than the average processor (3,067 vs 5,209). The average processor scores 5,209 in Geekbench 6 multi-core.
    3,067 vs 5,209
  • 39.1% lower PassMark score
    This processor has a lower PassMark benchmark score than the average processor (6,988 vs 11,469). The average processor scores 11,469 in PassMark benchmark.
    6,988 vs 11,469
  • 4 fewer CPU threads
    This processor has fewer CPU threads than the average processor (4 vs 8). The average processor has 8 CPU threads.
    4 vs 8
  • 22.2% lower Cinebench R20 single-core score
    This processor has a lower Cinebench R20 single-core score than the average processor (381 vs 490). The average processor scores 490 in Cinebench R20 single-core.
    381 vs 490
  • 9.1% lower boost clock
    This processor has a lower boost clock speed than the average processor (4 GHz vs 4.4 GHz). The average processor reaches boost clock speed of 4.4 GHz.
    4.0 GHz vs 4.4 GHz
  • No simultaneous multithreading
    This processor does not support simultaneous multithreading, while the average processor does. 73.8% of processors support it.
  • 14.7% weaker single-core performance
    This processor has a lower PassMark single-core score than the average processor (2,183 vs 2,558). The average processor scores 2,558 in PassMark single-core.
    2,183 vs 2,558
  • Less advanced microarchitecture
    This processor uses a less advanced microarchitecture than the average processor (Picasso vs Kaby Lake).
    Picasso vs Kaby Lake
  • 45.9% less L3 per core
    This processor has less L3 cache per core than the average processor (1 MB/core vs 1.85 MB/core). The average processor provides 1.85 MB/core of L3 cache per core.
    1 MB/core vs 1.85 MB/core
  • 55.6% smaller L3 cache
    This processor has a lower L3 cache than the average processor (4 MB vs 9 MB). The average processor has L3 cache of 9 MB.
    4 MB vs 9 MB
  • 18.6% larger die size
    This processor has a higher die size than the average processor (210 mm² vs 177 mm²). The average processor has a die size of 177 mm².
    210 mm² vs 177 mm²
  • 33.3% smaller L2 cache
    This processor has a lower L2 cache than the average processor (2 MB vs 3 MB). The average processor has L2 cache of 3 MB.
    2 MB vs 3 MB
  • Narrower media codec support
    This processor supports fewer media codecs than the average processor (VP9 (HW decode) vs H.264 (HW decode/encode), H.265 (HW decode/encode), VP9 (HW decode/encode), AV1 (HW decode), JPEG (HW decode/encode)).
    VP9 (HW decode) vs H.264 (HW decode/encode), H.265 (HW decode/encode), VP9 (HW decode/encode), AV1 (HW decode), JPEG (HW decode/encode)
  • 66.7% fewer GPU execution units
    This processor has fewer GPU execution units than the average processor (8 vs 24). The average processor has 24 GPU execution units.
    8 vs 24
  • 44.4% higher base power
    This processor has a higher base power draw than the average processor (65 W vs 45 W). The average processor has a base power draw of 45 W.
    65 W vs 45 W
  • 5 °C lower temperature limit
    This processor has a lower temperature limit than the average processor (95 °C vs 100 °C). The average processor can run up to 100 °C.
    95 °C vs 100 °C
  • 44.4% higher TDP
    This processor has a higher TDP than the average processor (65 W vs 45 W). The average processor has a TDP of 45 W.
    65 W vs 45 W

Video reviews

Hands-on testing, unboxing, and real-world video evaluations

7.0
IDK Computers
≈ estimated
21/05/2026
Hands-on review · game and video performance tests
Verdict
AMD Ryzen 3 3200G is playable for casual gaming at low settings, but not recommended for competitive esports.
7.0
SteTechGaming
≈ estimated
02/09/2023
Hands-on review · game tests at 720p and 1080p
Verdict
AMD Ryzen 3 3200G is surprisingly capable at 720p on low settings and a good value for very tight budgets.
8.0
PC Jack
≈ estimated
23/02/2023
Hands-on review · game tests at 720p, low settings
Verdict
AMD Ryzen 3 3200G is still a versatile, affordable option in 2023, but demanding games expose its limits.
8.0
Andy'sTech
≈ estimated
19/08/2022
Hands-on review · game benchmarks and budget PC build
Verdict
AMD Ryzen 3 3200G is limited, but still a reasonable option for a very tight budget and a newer platform.
7.0
Royalsoft
≈ estimated
29/12/2021
Value review · gaming on integrated graphics and GPU comparison
Verdict
AMD Ryzen 3 3200G is not worth its price, but it is a reasonable pick for a budget build without a graphics card.
4.0
Manong's Unboxing
≈ estimated
20/12/2021
Benchmark test · nine games and price check
Verdict
AMD Ryzen 3 3200G is a worse buy than a discrete graphics card at current prices.
6.0
Tech 215
≈ estimated
07/04/2020
Hands-on review · gaming tests and boot problems
Verdict
AMD Ryzen 3 3200G is fine for light use and small builds, but not recommended as a main gaming PC.
8.0
Nicolas11x12 English
≈ estimated
21/11/2019
Hands-on review · integrated graphics and GPU bottleneck tests
Verdict
AMD Ryzen 3 3200G suits HTPCs and light use, but not as a partner for a discrete graphics card.
8.0
Zach's Tech Turf
≈ estimated
18/07/2019
Hands-on benchmark · paired with three dedicated graphics cards
Verdict
AMD Ryzen 3 3200G suits budget gamers who plan to add a dedicated graphics card later.
9.0
RandomGaminginHD
≈ estimated
16/07/2019
Budget build · gaming tests with integrated Vega 8
Verdict
AMD Ryzen 3 3200G is a strong pick for a cheap entry-level gaming or everyday PC with 8 GB RAM.
9.0
CobiesTech
≈ estimated
02/07/2020
Benchmark review · six games at 720p and 1080p
Verdict
AMD Ryzen 3 3200G is a sensible budget CPU for new builders, if you accept lower resolutions and settings.
9.0
Entertainment Techie
≈ estimated
25/03/2020
Hands-on test · emulation across consoles and arcade systems
Verdict
AMD Ryzen 3 3200G is recommended for emulation, especially in a budget build.
More graded video reviews (1)
creator’s own scoreestimated by us

Expert reviews

In-depth analysis and verdict from leading tech publications

7.0
techbuyersguru.com
≈ estimated
13/09/2019
Benchmark review · Built-in graphics CPU
Verdict
The AMD Ryzen 3 3200G is a solid budget chip whose built-in graphics beat Intel's and handle light gaming, but it trails Zen 2 CPUs in raw speed.
7.0
pcmag.com
✓ explicit
16/10/2019
Benchmark review · Integrated graphics
Verdict
The AMD Ryzen 3 3200G is a quad-core chip with built-in Radeon graphics that can stand in for a very low-end graphics card, but it lacks multithreading.
7.0
au.pcmag.com
✓ explicit
17/10/2019
Test results · Entry-level desktop CPU
Verdict
The AMD Ryzen 3 3200G is a capable four-core chip whose Vega 8 graphics can stand in for a low-end graphics card, though it lacks multithreading.
7.0
computerbase.de
≈ estimated
19/07/2019
Benchmark review · Budget graphics CPU
Verdict
The AMD Ryzen 3 3200G is the sensible choice among AMD's built-in graphics chips, far ahead of Intel's, though gains over the 2200G are modest.
3.2
chip.de
✓ explicit
16/02/2021
Lab test · Media PC processor
Verdict
The AMD Ryzen 3 3200G is a niche chip for media and mini PCs, with built-in Vega 8 graphics that compare well with rivals, but overall CPU performance is only satisfactory.

Third-party reviews

What customers like about AMD Ryzen 3 3200G

  • Exceptional value for money at its price point
  • Strong integrated Radeon Vega 8 graphics for light/casual gaming
  • Comes with a capable stock cooling fan (Wraith Stealth)
  • Efficient power consumption with a 65W TDP
  • Unlocked for easy overclocking flexibility
  • Simplifies budget builds by removing the immediate need for a dedicated GPU
  • Excellent for home office, school work, and media streaming

What customers don't like about AMD Ryzen 3 3200G

  • Lacks multi-threading (SMT) support (4 cores/4 threads only)
  • Struggles with demanding AAA games at high settings or resolutions
  • Small 4MB L3 cache compared to higher-end models
  • Stock cooler may be insufficient for aggressive overclocking
  • Significant performance gap compared to the slightly more expensive Ryzen 5 3400G
  • Heavily dependent on high-speed dual-channel RAM for optimal graphics performance

Verdict

The AMD Ryzen 3 3200G is a budget-friendly 12nm quad-core processor from the Picasso APU lineup, featuring 4 physical cores and 4 threads with a base clock of 3.6 GHz and a max boost of 4.0 GHz. Built on the AM4 socket with a 65W TDP, its primary characteristic is the integrated Radeon Vega 8 graphics, which operates at 1250 MHz and includes 8 GPU cores to enable entry-level 720p or 1080p gaming without a discrete card. Key pros include its unlocked multiplier for overclocking, the inclusion of an AMD Wraith Stealth cooler, and strong performance for office tasks and esports titles. However, notable cons include the lack of Simultaneous Multithreading (SMT), a limited L3 cache of only 4 MB, and its reliance on PCIe 3.0 x8 lanes, which can bottleneck high-end dedicated GPUs.

Compare AMD Ryzen 3 3200G with other processors

1Product to compare no. 1
VS
2Product to compare no. 2
VS
3Product to compare no. 3 (optional)

Graphic comparison of AMD Ryzen 3 3200G and other processors

No results found