Scored using Graphics cards Methodology v3.0
Graphics cards Methodology v3.0
Mathematical & Unbiased Scoring
Products in this category are scored under Frontum Graphics cards Methodology v3.0: the technical score from the specifications is the base, and independent expert and video reviews (up to ±0.5 points), owner opinions (up to ±0.3) and best-of lists (up to +0.3) move it up or down.
Explore Graphics cards Methodology v3.0

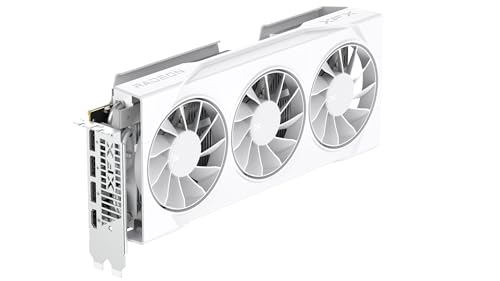
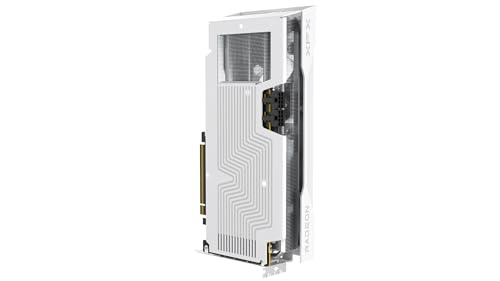
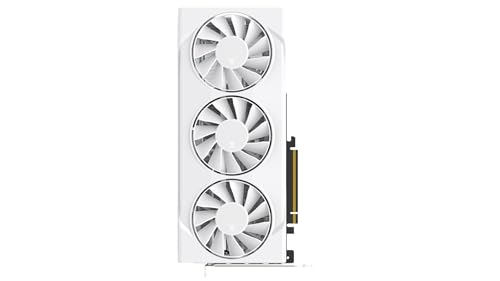
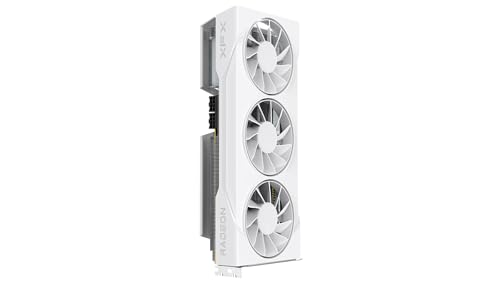
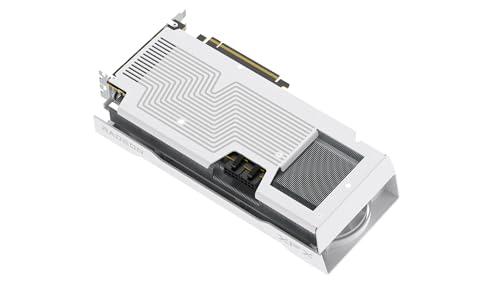
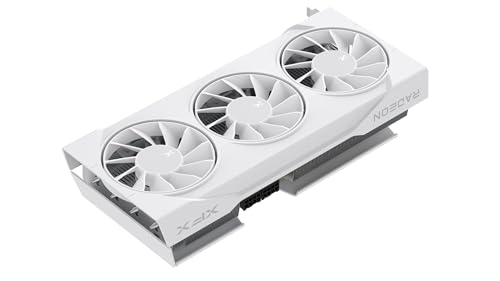
XFX Swift Radeon RX 9070 GRE White 12GB review: 117 specs compared

Avg. price:~£620VRAM:12 GBMemory bus width:?Thermal Design Power (TDP):220 W

XFX Swift Radeon RX 9070 GRE White 12GB Review: Compare 117 technical specifications and 2 expert and video reviews to see how this product ranks in the Graphics cards category and whether it is worth buying.
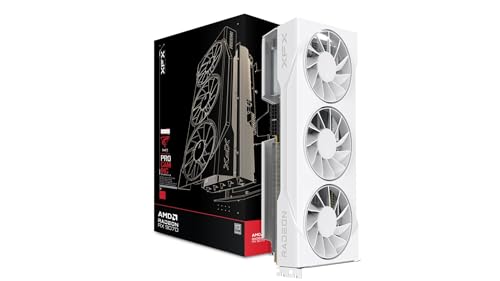
XFX Swift Radeon RX 9070 GRE White 12GB
7.7/10

Overall score

Score
7.7/ 10
✕
What it is
Our main score for this model, 1–10. It combines specs, expert reviews, best-of lists and owners.
How we count it
Parts: Technical score 40%, Reviews score 25%, List score 25%, Sentiment score 10%
Marks: Each part gets a mark out of 10. For reviews, lists and owners, a typical model in this category gets about 8 and the best one gets 10.
No data yet: A part with no data shows "?". It counts as the mark of a weaker model in this category (4 in 5 models with data score higher). This way, models with reviews, lists and owners usually come out ahead.
Score distribution
â–¼
<55-66-77-88-99-10
Score components

40%

7.9

Technical score

25%

7.8

Reviews score

25%

?

List scoreNot enough data yet, so we use 7.5, the mark of a weaker model in this category

10%

7.7

Sentiment score

â–²Better than 61% of graphics cards
7.6

Value for money

Value for money
7.6/ 10
✕
What it is
An indicator that combines the graphics card's overall rating with its cost.
When it matters
When you are looking for a graphics card that offers a strong balance of performance, features, and price.
Score distribution
â–¼
<55-66-77-88-99-10
Score components

70%

7.7

Overall score

30%

7.2

Price

â–²Better than 62%
7.9

Technical score

Technical score
7.9/ 10
✕
What it is
How good the specs are compared with the other models in this category, 1–10.
How we count it
Areas: We rate the specs in each area against the other models in this category.
Weighting: The areas that matter most to buyers count more. The shares are shown under Score components.
Share: The technical score is 40% of the overall score.
Score distribution
â–¼
<55-66-77-88-99-10
Score components

44%

7.6

Performance

24%

7.6

Memory

12%

9.0

Power

11%

8.8

Features

5%

6.2

Design

4%

8.7

Connectivity

â–²Better than 66%
7.8

Reviews score

Reviews score
7.8/ 10
✕
What it is
Average grade from independent test sites, magazines and video reviewers, 1–10.
How we count it
Grades: Each review's own score is converted to 1–10; without one, we grade the review ourselves. Big test sites count more, short reviews half as much as full tests. A video review counts half.
Score: The average grade is 80% of the review mark; the number of reviews is the other 20% (1 review = 5, the typical number in this category = 8, the most-reviewed model = 10).
Enough data: With few reviews, the average grade is pulled toward the typical grade of this category. No reviews yet: 7.6 for now.
Share: Reviews count 25% of the overall score.
Score distribution
â–¼
<55-66-77-88-99-10

80%

8.1

Average grade

20%

6.5

Popularity

Grades by review (2)
2 video reviews, each counting half as much as a written test. Reviews count 25% of the overall score.
User ratings collected online are not part of this score.
â–¼Worse than 55%
?

List score

List score
7.5/ 10
✕
What it is
How often independent test sites, magazines and video reviewers put this model in their best-of lists for this category.
How we count it
Points: The model in the most lists of this category gets 10; the others get 8 to 10 in proportion. In no list yet: 7.5. Lists count 25% of the overall score.
Enough data: Every list counts, even a single one. With fewer than 5 best-of lists in the category, this part is left out.
Lists with this model (0)
Not in any best-of list yet, so this part counts as 7.5. Models in a list get 8 to 10.
Not in any best-of list yet
  • xfx-swift-radeon-rx-9070-gre-white-12gb
  • xfx-swift-radeon-rx-9070-gre-white-12gb
  • xfx-swift-radeon-rx-9070-gre-white-12gb
  • xfx-swift-radeon-rx-9070-gre-white-12gb
  • xfx-swift-radeon-rx-9070-gre-white-12gb
  • xfx-swift-radeon-rx-9070-gre-white-12gb
  • xfx-swift-radeon-rx-9070-gre-white-12gb
xfx-swift-radeon-rx-9070-gre-white-12gb
Where to buy
*As an Amazon Associate, we earn from qualifying purchases.
Best rankings
Available: ranking among products currently available (including other versions of this product).All: ranking among all products in the database.

What owners say about the XFX Swift Radeon RX 9070 GRE White 12GB

Based on 73 owners sharing their experience in online comments

74%positive8%mixed18%negative

Owners praise its strong speed and value, while driver trouble, weaker ray tracing, VRAM limits, and uneven performance draw complaints.

What owners dislike

  • Some owners report driver problems, including Windows restarts during AMD driver updates and recording failing after an AMD update.5
  • Some owners say the card trails the RX 9060 XT 16GB in several games and is not much faster than an RTX 5070 in their tests.5
  • Some owners find 16GB of VRAM runs short at 1440p with ray tracing and background apps open, and one saw only about 9.5GB usable.4
  • Owners say ray tracing performance is weak, with one noting it performs well only when ray tracing is not forced.3

Points mentioned by at least 3 owners, most mentioned first.

Loading...
Loading category ranking...

Technical Specifications of graphics card XFX Swift Radeon RX 9070 GRE White 12GB

Technical score
Technical score
7.9/ 10
✕
What it is
How good the specs are compared with the other models in this category, 1–10.
How we count it
Areas: We rate the specs in each area against the other models in this category.
Weighting: The areas that matter most to buyers count more. The shares are shown under Score components.
Share: The technical score is 40% of the overall score.
Score distribution
â–¼
<55-66-77-88-99-10
Score components:

44%

7.6

Performance

24%

7.6

Memory

12%

9.0

Power

11%

8.8

Features

5%

6.2

Design

4%

8.7

Connectivity

7.9
Reviews score
7.8
List score
?
Value for money
Value for money
7.6/ 10
✕
What it is
An indicator that combines the graphics card's overall rating with its cost.
When it matters
When you are looking for a graphics card that offers a strong balance of performance, features, and price.
Score distribution
â–¼
<55-66-77-88-99-10
Score components:

70%

7.7

Overall score

30%

7.2

Price

7.6
3DMark Time Spy benchmark score
?
3DMark Port Royal score
?
PassMark (G3D) result
?
PassMark (DirectCompute) result
?
FP32 performance
?
Show more
VRAM
12 GB
This graphics card has 12 GB of VRAM, which is more than 46% of graphics cards and equal to 16% of graphics cards.
Memory type
?
Memory bus width
?
Maximum memory bandwidth
?
Effective memory speed
18,000 MHz
This graphics card reaches an effective memory speed of 18,000 MHz, which is slower than that of 51.5% of graphics cards and equal to that of 8.9% of graphics cards.
Show more
PCI Express (PCIe) version
?
PCIe lanes
?
DirectX version
?
Vulkan version
?
OpenGL version
?
Show more
Max displays supported
?
Max digital resolution
?
DisplayPort outputs
3
This graphics card offers 3 DisplayPort outputs, which is more than 21.7% of graphics cards and equal to 76% of graphics cards.
DisplayPort version
?
DisplayPort link rates
?
Show more
Thermal Design Power (TDP)
220 W
This graphics card has a TDP of 220 W, which is higher than that of 50.9% of graphics cards and equal to that of 4.2% of graphics cards.
Power consumption while under peak load
220 W
This graphics card draws 220 W under peak load, which is lower than 47.8% of graphics cards and equal to 3.6% of graphics cards.
Recommended PSU wattage
?
Board power limit
220 W
This graphics card has a board power limit of 220 W, which is lower than that of 49.5% of graphics cards and equal to that of 2.7% of graphics cards.
PCIe power spec
220 W
Show more
Size
?
Length
301 mm
This graphics card is 301 mm long, which is longer than 60.5% of graphics cards and equal in length to 0.5% of graphics cards.
Height
153 mm
This graphics card is 153 mm tall, which is taller than 97.4% of graphics cards and equal in height to 0.6% of graphics cards.
Slot width
?
Weight
1,700 g
This graphics card weighs 1,700 g, which is heavier than 81.6% of Graphics cards and equal to 0.6% of Graphics cards.
Show more

XFX Swift Radeon RX 9070 GRE White 12GB vs the average graphics card

246810TotalPerformanceMemoryFeaturesConnectivityPowerDesign
  • 11.4% higher boost clock speed
    This graphics card has a higher boost GPU clock than the average graphics card (2,790 MHz vs 2,505 MHz). The average graphics card has a boost GPU clock of 2,505 MHz.
    2,790 MHz vs 2,505 MHz
  • 20% smaller process node
    This graphics card uses a smaller manufacturing process than the average graphics card (4 nm vs 5 nm). The average graphics card uses a manufacturing process of 5 nm.
    4 nm vs 5 nm
  • 8 more ray tracing cores
    This graphics card has more ray tracing cores than the average graphics card (48 vs 40). The average graphics card has 40 ray tracing cores.
    48 vs 40
  • 8.3% higher review score
    Reviews score
    7.8/ 10
    ✕
    What it is
    Average grade from independent test sites, magazines and video reviewers, 1–10.
    How we count it
    Grades: Each review's own score is converted to 1–10; without one, we grade the review ourselves. Big test sites count more, short reviews half as much as full tests. A video review counts half.
    Score: The average grade is 80% of the review mark; the number of reviews is the other 20% (1 review = 5, the typical number in this category = 8, the most-reviewed model = 10).
    Enough data: With few reviews, the average grade is pulled toward the typical grade of this category. No reviews yet: 7.6 for now.
    Share: Reviews count 25% of the overall score.
    Score distribution
    â–¼
    <55-66-77-88-99-10

    80%

    8.1

    Average grade

    20%

    6.5

    Popularity

    Grades by review (2)
    2 video reviews, each counting half as much as a written test. Reviews count 25% of the overall score.
    User ratings collected online are not part of this score.
    7.8 vs 7.2
  • 8.3% higher review score
    Reviews score
    7.8/ 10
    ✕
    What it is
    Average grade from independent test sites, magazines and video reviewers, 1–10.
    How we count it
    Grades: Each review's own score is converted to 1–10; without one, we grade the review ourselves. Big test sites count more, short reviews half as much as full tests. A video review counts half.
    Score: The average grade is 80% of the review mark; the number of reviews is the other 20% (1 review = 5, the typical number in this category = 8, the most-reviewed model = 10).
    Enough data: With few reviews, the average grade is pulled toward the typical grade of this category. No reviews yet: 7.6 for now.
    Share: Reviews count 25% of the overall score.
    Score distribution
    â–¼
    <55-66-77-88-99-10

    80%

    8.1

    Average grade

    20%

    6.5

    Popularity

    Grades by review (2)
    2 video reviews, each counting half as much as a written test. Reviews count 25% of the overall score.
    User ratings collected online are not part of this score.
    7.8 vs 7.2
  • 11.4% higher boost clock speed
    This graphics card has a higher boost GPU clock than the average graphics card (2,790 MHz vs 2,505 MHz). The average graphics card has a boost GPU clock of 2,505 MHz.
    2,790 MHz vs 2,505 MHz
  • 8 more ray tracing cores
    This graphics card has more ray tracing cores than the average graphics card (48 vs 40). The average graphics card has 40 ray tracing cores.
    48 vs 40
  • 20% smaller process node
    This graphics card uses a smaller manufacturing process than the average graphics card (4 nm vs 5 nm). The average graphics card uses a manufacturing process of 5 nm.
    4 nm vs 5 nm
  • No CUDA support
    This graphics card does not support CUDA, the average graphics card does.
  • 26% lower base clock speed
    This graphics card has a lower base GPU clock than the average graphics card (1,420 MHz vs 1920 MHz). The average graphics card has a base GPU clock of 1920 MHz.
    1,420 MHz vs 1,920 MHz
  • 28 mm higher card profile
    This graphics card is taller than the average graphics card (153 mm vs 125 mm). The average graphics card has a height of 125 mm.
    153 mm vs 125 mm
  • No RGB lighting
    This graphics card does not include RGB lighting, the average graphics card does.
  • 48 fewer AI cores
    This graphics card has fewer AI cores than the average graphics card (96 vs 144). The average graphics card has 144 AI cores.
    96 vs 144
  • 18.8 mm longer card length
    This graphics card is longer than the average graphics card (301 mm vs 282.2 mm). The average graphics card has a length of 282.2 mm.
    301 mm vs 282.2 mm
  • 5.3% slower memory speed
    This graphics card has a lower effective memory speed than the average graphics card (18,000 MHz vs 19,000 MHz). The average graphics card reaches an effective memory speed of 19,000 MHz.
    18,000 MHz vs 19,000 MHz
  • 67.7% heavier
    This graphics card is heavier than the average graphics card (1,700 g vs 1,014 g). The average graphics card weighs 1,014 g.
    1,700 g vs 1,014 g
  • No CUDA support
    This graphics card does not support CUDA, the average graphics card does.
  • 26% lower base clock speed
    This graphics card has a lower base GPU clock than the average graphics card (1,420 MHz vs 1920 MHz). The average graphics card has a base GPU clock of 1920 MHz.
    1,420 MHz vs 1,920 MHz
  • 48 fewer AI cores
    This graphics card has fewer AI cores than the average graphics card (96 vs 144). The average graphics card has 144 AI cores.
    96 vs 144
  • 5.3% slower memory speed
    This graphics card has a lower effective memory speed than the average graphics card (18,000 MHz vs 19,000 MHz). The average graphics card reaches an effective memory speed of 19,000 MHz.
    18,000 MHz vs 19,000 MHz
  • No RGB lighting
    This graphics card does not include RGB lighting, the average graphics card does.
  • 28 mm higher card profile
    This graphics card is taller than the average graphics card (153 mm vs 125 mm). The average graphics card has a height of 125 mm.
    153 mm vs 125 mm
  • 18.8 mm longer card length
    This graphics card is longer than the average graphics card (301 mm vs 282.2 mm). The average graphics card has a length of 282.2 mm.
    301 mm vs 282.2 mm
  • 67.7% heavier
    This graphics card is heavier than the average graphics card (1,700 g vs 1,014 g). The average graphics card weighs 1,014 g.
    1,700 g vs 1,014 g

Video reviews

Hands-on testing, unboxing, and real-world video evaluations

8.0
ALKtech
≈ estimated
02/06/2026
Hands-on review · benchmarks, power and thermals
Verdict
XFX Swift Radeon RX 9070 GRE White 12GB offers strong value against the RTX 5060 Ti if its launch price holds, though the test sample is small.
8.0
The FPS Review
≈ estimated
03/06/2026
First look with thermal and overclock notes
Verdict
XFX Swift Radeon RX 9070 GRE White 12GB is good value against the RTX 5060 Ti and has solid cooling, though its hot spot runs high.
Not graded
Not graded

Third-party reviews

What customers like about XFX Swift Radeon RX 9070 GRE White 12GB

  • The 2790 MHz boost clock gives the core plenty of speed.
  • The 4 nm chip is built on a fine manufacturing process.
  • 12 GB of video memory leaves room for detailed textures.
  • FSR upscaling helps keep frame rates up.
  • Three fans and a backplate give the card a solid build.
  • Overclocking support lets you push the clocks further.

What customers don't like about XFX Swift Radeon RX 9070 GRE White 12GB

  • At 1700 g it is heavy and needs a firm mount.
  • At 153 mm tall it needs a case with enough headroom.
  • No CUDA support, so software that needs Nvidia CUDA will not run.
  • At 301 mm long it is too big for some small cases.
  • Its 220 W power draw needs a power supply with spare capacity.

Verdict

Speed comes first on the XFX Swift Radeon RX 9070 GRE White, which reaches 2790 MHz on a 4 nm chip. The card has 12 GB of video memory, which gives games room for detailed textures. FSR upscaling helps when frame rates dip, and variable refresh rate keeps the picture smooth on a compatible monitor. Three fans, a backplate and overclocking support make it a flexible card for tinkering. The trade-offs are size and weight. At 1700 g and 153 mm tall, it is heavy and needs a firm mount in the case. It also has no CUDA support, which only matters if your work relies on Nvidia-only software. This card suits a gamer who wants a white Radeon card and does not mind a heavy one.

Compare XFX Swift Radeon RX 9070 GRE White 12GB with other products in the Graphics cards category

1Product to compare no. 1
VS
2Product to compare no. 2
VS
3Product to compare no. 3 (optional)

Graphic comparison of XFX Swift Radeon RX 9070 GRE White 12GB and other products in the Graphics cards category

No results found