Scored using Graphics cards Methodology v1.0
Graphics cards Methodology v1.0
Mathematical & Unbiased Scoring
Products in this category are scored under Frontum Graphics cards Methodology v1.0: technical specifications plus authentic consumer ratings, with 0% commercial bias.
Explore Graphics cards Methodology v1.0

GALAX GeForce RTX 4090 SG 1 Click OC Review | 118 Data compared

Avg. price:~£1,850VRAM:24 GBMemory bus width:384 bitThermal Design Power (TDP):450 W

GALAX GeForce RTX 4090 SG 1 Click OC Review: Compare 118 technical specifications and user reviews to see how this product ranks in the Graphics cards category and whether it is worth buying.
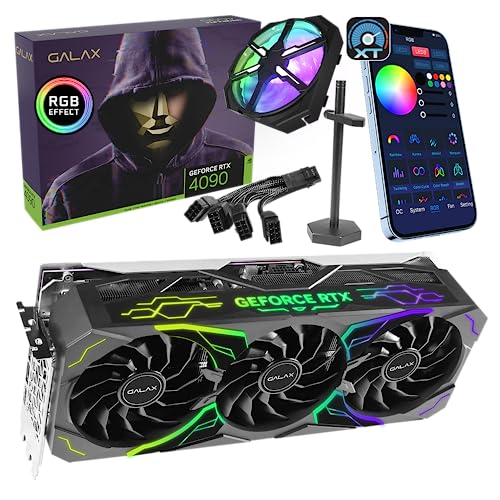
GALAX GeForce RTX 4090 SG 1 Click OC
9.0/10

Overall score

Score
9.0/ 10
✕
What it is
An overall evaluation of the graphics card's quality, based on technical analyses and user reviews.
When it matters
When you need a quick reference to identify the best graphics cards on the market.
Score distribution
▼
<55-66-77-88-99-10
Score components

90%

9.1

Technical score

10%

8.4

User score

▲Better than 87% of graphics cards
6.6

Value for money

Value for money
6.6/ 10
✕
What it is
An indicator that combines the graphics card's overall rating with its cost.
When it matters
When you are looking for a graphics card that offers a strong balance of performance, features, and price.
Score distribution
▼
<55-66-77-88-99-10
Score components

70%

9.0

Overall score

30%

1.0

Price

▼Worse than 78%
9.1

Technical score

Technical score
9.1/ 10
✕
What it is
An assessment of technical performance for products in the Graphics cards category across these key areas: Performance, Memory, Platform & Features, Connectivity & Media, Power & Cooling, Design.
When it matters
When you want to compare graphics cards based on technical performance and available features.
Score distribution
▼
<55-66-77-88-99-10
Score components

44%

9.9

Performance

24%

9.3

Memory

12%

6.7

Power & Cooling

11%

9.8

Platform & Features

5%

4.9

Design

4%

9.5

Connectivity & Media

▲Better than 88%
8.4

User score

User score
8.4/ 10
✕
What it is
A rating that combines user reviews and the total number of reviews received by the graphics card.
When it matters
When you want to understand how a graphics card performs in real use and how reliable it is in terms of performance, temperatures, noise, stability, and long-term ownership.
Score distribution
▼
<55-66-77-88-99-10
Score components

70%

9.2

User ratings

30%

6.5

Number of reviews

Based on ratings from across the web.
▲Better than 68%
  • galax-geforce-rtx-4090-sg-1-click-oc
  • galax-geforce-rtx-4090-sg-1-click-oc
  • galax-geforce-rtx-4090-sg-1-click-oc
  • galax-geforce-rtx-4090-sg-1-click-oc
  • galax-geforce-rtx-4090-sg-1-click-oc
  • galax-geforce-rtx-4090-sg-1-click-oc
  • galax-geforce-rtx-4090-sg-1-click-oc
galax-geforce-rtx-4090-sg-1-click-oc
Where to buy
*As an Amazon Associate, we earn from qualifying purchases.

What owners say about the GALAX GeForce RTX 4090 SG 1-Click OC

Based on 241 owners sharing their experience in online comments

78%positive9%mixed13%negative

Owners praise its exceptional gaming speed and longevity, while power draw and occasional driver problems remain the main drawbacks.

What owners dislike

  • Owners say frame rates can fall short in some demanding games and settings, especially at 4K or on very high-resolution VR headsets, where some need to drop settings badly.3
  • Owners report driver crashes, display errors and black screens at launch, and some features such as DLSS 3 frame generation not appearing for some users.3

Points mentioned by at least 3 owners, most mentioned first.

Loading...
Loading category ranking...

Technical Specifications of graphics card GALAX GeForce RTX 4090 SG 1 Click OC

Technical score
Technical score
9.1/ 10
✕
What it is
An assessment of technical performance for products in the Graphics cards category across these key areas: Performance, Memory, Platform & Features, Connectivity & Media, Power & Cooling, Design.
When it matters
When you want to compare graphics cards based on technical performance and available features.
Score distribution
▼
<55-66-77-88-99-10
Score components:

44%

9.9

Performance

24%

9.3

Memory

12%

6.7

Power & Cooling

11%

9.8

Platform & Features

5%

4.9

Design

4%

9.5

Connectivity & Media

9.1
User score
User score
8.4/ 10
✕
What it is
A rating that combines user reviews and the total number of reviews received by the graphics card.
When it matters
When you want to understand how a graphics card performs in real use and how reliable it is in terms of performance, temperatures, noise, stability, and long-term ownership.
Score distribution
▼
<55-66-77-88-99-10
Score components

70%

9.2

User ratings

30%

6.5

Number of reviews

Based on ratings from across the web.
8.4
Popularity
Popularity
6.5/ 10
✕
What it is
An indicator based on the number of reviews received by the graphics card.
When it matters
When you prefer a graphics card that has already been chosen and reviewed by many other users.
Score distribution
▼
<55-66-77-88-99-10
Popularity:
GALAX GeForce RTX 4090 SG 1 Click OC has a popularity score of 6.5 points, which is higher than that of 61.9% of products in this category.
6.5
Value for money
Value for money
6.6/ 10
✕
What it is
An indicator that combines the graphics card's overall rating with its cost.
When it matters
When you are looking for a graphics card that offers a strong balance of performance, features, and price.
Score distribution
▼
<55-66-77-88-99-10
Score components:

70%

9.0

Overall score

30%

1.0

Price

6.6
3DMark Time Spy benchmark score
38,000 points
This graphics card scores 38,000 points in 3DMark Time Spy, which is higher than 96.8% of graphics cards and equal to 0.7% of graphics cards.
3DMark Port Royal score
29,304 points
This graphics card scores 29,304 points in 3DMark Port Royal, which is higher than 96.8% of graphics cards.
PassMark (G3D) result
38,110 points
This graphics card scores 38,110 points in PassMark G3D, which is higher than 93.3% of graphics cards and equal to 0.7% of graphics cards.
PassMark (DirectCompute) result
26,333 points
This graphics card scores 26,333 points in PassMark DirectCompute, which is higher than 88.2% of graphics cards and equal to 2.9% of graphics cards.
Floating-point performance
85.04 TFLOPS
This graphics card delivers 85.04 TFLOPS floating-point performance, which is higher than that of 96.1% of graphics cards and equal to that of 0.1% of graphics cards.
Show more
VRAM
24 GB
This graphics card has 24 GB of VRAM, which is more than 91.1% of graphics cards and equal to 5.6% of graphics cards.
Memory type
GDDR6X
GDDR version
GDDR6X
This graphics card uses GDDR6X memory, which is newer than on 56.7% of graphics cards and equal to 22.7% of graphics cards.
Memory bus width
384 bit
This graphics card uses a 384 bit memory bus, which is wider than that of 89.3% of graphics cards and equal to that of 7.3% of graphics cards.
Maximum memory bandwidth
1,008 GB/s
This graphics card reaches 1,008 GB/s memory bandwidth, which is higher than that of 93.8% of graphics cards and equal to that of 3% of graphics cards.
Show more
PCI Express (PCIe) version
4
This graphics card supports PCIe 4, which is newer than on 22.3% of graphics cards and equal to 52.1% of graphics cards.
PCIe lanes
x16
This graphics card uses x16 PCIe lanes, which is more than 23.4% of graphics cards and equal to 76.6% of graphics cards.
DirectX version
12 Ultimate
This graphics card supports DirectX 12 Ultimate, which is more advanced than on 22.6% of graphics cards and equal to 77.4% of graphics cards.
Vulkan version
1.4
This graphics card supports Vulkan 1.4, which is more advanced than on 20.7% of graphics cards and equal to 79.3% of graphics cards.
OpenGL version
4.6
This graphics card supports OpenGL 4.6, which is more advanced than on 1.9% of graphics cards and equal to 98.1% of graphics cards.
Show more
Max displays supported
4
This graphics card supports up to 4 displays, which is more than 8.3% of graphics cards and equal to 88.9% of graphics cards.
Max digital resolution
7680x4320
This graphics card supports a maximum digital resolution of 7680x4320, which is higher than that of 9% of graphics cards and equal to that of 91% of graphics cards.
DisplayPort outputs
3
This graphics card offers 3 DisplayPort outputs, which is more than 21% of graphics cards and equal to 76.8% of graphics cards.
DisplayPort version
1.4a
This graphics card supports DisplayPort 1.4a, which is more advanced than on 19.5% of graphics cards and equal to 47.1% of graphics cards.
DisplayPort link rates
32.4 Gbps
This graphics card supports DisplayPort link rates up to 32.4 Gbps, which is faster than on 57.6% of graphics cards and equal to 21.5% of graphics cards.
Show more
Thermal Design Power (TDP)
450 W
This graphics card has a TDP of 450 W, which is higher than that of 94.1% of graphics cards and equal to that of 3.1% of graphics cards.
Power consumption while under peak load
509 W
This graphics card draws 509 W under peak load, which is higher than 96.7% of graphics cards.
Recommended PSU wattage
850 W
This graphics card recommends a 850 W PSU, which is higher than that of 83.1% of graphics cards and equal to that of 12.2% of graphics cards.
Board power limit
510 W
This graphics card has a board power limit of 510 W, which is higher than that of 96% of graphics cards and equal to that of 0.1% of graphics cards.
PCIe power spec
450 W
Show more
Size
352x 153x 74 mm
Length
336 mm
This graphics card is 336 mm long, which is longer than 87.6% of graphics cards and equal in length to 2% of graphics cards.
Height
138 mm
This graphics card is 138 mm tall, which is taller than 76.8% of graphics cards and equal in height to 1.3% of graphics cards.
Slot width
4 slot/s
This graphics card occupies 4 slot/s, which is wider than 97.6% of graphics cards and equal in width to 2.3% of graphics cards.
Weight
1,800 g
This graphics card weighs 1,800 g, which is heavier than 83.2% of graphics cards and equal in weight to 1.1% of graphics cards.
Show more

GALAX GeForce RTX 4090 SG 1 Click OC vs the average graphics card

246810TotalPerformanceMemoryPlatform & FeaturesConnectivity & MediaPower & CoolingDesign
  • 88 more compute units
    This graphics card has more compute units than the average graphics card (128 vs 40). The average graphics card has 40 compute units.
    128 vs 40
  • 88 more ray tracing cores
    This graphics card has more ray tracing cores than the average graphics card (128 vs 40). The average graphics card has 40 ray tracing cores.
    128 vs 40
  • 2.25x higher memory bandwidth
    This graphics card has a higher memory bandwidth than the average graphics card (1,008 GB/s vs 448 GB/s). The average graphics card has a memory bandwidth of 448 GB/s.
    1,008 GB/s vs 448 GB/s
  • 12 GB more VRAM
    This graphics card has more VRAM than the average graphics card (24 GB vs 12 GB). The average graphics card has 12 GB VRAM.
    24 GB vs 12 GB
  • 3.47x higher texture rate
    This graphics card has a higher texture rate than the average graphics card (1,321 GTexel/s vs 381.2 GTexel/s). The average graphics card has a texture rate of 381.2 GTexel/s.
    1,321 GTexel/s vs 381.2 GTexel/s
  • 112 more ROPs
    This graphics card has more ROPs than the average graphics card (176 vs 64). The average graphics card has 64 ROPs.
    176 vs 64
  • 328 more TMUs
    This graphics card has more TMUs than the average graphics card (512 vs 184). The average graphics card has 184 TMUs.
    512 vs 184
  • 2.78x higher pixel rate
    This graphics card has a higher pixel rate than the average graphics card (454.1 GPixel/s vs 163.2 GPixel/s). The average graphics card has a pixel rate of 163.2 GPixel/s.
    454.1 GPixel/s vs 163.2 GPixel/s
  • 4.8% higher user score
    User score
    8.4/ 10
    ✕
    What it is
    A rating that combines user reviews and the total number of reviews received by the graphics card.
    When it matters
    When you want to understand how a graphics card performs in real use and how reliable it is in terms of performance, temperatures, noise, stability, and long-term ownership.
    Score distribution
    ▼
    ▼
    <55-66-77-88-99-10
    GALAX GeForce RTX 4090 SG 1 Click OC
    the average graphics card
    GALAX GeForce RTX 4090 SG 1 Click OC has a higher user score than the average graphics card (8.38 vs 8.000).
    8.38 vs 8
  • 88 more compute units
    This graphics card has more compute units than the average graphics card (128 vs 40). The average graphics card has 40 compute units.
    128 vs 40
  • 88 more ray tracing cores
    This graphics card has more ray tracing cores than the average graphics card (128 vs 40). The average graphics card has 40 ray tracing cores.
    128 vs 40
  • 3.47x higher texture rate
    This graphics card has a higher texture rate than the average graphics card (1,321 GTexel/s vs 381.2 GTexel/s). The average graphics card has a texture rate of 381.2 GTexel/s.
    1,321 GTexel/s vs 381.2 GTexel/s
  • 112 more ROPs
    This graphics card has more ROPs than the average graphics card (176 vs 64). The average graphics card has 64 ROPs.
    176 vs 64
  • 328 more TMUs
    This graphics card has more TMUs than the average graphics card (512 vs 184). The average graphics card has 184 TMUs.
    512 vs 184
  • 2.78x higher pixel rate
    This graphics card has a higher pixel rate than the average graphics card (454.1 GPixel/s vs 163.2 GPixel/s). The average graphics card has a pixel rate of 163.2 GPixel/s.
    454.1 GPixel/s vs 163.2 GPixel/s
  • 368 more AI cores
    This graphics card has more AI cores than the average graphics card (512 vs 144). The average graphics card has 144 AI cores.
    512 vs 144
  • 3.75x higher FP32 performance
    This graphics card has a higher FP32 performance than the average graphics card (84.5 TFLOPS vs 22.57 TFLOPS). The average graphics card has FP32 performance of 22.57 TFLOPS.
    84.54 TFLOPS vs 22.57 TFLOPS
  • 3% higher boost clock speed
    This graphics card has a higher boost GPU clock than the average graphics card (2,580 MHz vs 2,505 MHz). The average graphics card has a boost GPU clock of 2,505 MHz.
    2,580 MHz vs 2,505 MHz
  • 2.59x higher gaming score
    This graphics card has a higher gaming score than the average graphics card (38,000 points vs 14,678.5 points). The average graphics card has a gaming score of 14,678.5 points.
    38,000 points vs 14,678.5 points
  • 3.2x higher ray tracing score
    This graphics card has a higher ray tracing score than the average graphics card (29,304 points vs 9,166 points). The average graphics card has a ray tracing score of 9,166 points.
    29,304 points vs 9,166 points
  • 16.4% higher base clock speed
    This graphics card has a higher base GPU clock than the average graphics card (2,235 MHz vs 1920 MHz). The average graphics card has a base GPU clock of 1920 MHz.
    2,235 MHz vs 1,920 MHz
  • 68.2% higher PassMark score
    This graphics card has a higher PassMark score than the average graphics card (38,110 points vs 22,653 points). The average graphics card has a PassMark score of 22,653 points.
    38,110 points vs 22,653 points
  • 5.46x higher INT8 performance
    This graphics card has a higher INT8 performance than the average graphics card (1,321 TOPS vs 242 TOPS). The average graphics card has INT8 performance of 242 TOPS.
    1,321 TOPS vs 242 TOPS
  • 12,032 more FP32 units
    This graphics card has more FP32 units than the average graphics card (16,384 vs 4,352). The average graphics card has 4,352 FP32 units.
    16,384 vs 4,352
  • 2.77x higher FP64 performance
    This graphics card has a higher FP64 performance than the average graphics card (1.3 TFLOPS vs 0.48 TFLOPS). The average graphics card has FP64 performance of 0.48 TFLOPS.
    1.33 TFLOPS vs 0.48 TFLOPS
  • 4.65x higher BF16 performance
    This graphics card has a higher BF16 performance than the average graphics card (165.2 TFLOPS vs 35.5 TFLOPS). The average graphics card has BF16 performance of 35.5 TFLOPS.
    165.2 TFLOPS vs 35.5 TFLOPS
  • 3.7x higher compute throughput
    This graphics card has a higher compute throughput than the average graphics card (85 TFLOPS vs 22.98 TFLOPS). The average graphics card has compute throughput of 22.98 TFLOPS.
    85.04 TFLOPS vs 22.98 TFLOPS
  • 2.18x higher compute score
    This graphics card has a higher compute score than the average graphics card (26,333 points vs 12,074 points). The average graphics card has a compute score of 12,074 points.
    26,333 points vs 12,074 points
  • 2.78x higher FP16 performance
    This graphics card has a higher FP16 performance than the average graphics card (82.6 TFLOPS vs 29.7 TFLOPS). The average graphics card has FP16 performance of 29.725 TFLOPS.
    82.6 TFLOPS vs 29.725 TFLOPS
  • 2.25x higher memory bandwidth
    This graphics card has a higher memory bandwidth than the average graphics card (1,008 GB/s vs 448 GB/s). The average graphics card has a memory bandwidth of 448 GB/s.
    1,008 GB/s vs 448 GB/s
  • 12 GB more VRAM
    This graphics card has more VRAM than the average graphics card (24 GB vs 12 GB). The average graphics card has 12 GB VRAM.
    24 GB vs 12 GB
  • 128 bit wider memory bus
    This graphics card has a wider memory bus than the average graphics card (384 bit vs 256 bit). The average graphics card has a memory bus width of 256 bit.
    384 bit vs 256 bit
  • Supports ECC memory
    This graphics card supports ECC memory, the average graphics card does not.
  • 3x larger L2 cache
    This graphics card has more L2 cache than the average graphics card (72 MB vs 24 MB). The average graphics card has 24 MB L2 cache.
    72 MB vs 24 MB
  • 18x more Infinity Cache
    This graphics card has more Infinity Cache than the average graphics card (72 MB vs 4 MB). The average graphics card has 4 MB Infinity Cache.
    72 MB vs 4 MB
  • 10.5% faster memory speed
    This graphics card has a higher effective memory speed than the average graphics card (21,000 MHz vs 19,000 MHz). The average graphics card reaches an effective memory speed of 19,000 MHz.
    21,000 MHz vs 19,000 MHz
  • 20% smaller process node
    This graphics card has a lower process node than the average graphics card (4 nm vs 5 nm). The average graphics card uses a process node of 5 nm.
    4 nm vs 5 nm
  • 3.33x more transistors
    This graphics card has more transistors than the average graphics card (76,300 million vs 22,900 million). The average graphics card has 22,900 million transistors.
    76,300 million vs 22,900 million
  • 8 °C lower idle temperature
    This graphics card has a lower idle temperature than the average graphics card (29 °C vs 37 °C). The average graphics card has an idle temperature of 37 °C.
    29 °C vs 37 °C
  • 2.09x higher TDP
    This graphics card has a higher TDP than the average graphics card (450 W vs 215 W). The average graphics card has a TDP of 215 W.
    450 W vs 215 W
  • No dual BIOS
    This graphics card does not include dual BIOS, the average graphics card does.
    No vs yes
  • 30.8% higher PSU requirement
    This graphics card has a higher PSU requirement than the average graphics card (850 W vs 650 W). The average graphics card has a PSU requirement of 650 W.
    850 W vs 650 W
  • 1.5 slot/s wider design
    This graphics card occupies more slots than the average graphics card (4 slot/s vs 2.5 slot/s). The average graphics card occupies 2.5 slot/s.
    4 slot/s vs 2.5 slot/s
  • 51 mm longer card length
    This graphics card is longer than the average graphics card (336 mm vs 285 mm). The average graphics card has a length of 285 mm.
    336 mm vs 285 mm
  • 2.27x higher board power limit
    This graphics card has a higher board power limit than the average graphics card (510 W vs 225 W). The average graphics card has a board power limit of 225 W.
    510 W vs 225 W
  • 25% slower VRAM clock
    This graphics card has a lower VRAM clock than the average graphics card (1,313 MHz vs 1,750 MHz). The average graphics card runs its VRAM at 1,750 MHz.
    1,313 MHz vs 1,750 MHz
  • 13 mm higher card profile
    This graphics card is taller than the average graphics card (138 mm vs 125 mm). The average graphics card has a height of 125 mm.
    138 mm vs 125 mm
  • 3.49x more expensive
    GALAX GeForce RTX 4090 SG 1 Click OC is more expensive than the average graphics card (£1,850 vs £530).
    £1,850 vs £530
  • 8.6% worse value for money
    GALAX GeForce RTX 4090 SG 1 Click OC has worse value for money than the average graphics card (6.63 vs 7.2).
    6.63 vs 7.2
  • 25% slower VRAM clock
    This graphics card has a lower VRAM clock than the average graphics card (1,313 MHz vs 1,750 MHz). The average graphics card runs its VRAM at 1,750 MHz.
    1,313 MHz vs 1,750 MHz
  • 2.06x larger GPU die
    This graphics card has a higher GPU die size than the average graphics card (609 mm² vs 295 mm²). The average graphics card has a GPU die size of 295 mm².
    609 mm² vs 295 mm²
  • 1 older
    This graphics card was released earlier than the average graphics card (2022 vs 2023).
    October 2022
    2,022 vs 2,023
  • Narrower encode codec support
    This graphics card supports narrower hardware encode codec support than the average graphics card (H.264/H.265/AV1 vs H.264/H.265/AV1/VP9).
    H.264/H.265/AV1 vs H.264/H.265/AV1/VP9
  • Older NVDEC generation
    This graphics card has a lower NVDEC generation than the average graphics card (5 vs 6). The average graphics card offers NVDEC generation 6.
    5 vs 6
  • 2.09x higher TDP
    This graphics card has a higher TDP than the average graphics card (450 W vs 215 W). The average graphics card has a TDP of 215 W.
    450 W vs 215 W
  • No dual BIOS
    This graphics card does not include dual BIOS, the average graphics card does.
    No vs yes
  • 30.8% higher PSU requirement
    This graphics card has a higher PSU requirement than the average graphics card (850 W vs 650 W). The average graphics card has a PSU requirement of 650 W.
    850 W vs 650 W
  • 2.27x higher board power limit
    This graphics card has a higher board power limit than the average graphics card (510 W vs 225 W). The average graphics card has a board power limit of 225 W.
    510 W vs 225 W
  • 10 °C lower thermal ceiling
    This graphics card has a lower thermal ceiling than the average graphics card (105 °C vs 95 °C). The average graphics card has a thermal ceiling of 95 °C.
    105 °C vs 95 °C
  • 2.31x higher peak power draw
    This graphics card has a higher peak power draw than the average graphics card (509 W vs 220 W). The average graphics card has a peak power draw of 220 W.
    509 W vs 220 W
  • 75% higher idle power draw
    This graphics card has a higher idle power draw than the average graphics card (21 W vs 12 W). The average graphics card has an idle power draw of 12 W.
    21 W vs 12 W
  • 51 mm longer card length
    This graphics card is longer than the average graphics card (336 mm vs 285 mm). The average graphics card has a length of 285 mm.
    336 mm vs 285 mm
  • 1.5 slot/s wider design
    This graphics card occupies more slots than the average graphics card (4 slot/s vs 2.5 slot/s). The average graphics card occupies 2.5 slot/s.
    4 slot/s vs 2.5 slot/s
  • 13 mm higher card profile
    This graphics card is taller than the average graphics card (138 mm vs 125 mm). The average graphics card has a height of 125 mm.
    138 mm vs 125 mm
  • 76.3% heavier card weight
    This graphics card is heavier than the average graphics card (1,800 g vs 1,021 g). The average graphics card weighs 1,021 g.
    1,800 g vs 1,021 g

Video reviews

Hands-on testing, unboxing, and real-world video evaluations

7.0
Tally Ho Tech
≈ estimated
22/11/2022
Hands-on review · gaming tests, power limit and overclocking
Verdict
GALAX GeForce RTX 4090 SG 1-Click OC is a fast, easy card for buyers who skip overclocking, though rival cards feel better built.
9.0
XxViciousxX
≈ estimated
24/10/2023
First look · unboxing, installation and benchmarks
Verdict
GALAX GeForce RTX 4090 SG 1-Click OC is a powerful card that should last until the next generation arrives.
Not graded
Not graded
Not graded
Not graded
Not graded

Third-party reviews

Based on ratings from across the web.
Reviews last updated: November 2026 · How we calculate this

What customers like about GALAX GeForce RTX 4090 SG 1 Click OC

  • Excellent thermal performance, typically maintaining temperatures under 60-70°C even under heavy loads
  • Strong overclocking potential, with some users reaching over 3.0 GHz
  • Bundled accessories include a unique clip-on 1-Clip Booster 2.0 rear fan and an ARGB anti-sag support bracket
  • Quiet operation under normal gaming loads; fans are nearly inaudible at lower speeds
  • High build quality often compared to premium models from other manufacturers
  • Low to zero reported coil whine according to multiple user experiences

What customers don't like about GALAX GeForce RTX 4090 SG 1 Click OC

  • Massive physical dimensions (over three slots wide) that may require a case upgrade or limit compatibility
  • The additional 1-Clip Booster fan can interfere with RAM sticks on certain motherboard layouts
  • High power requirements, with users recommending at least an 850W-1000W power supply
  • Significant noise levels once fan speeds exceed 70-80%
  • Expensive price point, though competitive among other high-end RTX 4090 variants
  • Limited availability in certain regions like North America, where it is often sold under the KFA2 brand

Verdict

The Galax GeForce RTX 4090 SG 1-Click OC is a powerhouse graphics card built on the NVIDIA Ada Lovelace architecture, featuring 16,384 CUDA cores and 24GB of high-speed GDDR6X memory on a 384-bit bus. It operates with a base clock of 2,235 MHz and a boost clock of 2,580 MHz, which can be further pushed to 2,595 MHz using the 1-Click OC software. Key characteristics include its massive 3.8-slot design, a 22-phase power delivery system, and an innovative cooling setup with triple 102mm WINGS 2.0 fans and an attachable 1-Clip Booster 2.0 fan for the backplate. Main pros include its exceptional 4K gaming performance, robust cooling that maintains temperatures around 60°C under load, and the inclusion of premium accessories like an ARGB support stick. Notable cons are its enormous physical footprint which may cause clearance issues with RAM or smaller cases, a high 450W power requirement, and a largely plastic shroud that some may find less premium than metal alternatives.

Compare GALAX GeForce RTX 4090 SG 1 Click OC with other products in the Graphics cards category

1Product to compare no. 1
VS
2Product to compare no. 2
VS
3Product to compare no. 3 (optional)

Graphic comparison of GALAX GeForce RTX 4090 SG 1 Click OC and other products in the Graphics cards category

No results found