Scored using Tablets Methodology v3.0
Tablets Methodology v3.0
Mathematical & Unbiased Scoring
Products in this category are scored under Frontum Tablets Methodology v3.0: the technical score from the specifications is the base, and independent expert and video reviews (up to ±0.5 points), owner opinions (up to ±0.3) and best-of lists (up to +0.3) move it up or down.
Explore Tablets Methodology v3.0

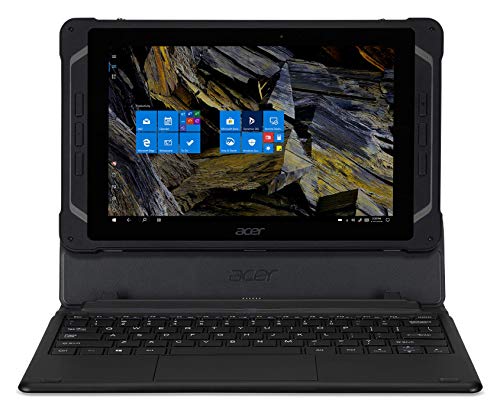
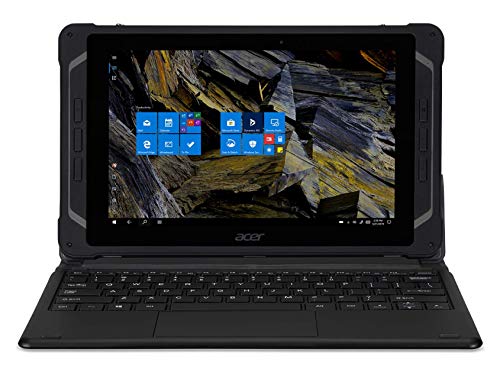
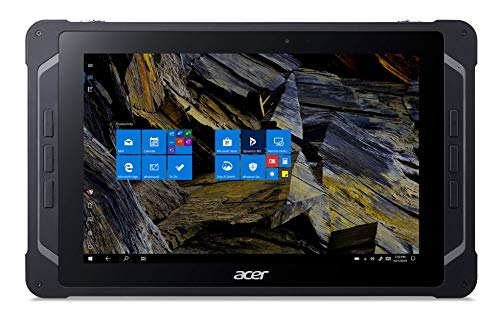
Acer Enduro T1 ET110-31W (4GB + 64GB) review: 168 specs compared

Avg. price:~£280RAM capacity:4 GBInternal storage:64 GBScreen size:10.1 inchesChipset:Intel Celeron N3450

Acer Enduro T1 ET110-31W (4GB + 64GB) Review: Compare 168 technical specifications and 1 expert reviews to see how this product ranks in the Tablets category and whether it is worth buying.
Acer Enduro T1 ET110-31W (4GB + 64GB)
6.4/10

Overall score

Score
6.4/ 10
✕
What it is
Our main score for this model, 1–10. It combines specs, best-of lists, expert reviews and owners.
How we count it
Parts: Technical score 35%, List score 30%, Reviews score 25%, Sentiment score 10%
Marks: Each part gets a mark out of 10. For reviews, lists and owners, a typical model in this category gets about 8 and the best one gets 10.
No data yet: A part with no data shows "?". It counts as the mark of a weaker model in this category (4 in 5 models with data score higher). This way, models with reviews, lists and owners usually come out ahead.
Score distribution
▼
<55-66-77-88-99-10
Score components

35%

5.7

Technical score

30%

?

List scoreNot enough data yet, so we use 7.5, the mark of a weaker model in this category

25%

5.7

Reviews score

10%

?

Sentiment scoreNot enough data yet, so we use 6.9, the mark of a weaker model in this category

▼Worse than 74% of tablets
7.2

Value for money

Value for money
7.2/ 10
✕
What it is
An indicator that combines the tablet's overall rating with its cost.
When it matters
When you are looking for a tablet with a good balance between quality and price.
Score distribution
▼
<55-66-77-88-99-10
Score components

70%

6.4

Overall score

30%

9.0

Price

▼Worse than 72%
5.7

Technical score

Technical score
5.7/ 10
✕
What it is
How good the specs are compared with the other models in this category, 1–10.
How we count it
Areas: We rate the specs in each area against the other models in this category.
Weighting: The areas that matter most to buyers count more. The shares are shown under Score components.
Share: The technical score is 35% of the overall score.
Score distribution
▼
<55-66-77-88-99-10
Score components

22%

5.3

Performance

20%

4.8

Display

16%

5.3

Camera

14%

6.6

Battery

12%

7.1

Connectivity

8%

7.9

Software

5%

4.7

Design

3%

4.7

Audio

▼Worse than 62%
5.7

Reviews score

Reviews score
5.7/ 10
✕
What it is
Average grade from independent test sites, magazines and video reviewers, 1–10.
How we count it
Grades: Each review's own score is converted to 1–10; without one, we grade the review ourselves. Big test sites count more, short reviews half as much as full tests. A video review counts half.
Score: The average grade is 80% of the review mark; the number of reviews is the other 20% (1 review = 5, the typical number in this category = 8, the most-reviewed model = 10).
Enough data: With few reviews, the average grade is pulled toward the typical grade of this category. No reviews yet: 7.4 for now.
Share: Reviews count 25% of the overall score.
Score distribution
▼
<55-66-77-88-99-10

5.7

Mark 7.4 is below the typical mark 7.8 of this category, so it cannot lift the score above the technical score

80%

8.1

Average grade

20%

5.0

Popularity

Grades by review (1)
1 review, its grade estimated from the review text. Reviews count 25% of the overall score.
User ratings collected online are not part of this score.
▼Worse than 74%
?

List score

List score
7.5/ 10
✕
What it is
How often independent test sites, magazines and video reviewers put this model in their best-of lists for this category.
How we count it
Points: The model in the most lists of this category gets 10; the others get 8 to 10 in proportion. In no list yet: 7.5. Lists count 30% of the overall score.
Enough data: Every list counts, even a single one. With fewer than 5 best-of lists in the category, this part is left out.
Lists with this model (0)
Not in any best-of list yet, so this part counts as 7.5. Models in a list get 8 to 10.
Not in any best-of list yet
  • acer-enduro-t1-et110-31w-4gb-64gb
  • acer-enduro-t1-et110-31w-4gb-64gb
  • acer-enduro-t1-et110-31w-4gb-64gb
  • acer-enduro-t1-et110-31w-4gb-64gb
  • acer-enduro-t1-et110-31w-4gb-64gb
  • acer-enduro-t1-et110-31w-4gb-64gb
  • acer-enduro-t1-et110-31w-4gb-64gb
  • acer-enduro-t1-et110-31w-4gb-64gb
  • acer-enduro-t1-et110-31w-4gb-64gb
  • acer-enduro-t1-et110-31w-4gb-64gb
  • acer-enduro-t1-et110-31w-4gb-64gb
  • acer-enduro-t1-et110-31w-4gb-64gb
  • acer-enduro-t1-et110-31w-4gb-64gb
  • acer-enduro-t1-et110-31w-4gb-64gb
  • acer-enduro-t1-et110-31w-4gb-64gb
  • acer-enduro-t1-et110-31w-4gb-64gb
  • acer-enduro-t1-et110-31w-4gb-64gb
acer-enduro-t1-et110-31w-4gb-64gb
Where to buy
*As an Amazon Associate, we earn from qualifying purchases.
Best rankings
Available: ranking among products currently available (including other versions of this product).All: ranking among all products in the database.
Loading...
Loading category ranking...

Technical Specifications of tablet Acer Enduro T1 ET110-31W (4GB + 64GB)

Technical score
Technical score
5.7/ 10
✕
What it is
How good the specs are compared with the other models in this category, 1–10.
How we count it
Areas: We rate the specs in each area against the other models in this category.
Weighting: The areas that matter most to buyers count more. The shares are shown under Score components.
Share: The technical score is 35% of the overall score.
Score distribution
▼
<55-66-77-88-99-10
Score components:

22%

5.3

Performance

20%

4.8

Display

16%

5.3

Camera

14%

6.6

Battery

12%

7.1

Connectivity

8%

7.9

Software

5%

4.7

Design

3%

4.7

Audio

5.7
Reviews score
5.7
List score
?
Value for money
Value for money
7.2/ 10
✕
What it is
An indicator that combines the tablet's overall rating with its cost.
When it matters
When you are looking for a tablet with a good balance between quality and price.
Score distribution
▼
<55-66-77-88-99-10
Score components:

70%

6.4

Overall score

30%

9.0

Price

7.2
RAM capacity
4 GB
This tablet has 4 GB of RAM, which is more than 47.2% of tablets and equal to 17.8% of tablets.
Process node
14 nm
This tablet is built on a 14 nm process, which is smaller than 44.6% of tablets and equal to 8.5% of tablets.
Internal storage
64 GB
This tablet has 64 GB of internal storage, which is more than 39.1% of tablets and equal to 17% of tablets.
Geekbench 6 single-core score
244 points
This tablet scores 244 points in single-core tests, which is lower than 89% of tablets and equal to 0.1% of tablets.
Chipset
Intel Celeron N3450
This tablet runs on Intel Celeron N3450, which is less advanced than 57.7% of tablets.
Show more
Screen resolution
1280×800
This tablet has a 1280×800 screen, which is less sharp than 68.1% of tablets and equal to 21.7% of tablets.
Refresh rate
60 Hz
This tablet has a 60 Hz screen, which is smoother than 0.1% of tablets and equal to 73.4% of tablets.
Display type
IPS LCD
This tablet uses a IPS LCD display type. 17% of tablets use this display technology.
Pixel density
149 ppi
This tablet has a pixel density of 149 ppi, which is lower than 86.8% of tablets and equal to 9.2% of tablets.
Display glass type
Corning Gorilla Glass
This tablet protects its screen with Corning Gorilla Glass, which is more durable than 45.4% of tablets and the same as 32.8% of tablets.
Show more
Optical image stabilization
no
This tablet does not support optical stabilisation. 0.4% of tablets offer this.
Main camera megapixels
5 MP
This tablet has a rear camera with 5 MP resolution, which is lower than 63.7% of tablets and equal to 26% of tablets.
Front camera megapixels
2 MP
This tablet has a front camera with 2 MP resolution, which is lower than 53.8% of tablets and equal to 25.5% of tablets.
Main camera aperture
?
Optical zoom
1xxx
This tablet has 1xx optical zoom, which is stronger than 18.2% of tablets and equal to 80.9% of tablets.
Show more
Battery capacity
4,870 mAh
This tablet has 4,870 mAh battery capacity, which is smaller than 72.9% of tablets.
Charging speed
45 W
This tablet charges at 45 W, which is faster than 83.8% of tablets and equal to 6.7% of tablets.
Battery life
10 hours
This tablet has a battery life of 10 hours, which is longer than that of 39.1% of tablets and equal to that of 20.5% of tablets.
Wireless charging
no
This tablet does not support wireless charging. 1.5% of tablets offer this.
Fast charging
yes
This tablet supports fast charging. 43.2% of tablets offer this.
Show more
LTE support
no
This tablet does not have built-in LTE. 42.9% of tablets offer this.
Wi-Fi connectivity
yes
This tablet connects to Wi-Fi. 0.2% of tablets offer this.
GPS
yes
This tablet has built-in GPS. 17.1% of tablets offer this.
5G connectivity
no
This tablet does not support 5G. 8.1% of tablets offer this.
NFC
no
This tablet does not include NFC. 10.8% of tablets offer this.
Show more
Operating system
Windows
This tablet uses the Windows operating system, which is less advanced than the one used by 84.2%.
Update support duration
?
Direct OS updates
yes
This tablet supports direct OS updates. 20.3% of tablets offer this.
On-device AI
no
This tablet does not support on-device AI. 28.3% of tablets support this capability.
App tracking protection
no
This tablet does not support app tracking protection. 28.4% of tablets offer this.
Show more
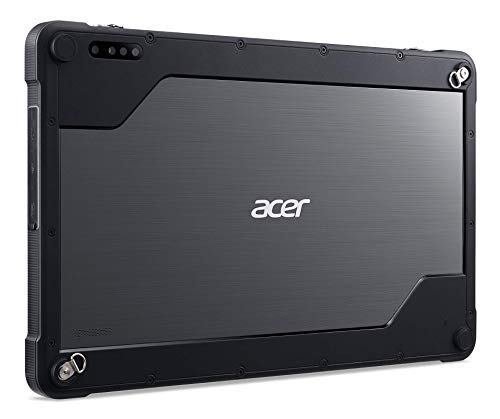
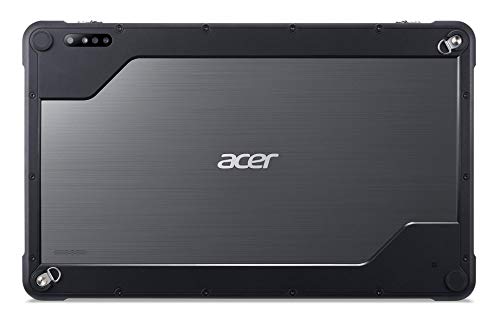
IP rating
IP54
This tablet's IP rating is IP54, which is more protected than 91.8% of tablets and the same as 1.3% of tablets.
Weight
950 g
This tablet weighs 950 g, which is heavier than 97.1% of tablets and equal to 0.1% of tablets.
Backlit keyboard
no
This tablet does not support a backlit keyboard. 9.7% of tablets support backlit keyboards.
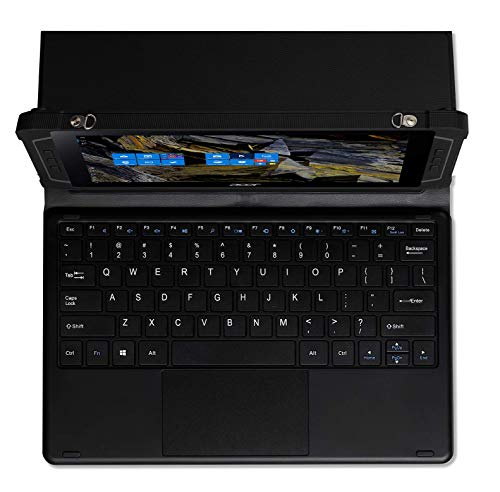
Keyboard accessory
yes
This tablet supports a keyboard accessory. 15.8% of tablets support this option.
Pen latency
N/A
Show more
Number of microphones
1
This tablet has a microphone array of 1, which is more than 0.2% of tablets and equal to 54.8% of tablets.
aptX Adaptive
no
This tablet does not support aptX Adaptive. 6.9% of tablets offer this.
Dolby Atmos support
?
N. of speakers
1
This tablet includes 1 speakers, which is fewer than in 90.3% of tablets and equal to the number in 9.6% of tablets.
FM radio
no
This tablet does not include an FM radio. 19% of tablets offer this.
Show more

Acer Enduro T1 ET110-31W (4GB + 64GB) vs the average tablet

246810TotalPerformanceDisplayCameraBatteryConnectivitySoftwareDesignAudio
  • 2.5x faster charging
    This tablet charges faster than the average tablet (45 W vs 18 W). The average tablet charges at 18 W.
    45 W vs 18 W
  • Supports DisplayPort over USB-C
    This tablet supports DisplayPort over USB-C, the average tablet does not. 21.3% of tablets support DisplayPort over USB-C.
  • More dust and water protection
    This tablet offers better dust and water protection than the average tablet (IP54 vs not rated).
    IP54 vs not rated
  • Includes anti-reflection coating
    This tablet has anti-reflection coating, the average tablet does not. 24.6% of tablets use anti-reflection coating.
  • More advanced chipset
    This tablet has a more advanced chipset than the average tablet (Intel Celeron N3450 vs MediaTek MT8169A).
    Intel Celeron N3450 vs MediaTek MT8169A
  • Wider front camera aperture
    This tablet has a wider front camera aperture than the average tablet (f/2 vs f/2.2). The average tablet's front camera aperture is f/2.2.
    f/2.0 vs f/2.2
  • Monitors battery health
    This tablet monitors battery health, while the average tablet does not. 36.7% of tablets monitor battery health.
  • Faster USB ports
    This tablet has faster USB ports than the average tablet (USB 3.2 Gen 1 vs USB 2).
    USB 3.2 Gen 1 vs USB 2.0
  • More advanced chipset
    This tablet has a more advanced chipset than the average tablet (Intel Celeron N3450 vs MediaTek MT8169A).
    Intel Celeron N3450 vs MediaTek MT8169A
  • 8 more GPU execution units
    This tablet has more GPU execution units than the average tablet (12 vs 4). The average tablet has 4 GPU execution units.
    12 vs 4
  • More advanced memory type
    This tablet uses more advanced memory than the average tablet (LPDDR4 vs LPDDR3).
    LPDDR4 vs LPDDR3
  • 10% higher CPU speed
    This tablet has a higher CPU speed than the average tablet (2.2 GHz vs 2 GHz). The average tablet has CPU speed of 2 GHz.
    2.2 GHz vs 2 GHz
  • Includes anti-reflection coating
    This tablet has anti-reflection coating, the average tablet does not. 24.6% of tablets use anti-reflection coating.
  • Wider front camera aperture
    This tablet has a wider front camera aperture than the average tablet (f/2 vs f/2.2). The average tablet's front camera aperture is f/2.2.
    f/2.0 vs f/2.2
  • 2.5x faster charging
    This tablet charges faster than the average tablet (45 W vs 18 W). The average tablet charges at 18 W.
    45 W vs 18 W
  • Monitors battery health
    This tablet monitors battery health, while the average tablet does not. 36.7% of tablets monitor battery health.
  • Supports DisplayPort over USB-C
    This tablet supports DisplayPort over USB-C, the average tablet does not. 21.3% of tablets support DisplayPort over USB-C.
  • Faster USB ports
    This tablet has faster USB ports than the average tablet (USB 3.2 Gen 1 vs USB 2).
    USB 3.2 Gen 1 vs USB 2.0
  • Fingerprint unlocking
    This tablet supports fingerprint unlocking, while the average tablet does not. 16% of tablets offer this.
    Side-mounted fingerprint scanner.
  • Supports HDMI output
    This tablet supports HDMI output, while the average tablet does not. 49.8% of tablets offer this.
  • Supports app offloading
    This tablet supports app offloading, while the average tablet does not. 26.3% of tablets offer this.
  • Supports dynamic themes
    This tablet supports dynamic themes, while the average tablet does not. 29.5% of tablets offer this.
  • More dust and water protection
    This tablet offers better dust and water protection than the average tablet (IP54 vs not rated).
    IP54 vs not rated
  • 4 fewer CPU threads
    This tablet has fewer CPU threads than the average tablet (4 vs 8). The average tablet has 8 CPU threads.
    4 vs 8
  • 3 MP lower front resolution
    This tablet has a lower-resolution front camera than the average tablet (2 MP vs 5 MP). The average tablet has a front camera of 5 MP.
    2 MP vs 5 MP
  • Less advanced operating system
    This tablet runs on a less advanced operating system than the average tablet (Windows vs Android). Operating system choice shapes app support, updates, and ecosystem features.
    Windows vs Android
  • 32.6% softer screen detail
    This tablet has softer screen detail than the average tablet (149 ppi vs 221 ppi). The average tablet has a pixel density of 221 ppi.
    149 ppi vs 221 ppi
  • 93.9% heavier
    This tablet is heavier than the average tablet (950 g vs 490 g). The average tablet weighs 490 g.
    950 g vs 490 g
  • 3 MP lower rear resolution
    This tablet has a lower-resolution rear camera than the average tablet (5 MP vs 8 MP). The average tablet has a rear camera of 8 MP.
    5 MP vs 8 MP
  • 18.6% lower review score
    Reviews score
    5.7/ 10
    ✕
    What it is
    Average grade from independent test sites, magazines and video reviewers, 1–10.
    How we count it
    Grades: Each review's own score is converted to 1–10; without one, we grade the review ourselves. Big test sites count more, short reviews half as much as full tests. A video review counts half.
    Score: The average grade is 80% of the review mark; the number of reviews is the other 20% (1 review = 5, the typical number in this category = 8, the most-reviewed model = 10).
    Enough data: With few reviews, the average grade is pulled toward the typical grade of this category. No reviews yet: 7.4 for now.
    Share: Reviews count 25% of the overall score.
    Score distribution
    ▼
    <55-66-77-88-99-10

    5.7

    Mark 7.4 is below the typical mark 7.8 of this category, so it cannot lift the score above the technical score

    80%

    8.1

    Average grade

    20%

    5.0

    Popularity

    Grades by review (1)
    1 review, its grade estimated from the review text. Reviews count 25% of the overall score.
    User ratings collected online are not part of this score.
    5.7 vs 7.0
  • No tap-to-focus
    This tablet does not support touch autofocus, while the average tablet does. 83% of tablets support touch autofocus.
  • 18.6% lower review score
    Reviews score
    5.7/ 10
    ✕
    What it is
    Average grade from independent test sites, magazines and video reviewers, 1–10.
    How we count it
    Grades: Each review's own score is converted to 1–10; without one, we grade the review ourselves. Big test sites count more, short reviews half as much as full tests. A video review counts half.
    Score: The average grade is 80% of the review mark; the number of reviews is the other 20% (1 review = 5, the typical number in this category = 8, the most-reviewed model = 10).
    Enough data: With few reviews, the average grade is pulled toward the typical grade of this category. No reviews yet: 7.4 for now.
    Share: Reviews count 25% of the overall score.
    Score distribution
    ▼
    <55-66-77-88-99-10

    5.7

    Mark 7.4 is below the typical mark 7.8 of this category, so it cannot lift the score above the technical score

    80%

    8.1

    Average grade

    20%

    5.0

    Popularity

    Grades by review (1)
    1 review, its grade estimated from the review text. Reviews count 25% of the overall score.
    User ratings collected online are not part of this score.
    5.7 vs 7.0
  • 5.1% worse value for money
    Acer Enduro T1 ET110-31W (4GB + 64GB) has worse value for money than the average tablet (7.18 vs 7.6).
    7.18 vs 7.55
  • 4 fewer CPU threads
    This tablet has fewer CPU threads than the average tablet (4 vs 8). The average tablet has 8 CPU threads.
    4 vs 8
  • 63.9% lower multi-core score
    This tablet has a lower multi-core score than the average tablet (682 points vs 1,891 points). The average tablet scores 1,891 points in multi-core tests.
    682 points vs 1,891 points
  • 66.5% lower single-core score
    This tablet has a lower single-core score than the average tablet (244 points vs 729 points). The average tablet scores 729 points in single-core tests.
    244 points vs 729 points
  • No big.LITTLE architecture
    This tablet does not support big.LITTLE architecture, while the average tablet does. 51.7% of tablets support big.LITTLE architecture.
  • 14.1% less memory bandwidth
    This tablet has less memory bandwidth than the average tablet (12.8 GB/s vs 14.9 GB/s). The average tablet has 14.9 GB/s of memory bandwidth.
    12.8 GB/s vs 14.9 GB/s
  • More basic graphics
    This tablet has less advanced graphics than the average tablet (Intel HD Graphics 500 vs Mali-G51).
    Intel HD Graphics 500 vs Mali-G51
  • 32.6% softer screen detail
    This tablet has softer screen detail than the average tablet (149 ppi vs 221 ppi). The average tablet has a pixel density of 221 ppi.
    149 ppi vs 221 ppi
  • Less sharp display
    This tablet has a less sharp screen than the average tablet (1280×800 vs 1920×1200).
    1,280×800 vs 1,920×1,200
  • 51 nits dimmer screen
    This tablet is dimmer than the average tablet (350 nits vs 401 nits). The average tablet reaches 401 nits.
    350 nits vs 401 nits
  • Less vivid contrast
    This tablet has less contrast than the average tablet (800:1 vs 1015:1). The average tablet has a contrast ratio of 1015:1.
    800:1 vs 1,015:1
  • 50 nits lower typical brightness
    This tablet has a lower typical brightness than the average tablet (350 nits vs 400 nits). The average tablet reaches 400 nits typical brightness.
    350 nits vs 400 nits
  • 3 MP lower front resolution
    This tablet has a lower-resolution front camera than the average tablet (2 MP vs 5 MP). The average tablet has a front camera of 5 MP.
    2 MP vs 5 MP
  • 3 MP lower rear resolution
    This tablet has a lower-resolution rear camera than the average tablet (5 MP vs 8 MP). The average tablet has a rear camera of 8 MP.
    5 MP vs 8 MP
  • No tap-to-focus
    This tablet does not support touch autofocus, while the average tablet does. 83% of tablets support touch autofocus.
  • No HDR photo mode
    This tablet does not have HDR photo mode, the average tablet does. 79.8% of tablets support HDR photo mode.
  • No manual white balance
    This tablet does not support manual white balance, while the average tablet does. 51.5% of tablets support manual white balance.
  • No burst mode
    This tablet does not support burst mode, the average tablet does. 60.6% of tablets support burst mode.
  • No backside-illuminated sensor
    This tablet does not have a BSI sensor, while the average tablet does. 52.6% of tablets have a BSI sensor.
  • 26.2% smaller battery capacity
    This tablet has a smaller battery capacity than the average tablet (4,870 mAh vs 6,600 mAh). The average tablet offers 6,600 mAh of battery capacity.
    4,870 mAh vs 6,600 mAh
  • No face recognition
    This tablet does not have face recognition, the average tablet does. 56.4% of tablets support face recognition.
  • Older Bluetooth version
    This tablet has an older Bluetooth version than the average tablet (4.2 vs 5).
    4.2 vs 5
  • Less advanced operating system
    This tablet runs on a less advanced operating system than the average tablet (Windows vs Android). Operating system choice shapes app support, updates, and ecosystem features.
    Windows vs Android
  • No full-page screenshots
    This tablet does not support full-page screenshots, the average tablet does. 53% of tablets support full-page screenshots.
  • No widgets
    This tablet does not support widgets, the average tablet does. 93.6% of tablets support widgets.
  • 93.9% heavier
    This tablet is heavier than the average tablet (950 g vs 490 g). The average tablet weighs 490 g.
    950 g vs 490 g
  • 3.7 mm thicker
    This tablet is thicker than the average tablet (11.7 mm vs 8 mm). The average tablet is 8 mm thick.
    11.7 mm vs 8 mm
  • 1 fewer speakers
    This tablet has less speakers than the average tablet (1 vs 2). The average tablet has 2 speakers.
    1 vs 2

Expert reviews

In-depth analysis and verdict from leading tech publications

9.0
pctipp.ch
≈ estimated
12/07/2023
Hands-on test · Rugged business tablet
Verdict
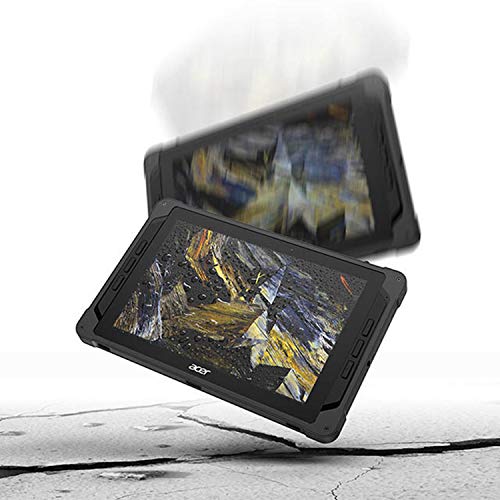
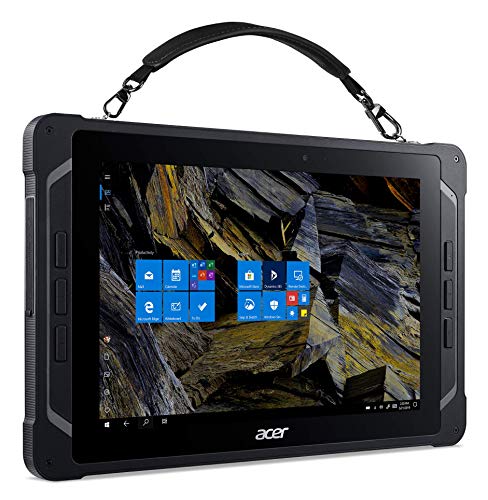
The Acer Enduro T1 is a rugged Windows 10 tablet that shrugs off drops and splashes and stays readable outdoors, suiting field staff rather than fast work.

Third-party reviews

What customers like about Acer Enduro T1 ET110-31W (4GB + 64GB)

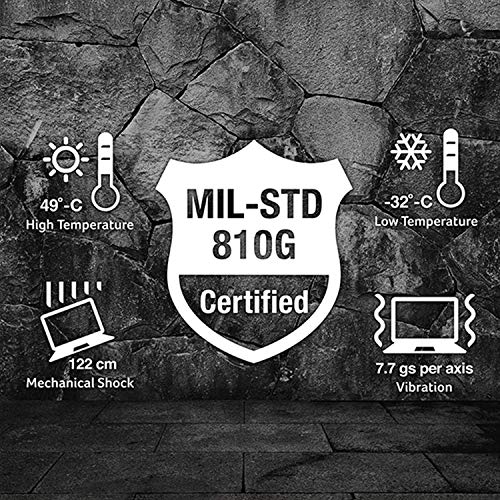
  • Rugged build with MIL-STD 810G and IP54 certifications for water and dust resistance.
  • Excellent battery life, with real-world testing confirming around 8–10 hours of usage.
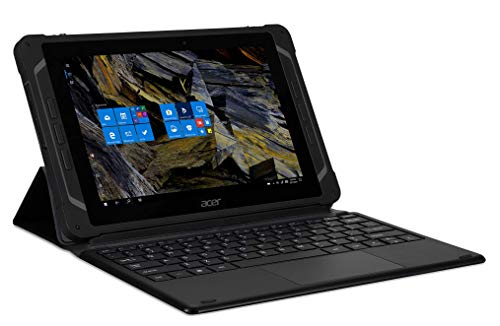
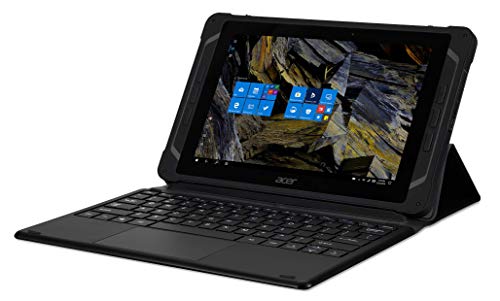
  • Innovative detachable portfolio keyboard and handle configurations that aid field portability.
  • Includes essential connectivity like USB ports and an HDMI output, rare for standard tablets.
  • Reliable standby battery performance with minimal drain while idle.
  • Supports usage with gloves, making it suitable for industrial environments.

What customers don't like about Acer Enduro T1 ET110-31W (4GB + 64GB)

  • Underpowered Intel Celeron processor can lead to slow performance in demanding applications.
  • Windows 10 Tablet Mode is described as 'clunky' and poorly optimized, sometimes causing the device to run slower.
  • Programmable buttons lack clear documentation or software for customization, rendering them standard buttons for many users.
  • The power button can be inconsistent and sometimes requires multiple presses to respond.
  • Display resolution (1280 x 800) is considered low for the price point compared to consumer tablets.
  • No integrated LTE or cellular connectivity options for true mobile field use.
  • Significant weight increase when the keyboard/cover is attached, reaching nearly 1.5 kg.

Verdict

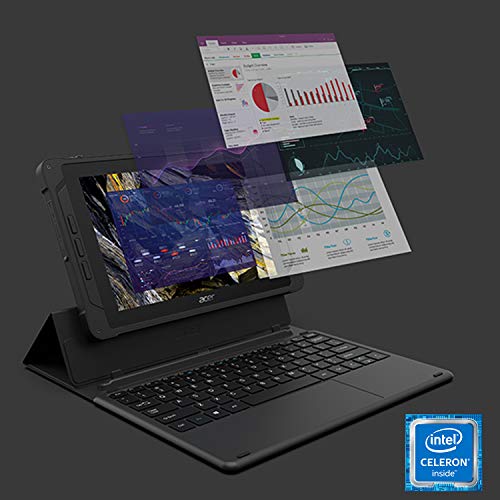
The Acer Enduro T1 ET110-31W (4GB + 64GB) is a rugged 10.1-inch Windows 10 Pro tablet powered by an Intel Celeron N3450 quad-core processor (up to 2.2GHz) and 4GB of LPDDR4 RAM. Designed for industrial and outdoor use, it features a WXGA (1280 x 800) IPS display protected by antimicrobial Corning Gorilla Glass, 64GB of eMMC storage, and a 4,870 mAh battery providing up to 10 hours of life. Key pros include its high durability with MIL-STD-810G and IP54 certifications, a panel-bonded touchscreen that supports glove use, and versatile connectivity including USB-C, USB 3.0, and micro-HDMI ports. However, common cons include a relatively weak processor that can struggle with demanding tasks, an inconsistent power button, and a heavy detachable keyboard that significantly increases the overall carry weight.

Compare Acer Enduro T1 ET110-31W (4GB + 64GB) with other tablets

1Product to compare no. 1
VS
2Product to compare no. 2
VS
3Product to compare no. 3 (optional)

Graphic comparison of Acer Enduro T1 ET110-31W (4GB + 64GB) and other tablets

No results found