Scored using Processors Methodology v3.0
Processors Methodology v3.0
Mathematical & Unbiased Scoring
Products in this category are scored under Frontum Processors Methodology v3.0: the technical score from the specifications is the base, and independent expert and video reviews (up to ±0.5 points), owner opinions (up to ±0.3) and best-of lists (up to +0.3) move it up or down.
Explore Processors Methodology v3.0

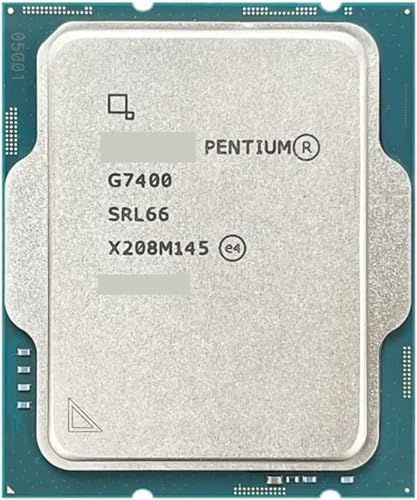
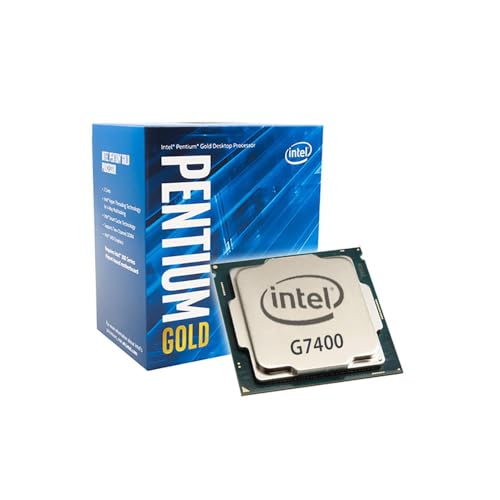
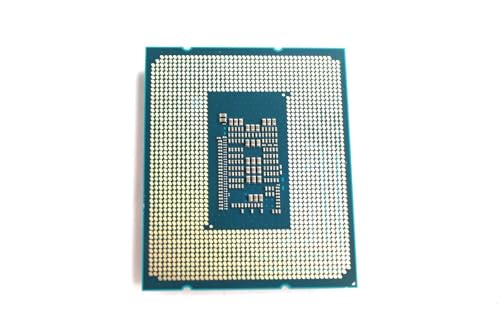
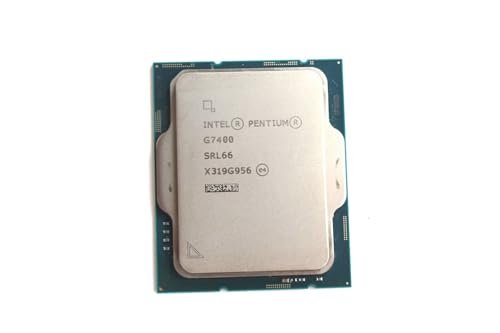
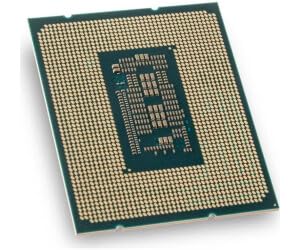
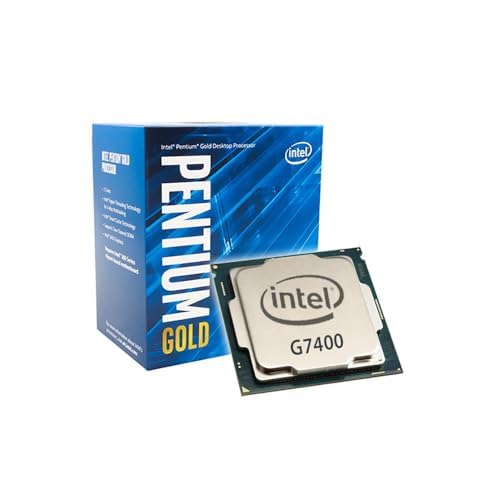
Intel Pentium Gold G7400 review: 74 specs compared

Avg. price:~£110PassMark multi-core score:6711N. of physical cores:2CPU boost clock speed:3.7 GHzCPU socket:LGA1700TDP (Thermal design power):46 W

Intel Pentium Gold G7400 Review: Compare 74 technical specifications and 7 expert and video reviews to see how this product ranks in the Processors category and whether it is worth buying.
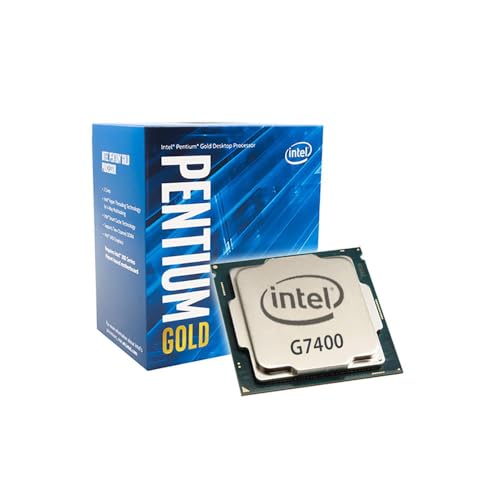
Intel Pentium Gold G7400
6.4/10

Overall score

Score
6.4/ 10
✕
What it is
Our main score for this model, 1–10. It combines specs, expert reviews, best-of lists and owners.
How we count it
Parts: Technical score 40%, Reviews score 25%, List score 25%, Sentiment score 10%
Marks: Each part gets a mark out of 10. For reviews, lists and owners, a typical model in this category gets about 8 and the best one gets 10.
No data yet: A part with no data shows "?". It counts as the mark of a weaker model in this category (4 in 5 models with data score higher). This way, models with reviews, lists and owners usually come out ahead.
Score distribution
â–¼
<55-66-77-88-99-10
Score components

40%

5.6

Technical score

25%

5.6

Reviews score

25%

?

List scoreNot enough data yet, so we use 7.5, the mark of a weaker model in this category

10%

8.8

Sentiment score

â–¼Worse than 59% of processors
7.5

Value for money

Value for money
7.5/ 10
✕
What it is
An indicator that combines the processor's overall rating with its cost.
When it matters
When you are looking for a processor with a good balance between performance, efficiency, and price.
Score distribution
â–¼
<55-66-77-88-99-10
Score components

70%

6.4

Overall score

30%

9.9

Price

â–²Better than 60%
5.6

Technical score

Technical score
5.6/ 10
✕
What it is
How good the specs are compared with the other models in this category, 1–10.
How we count it
Areas: We rate the specs in each area against the other models in this category.
Weighting: The areas that matter most to buyers count more. The shares are shown under Score components.
Share: The technical score is 40% of the overall score.
Score distribution
â–¼
<55-66-77-88-99-10
Score components

60%

4.6

Performance

18%

6.3

Architecture

10%

7.7

Memory & PCIe

7%

7.3

Power & Thermal

4%

9.0

Platform

1%

7.1

Integrated graphics

â–¼Worse than 52%
5.6

Reviews score

Reviews score
5.6/ 10
✕
What it is
Average grade from independent test sites, magazines and video reviewers, 1–10.
How we count it
Grades: Each review's own score is converted to 1–10; without one, we grade the review ourselves. Big test sites count more, short reviews half as much as full tests. A video review counts half.
Score: The average grade is 80% of the review mark; the number of reviews is the other 20% (1 review = 5, the typical number in this category = 8, the most-reviewed model = 10).
Enough data: With few reviews, the average grade is pulled toward the typical grade of this category. No reviews yet: 7.2 for now.
Share: Reviews count 25% of the overall score.
Score distribution
â–¼
<55-66-77-88-99-10

5.6

Mark 7.2 is below the typical mark 7.6 of this category, so it cannot lift the score above the technical score

80%

6.9

Average grade

20%

8.4

Popularity

Grades by review (7)
1 review, its grade estimated from the review text. 6 video reviews, each counting half as much as a written test. Reviews count 25% of the overall score.
User ratings collected online are not part of this score.
â–¼Worse than 71%
?

List score

List score
7.5/ 10
✕
What it is
How often independent test sites, magazines and video reviewers put this model in their best-of lists for this category.
How we count it
Points: The model in the most lists of this category gets 10; the others get 8 to 10 in proportion. In no list yet: 7.5. Lists count 25% of the overall score.
Enough data: Every list counts, even a single one. With fewer than 5 best-of lists in the category, this part is left out.
Lists with this model (0)
Not in any best-of list yet, so this part counts as 7.5. Models in a list get 8 to 10.
Not in any best-of list yet
  • intel-pentium-gold-g7400
  • intel-pentium-gold-g7400
  • intel-pentium-gold-g7400
  • intel-pentium-gold-g7400
  • intel-pentium-gold-g7400
  • intel-pentium-gold-g7400
  • intel-pentium-gold-g7400
  • intel-pentium-gold-g7400
  • intel-pentium-gold-g7400
  • intel-pentium-gold-g7400
  • intel-pentium-gold-g7400
intel-pentium-gold-g7400
Where to buy
*As an Amazon Associate, we earn from qualifying purchases.
Best rankings
Available: ranking among products currently available (including other versions of this product).All: ranking among all products in the database.

What reviewers say about the Intel Pentium Gold G7400

Based on 1 · 7

Reviewers find it fine for everyday tasks and solid in benchmarks, but frame stability, core count and value draw criticism.
Praised
Mixed views
Criticised
Pick a topic to see who said what
Loading...
Loading category ranking...

Technical Specifications of processor Intel Pentium Gold G7400

Technical score
Technical score
5.6/ 10
✕
What it is
How good the specs are compared with the other models in this category, 1–10.
How we count it
Areas: We rate the specs in each area against the other models in this category.
Weighting: The areas that matter most to buyers count more. The shares are shown under Score components.
Share: The technical score is 40% of the overall score.
Score distribution
â–¼
<55-66-77-88-99-10
Score components:

60%

4.6

Performance

18%

6.3

Architecture

10%

7.7

Memory & PCIe

7%

7.3

Power & Thermal

4%

9.0

Platform

1%

7.1

Integrated graphics

5.6
Reviews score
5.6
List score
?
Value for money
Value for money
7.5/ 10
✕
What it is
An indicator that combines the processor's overall rating with its cost.
When it matters
When you are looking for a processor with a good balance between performance, efficiency, and price.
Score distribution
â–¼
<55-66-77-88-99-10
Score components:

70%

6.4

Overall score

30%

9.9

Price

7.5
Processor type
desktop
This processor belongs to the desktop processor class, which is more advanced than that of 54.7% of processors and equal to that of 39.5% of processors.
CPU socket
LGA1700
This processor uses the LGA1700 CPU socket, which is newer than that of 84.5% of processors and equal to that of 8.4% of processors.
Chipset
Z790, H770, B760, Z690, H670, B660, H610, Q670, W680
This processor supports Z790, H770, B760, Z690, H670, B660, H610, Q670, W680 chipsets, which is broader compatibility than 86.4% of processors and equal to that of 2.3% of processors.
CPU architecture
x86-64
This processor uses the x86-64 architecture, which is more advanced than that of 1.8% of processors and equal to that of 98.2% of processors.
Instruction sets
MMX, SSE, SSE2, SSE3, SSSE3, SSE4.1, SSE4.2, AVX, AVX2, F16C, FMA3, AES, SHA, CLMUL, BMI1, BMI2, ADX, RDRAND
This processor supports MMX, SSE, SSE2, SSE3, SSSE3, SSE4.1, SSE4.2, AVX, AVX2, F16C, FMA3, AES, SHA, CLMUL, BMI1, BMI2, ADX, RDRAND instruction sets, which is broader support than 96.5% of processors and equal to that of 0.1% of processors.
Show more
N. of physical cores
2
This processor has 2 CPU cores, which is fewer than 80.4% of processors and equal to 19.6% of processors.
CPU threads
4
This processor offers 4 CPU threads, which is fewer than 69% of processors and equal to 25.2% of processors.
CPU boost clock speed
3.7 GHz
This processor reaches a boost clock of 3.7 GHz which is lower than that of 74.2% of processors and equal to that of 3.6% of processors.
CPU base clock speed
2x 3.7 GHz
This processor has a base clock of 2x3.7 GHz which is lower than that of 77.1% of processors and equal to that of 0.3% of processors.
PassMark multi-core score
6,711
This processor scores 6,711 in PassMark, which is lower than 64.7% of processors.
Show more
What reviewers say
Semiconductor size
10 nm
This processor uses a 10 nm process node, which is more advanced than that of 50.8% of processors and equal to that of 19.5% of processors.
Foundry
Intel 7
This processor is built on the Intel 7 foundry process, which is more advanced than that of 64.8% of processors and equal to that of 15.7% of processors.
L3 cache
6 MB
This processor has an L3 cache of 6 MB which is smaller than that of 62.3% of processors and equal to that of 9.4% of processors.
L2 cache
2.5 MB
This processor has an L2 cache of 2.5 MB which is smaller than that of 51.5% of processors and equal to that of 1.4% of processors.
L1 cache
160 KB
This processor has an L1 cache of 160 KB which is smaller than that of 82.3% of processors and equal to that of 1.5% of processors.
Show more
DDR memory version
DDR4/DDR5
This processor supports DDR DDR4/DDR5, which is newer than that of 77.1% of processors and equal to that of 10.7% of processors.
Maximum memory speed
4,800 MHz
This processor supports memory speeds up to 4,800 MHz, which is higher than that of 64.6% of processors and equal to 6% of processors.
Max memory speed (JEDEC)
DDR5-4800 MHz
This processor supports JEDEC memory speeds up to DDR5-4800 MHz, which is higher than that of 62.3% of processors and equal to 6.7% of processors.
Max memory speed (XMP / EXPO)
?
Maximum memory capacity
128 GB
This processor supports up to 128 GB of memory, which is more than 59.3% of processors and equal to 22.8% of processors.
Show more
Integrated graphics
yes
This processor includes integrated graphics. 14.7% of processors offer this.
Integrated GPU model
Intel UHD Graphics 710
This processor uses the Intel UHD Graphics 710 integrated GPU, which is more advanced than that in 53.7% of processors and equal to that in 0.7% of processors.
Integrated GPU execution units
16
This processor has 16 GPU execution units, which is fewer than 56.5% of processors and equal to 6.2% of processors.
Integrated GPU base frequency
300 MHz
This processor has an integrated GPU clock of 300 MHz which is lower than that of 57.8% of processors and equal to that of 38.4% of processors.
Integrated media encoders/decoders
AV1 (HW decode), VC-1 (HW decode)
This processor supports AV1 (HW decode), VC-1 (HW decode) media codecs, which is narrower support than 57.8% of processors.
Show more
TDP (Thermal design power)
46 W
This processor has a TDP of 46 W which is higher than that of 58.2% of processors and equal to that of 0.1% of processors.
Base power (PL1)
46 W
This processor has a base power of 46 W which is higher than that of 58.2% of processors and equal to that of 0.2% of processors.
Boost power (PL2)
?
Tau (power duration limit)
N/A
Configurable TDP
no
This processor does not support configurable TDP. 53.7% of processors offer this.
Show more

Intel Pentium Gold G7400 vs the average processor

246810TotalPlatformPerformanceArchitectureMemory & PCIeIntegrated graphicsPower & Thermal
  • 2.69x higher single-core score
    This processor has a higher Geekbench 6 single-core score than the average processor (4,134 vs 1,535). The average processor scores 1,535 in Geekbench 6 single-core.
    4,134 vs 1,535
  • Newer PCIe version
    This processor supports a newer PCIe version than the average processor (5 + 4 vs 3).
    5.0 + 4.0 vs 3.0
  • More advanced microarchitecture
    This processor uses a more advanced microarchitecture than the average processor (Alder Lake vs Kaby Lake).
    Alder Lake vs Kaby Lake
  • 2.5x more L2 per core
    This processor has more L2 cache per core than the average processor (1.3 MB/core vs 0.5 MB/core). The average processor provides 0.5 MB/core of L2 cache per core.
    1.25 MB/core vs 0.5 MB/core
  • 62.2% more L3 per core
    This processor has more L3 cache per core than the average processor (3 MB/core vs 1.85 MB/core). The average processor provides 1.85 MB/core of L3 cache per core.
    3 MB/core vs 1.85 MB/core
  • Includes a cooler
    This processor includes a cooler, while the average processor does not. 26.9% of processors include a cooler.
  • Newer DDR support
    This processor supports a newer DDR generation than the average processor (DDR4/DDR5 vs DDR4).
    DDR4/DDR5 vs DDR4
  • 4 more PCIe lanes
    This processor has more PCIe lanes than the average processor (20 vs 16). The average processor offers 16 PCIe lanes.
    20 vs 16
  • 22.2% higher sentiment score
    8.8 vs 7.2
  • Modern CPU socket
    This processor uses a more modern CPU socket than the average processor (LGA1700 vs FP5).
    LGA1700 vs FP5
  • Broader instruction support
    This processor supports a broader instruction set than the average processor (MMX, SSE, SSE2, SSE3, SSSE3, SSE4.1, SSE4.2, AVX, AVX2, F16C, FMA3, AES, SHA, CLMUL, BMI1, BMI2, ADX, RDRAND vs MMX, SSE, SSE2, SSE3, SSSE3, SSE4A, SSE4.1, SSE4.2, AVX, AVX2, F16C, FMA3, AES, SHA, AMD-V).
    MMX, SSE, SSE2, SSE3, SSSE3, SSE4.1, SSE4.2, AVX, AVX2, F16C, FMA3, AES, SHA, CLMUL, BMI1, BMI2, ADX, RDRAND vs MMX, SSE, SSE2, SSE3, SSSE3, SSE4A, SSE4.1, SSE4.2, AVX, AVX2, F16C, FMA3, AES, SHA, AMD-V
  • 2.69x higher single-core score
    This processor has a higher Geekbench 6 single-core score than the average processor (4,134 vs 1,535). The average processor scores 1,535 in Geekbench 6 single-core.
    4,134 vs 1,535
  • 16.6% better single-core performance
    This processor has a higher PassMark single-core score than the average processor (2,983 vs 2,558). The average processor scores 2,558 in PassMark single-core.
    2,983 vs 2,558
  • 61.9% faster classroom rendering
    This processor has a lower Blender Classroom render time than the average processor (550.7 vs 340.1). The average processor needs 340.075 for the Blender Classroom test.
    550.7 vs 340.075
  • 2 wider front-end design
    This processor has a higher front-end width than the average processor (6 vs 4). The average processor uses front-end width of 4.
    6 vs 4
  • 2x higher bus transfer rate
    This processor has a higher bus transfer rate than the average processor (16 GT/s vs 8 GT/s). The average processor offers bus transfer rate of 8 GT/s.
    16 GT/s vs 8 GT/s
  • More advanced microarchitecture
    This processor uses a more advanced microarchitecture than the average processor (Alder Lake vs Kaby Lake).
    Alder Lake vs Kaby Lake
  • 2.5x more L2 per core
    This processor has more L2 cache per core than the average processor (1.3 MB/core vs 0.5 MB/core). The average processor provides 0.5 MB/core of L2 cache per core.
    1.25 MB/core vs 0.5 MB/core
  • 62.2% more L3 per core
    This processor has more L3 cache per core than the average processor (3 MB/core vs 1.85 MB/core). The average processor provides 1.85 MB/core of L3 cache per core.
    3 MB/core vs 1.85 MB/core
  • More advanced foundry
    This processor uses a more advanced foundry process than the average processor (Intel 7 vs Intel 14 nm).
    Intel 7 vs Intel 14 nm
  • Newer PCIe version
    This processor supports a newer PCIe version than the average processor (5 + 4 vs 3).
    5.0 + 4.0 vs 3.0
  • Newer DDR support
    This processor supports a newer DDR generation than the average processor (DDR4/DDR5 vs DDR4).
    DDR4/DDR5 vs DDR4
  • 4 more PCIe lanes
    This processor has more PCIe lanes than the average processor (20 vs 16). The average processor offers 16 PCIe lanes.
    20 vs 16
  • 2x more memory capacity
    This processor has more maximum memory capacity than the average processor (128 GB vs 64 GB). The average processor supports 64 GB of memory.
    128 GB vs 64 GB
  • 63.8% higher memory bandwidth
    This processor has a higher memory bandwidth than the average processor (76.8 GB/s vs 46.9 GB/s). The average processor offers memory bandwidth of 46.9 GB/s.
    76.8 GB/s vs 46.9 GB/s
  • 50% higher memory speed
    This processor has a higher maximum memory speed than the average processor (4,800 MHz vs 3,200 MHz). The average processor supports memory speed of 3,200 MHz.
    4,800 MHz vs 3,200 MHz
  • 1 more supported displays
    This processor has more supported displays than the average processor (4 vs 3). The average processor supports 3 displays.
    4 vs 3
  • Includes a cooler
    This processor includes a cooler, while the average processor does not. 26.9% of processors include a cooler.
  • 4 fewer CPU cores
    This processor has fewer CPU cores than the average processor (2 vs 6). The average processor has 6 CPU cores.
    2 vs 6
  • 15.9% lower boost clock
    This processor has a lower boost clock speed than the average processor (3.7 GHz vs 4.4 GHz). The average processor reaches boost clock speed of 4.4 GHz.
    3.7 GHz vs 4.4 GHz
  • 41.5% lower PassMark score
    This processor has a lower PassMark benchmark score than the average processor (6,711 vs 11,469). The average processor scores 11,469 in PassMark benchmark.
    6,711 vs 11,469
  • No configurable TDP
    This processor does not support configurable TDP, while the average processor does. 53.7% of processors support configurable TDP.
  • 2 fewer performance cores
    This processor has fewer performance cores than the average processor (2 vs 4). The average processor has 4 performance cores.
    2 vs 4
  • 4 fewer CPU threads
    This processor has fewer CPU threads than the average processor (4 vs 8). The average processor has 8 CPU threads.
    4 vs 8
  • 16.4% lower review score
    Reviews score
    5.6/ 10
    ✕
    What it is
    Average grade from independent test sites, magazines and video reviewers, 1–10.
    How we count it
    Grades: Each review's own score is converted to 1–10; without one, we grade the review ourselves. Big test sites count more, short reviews half as much as full tests. A video review counts half.
    Score: The average grade is 80% of the review mark; the number of reviews is the other 20% (1 review = 5, the typical number in this category = 8, the most-reviewed model = 10).
    Enough data: With few reviews, the average grade is pulled toward the typical grade of this category. No reviews yet: 7.2 for now.
    Share: Reviews count 25% of the overall score.
    Score distribution
    â–¼
    <55-66-77-88-99-10

    5.6

    Mark 7.2 is below the typical mark 7.6 of this category, so it cannot lift the score above the technical score

    80%

    6.9

    Average grade

    20%

    8.4

    Popularity

    Grades by review (7)
    1 review, its grade estimated from the review text. 6 video reviews, each counting half as much as a written test. Reviews count 25% of the overall score.
    User ratings collected online are not part of this score.
    5.6 vs 6.7
  • Lower base clock
    This processor has a lower base clock than the average processor (2x3.7 GHz vs 4x3.4 GHz).
    2x3.7 GHz vs 4x3.4 GHz
  • 16.4% lower review score
    Reviews score
    5.6/ 10
    ✕
    What it is
    Average grade from independent test sites, magazines and video reviewers, 1–10.
    How we count it
    Grades: Each review's own score is converted to 1–10; without one, we grade the review ourselves. Big test sites count more, short reviews half as much as full tests. A video review counts half.
    Score: The average grade is 80% of the review mark; the number of reviews is the other 20% (1 review = 5, the typical number in this category = 8, the most-reviewed model = 10).
    Enough data: With few reviews, the average grade is pulled toward the typical grade of this category. No reviews yet: 7.2 for now.
    Share: Reviews count 25% of the overall score.
    Score distribution
    â–¼
    <55-66-77-88-99-10

    5.6

    Mark 7.2 is below the typical mark 7.6 of this category, so it cannot lift the score above the technical score

    80%

    6.9

    Average grade

    20%

    8.4

    Popularity

    Grades by review (7)
    1 review, its grade estimated from the review text. 6 video reviews, each counting half as much as a written test. Reviews count 25% of the overall score.
    User ratings collected online are not part of this score.
    5.6 vs 6.7
  • Weaker security extensions
    This processor provides less advanced security extensions than the average processor (AES-NI, NX bit, Secure Key, OS Guard, Boot Guard, CET, MBEC vs AES-NI, NX bit, Secure Key, TXT, OS Guard, Boot Guard, CET, MBEC, TME, TME-MK).
    AES-NI, NX bit, Secure Key, OS Guard, Boot Guard, CET, MBEC vs AES-NI, NX bit, Secure Key, TXT, OS Guard, Boot Guard, CET, MBEC, TME, TME-MK
  • 4 fewer CPU cores
    This processor has fewer CPU cores than the average processor (2 vs 6). The average processor has 6 CPU cores.
    2 vs 6
  • 15.9% lower boost clock
    This processor has a lower boost clock speed than the average processor (3.7 GHz vs 4.4 GHz). The average processor reaches boost clock speed of 4.4 GHz.
    3.7 GHz vs 4.4 GHz
  • 41.5% lower PassMark score
    This processor has a lower PassMark benchmark score than the average processor (6,711 vs 11,469). The average processor scores 11,469 in PassMark benchmark.
    6,711 vs 11,469
  • 2 fewer performance cores
    This processor has fewer performance cores than the average processor (2 vs 4). The average processor has 4 performance cores.
    2 vs 4
  • 4 fewer CPU threads
    This processor has fewer CPU threads than the average processor (4 vs 8). The average processor has 8 CPU threads.
    4 vs 8
  • Lower base clock
    This processor has a lower base clock than the average processor (2x3.7 GHz vs 4x3.4 GHz).
    2x3.7 GHz vs 4x3.4 GHz
  • 21.1% lower multi-core score
    This processor has a lower Geekbench 6 multi-core score than the average processor (4,111 vs 5,209). The average processor scores 5,209 in Geekbench 6 multi-core.
    4,111 vs 5,209
  • No speed boosting
    This processor does not support automatic speed boosting, while the average processor does. 87.7% of processors offer this.
  • 58.3% smaller L1 cache
    This processor has a lower L1 cache than the average processor (160 KB vs 384 KB). The average processor has L1 cache of 384 KB.
    160 KB vs 384 KB
  • 33.3% smaller L3 cache
    This processor has a lower L3 cache than the average processor (6 MB vs 9 MB). The average processor has L3 cache of 9 MB.
    6 MB vs 9 MB
  • Limited PCIe bifurcation
    This processor supports less flexible PCIe bifurcation than the average processor (x8/x4/x4 vs x16, x8/x8, x4/x4/x4/x4).
    x8/x4/x4 vs x16, x8/x8, x4/x4/x4/x4
  • Narrower media codec support
    This processor supports fewer media codecs than the average processor (AV1 (HW decode), VC-1 (HW decode) vs H.264 (HW decode/encode), H.265 (HW decode/encode), VP9 (HW decode/encode), AV1 (HW decode), JPEG (HW decode/encode)).
    AV1 (HW decode), VC-1 (HW decode) vs H.264 (HW decode/encode), H.265 (HW decode/encode), VP9 (HW decode/encode), AV1 (HW decode), JPEG (HW decode/encode)
  • No configurable TDP
    This processor does not support configurable TDP, while the average processor does. 53.7% of processors support configurable TDP.

Video reviews

Hands-on testing, unboxing, and real-world video evaluations

7.0
DigitalJon
≈ estimated
25/09/2024
Gaming benchmark · 15 games and synthetic tests
Verdict
Intel Pentium Gold G7400 handles esports and light gaming well, but demanding titles expose its limits.
8.0
DigitalJon
≈ estimated
18/11/2022
Hands-on review · Warzone 2.0 at 1080p and 1440p
Verdict
Intel Pentium Gold G7400 gives a good experience for non-competitive players, but it needs a strong graphics card.
8.0
DigitalJon
≈ estimated
08/06/2022
Full build test · gaming, everyday use and export tests
Verdict
Intel Pentium Gold G7400 is surprisingly capable in light and older games, with some stutter and slow exports.
7.0
RandomGaminginHD
≈ estimated
10/05/2022
Hands-on test · game performance with mixed GPU pairing
Verdict
Intel Pentium Gold G7400 is a decent everyday chip, but it is too weak for current AAA games and stutters in several titles.
7.0
Gamers Nexus
≈ estimated
03/04/2022
Benchmark review · gaming tests and comparison against rival CPUs
Verdict
Intel Pentium Gold G7400 is unimpressive, but it is a usable starter gaming CPU if you cannot spend more.
7.0
Luumi
≈ estimated
27/03/2022
Overclocking test · AVX-512 and memory tests
Verdict
Intel Pentium Gold G7400 is only worth it for a cheap AVX-512 build with a cheap board, since its AVX offset works only partially.
4.0
PC H/W and Tech Unboxings 🔥
≈ estimated
27/03/2022
Gaming test · pairing with older and newer GPUs
Verdict
Intel Pentium Gold G7400 is a poor choice for gaming, as it bottlenecks even mid-range graphics cards.
5.0
RandomGaminginHD
≈ estimated
12/03/2022
Hands-on review · game tests and everyday use
Verdict
Intel Pentium Gold G7400 is impressive for a dual-core, but hard to recommend for gaming when a Core i3 is worth the extra.
9.0
DigitalJon
≈ estimated
12/10/2022
Hands-on review · Overwatch 2 at 1080p and 1440p
Verdict
Intel Pentium Gold G7400 has plenty of power for Overwatch 2, so it should run fine.
5.0
Big Technologist
≈ estimated
19/03/2022
Build video · price and platform comparison
Verdict
Intel Pentium Gold G7400 is the weaker choice; an older i3 with DDR4 is better unless DDR5 prices drop.
Not graded
Overview video

Expert reviews

In-depth analysis and verdict from leading tech publications

7.0
ct.nl
≈ estimated
21/09/2022
Lab test · Office processor
Verdict
The Intel Pentium Gold G7400 handles everyday office work easily, but it idles at 20 watts and its graphics only run older games at low settings.

Third-party reviews

What customers like about Intel Pentium Gold G7400

  • Excellent value for budget office and home theater PC builds
  • High single-thread performance thanks to Alder Lake architecture
  • Extremely power-efficient with low thermal output
  • Included stock cooler is quiet and effective for its heat load
  • Supports modern technologies like DDR5 and PCIe 5.0
  • Reliable integrated graphics (UHD 710) for basic tasks and BIOS updates
  • Strong upgrade path on the LGA 1700 socket

What customers don't like about Intel Pentium Gold G7400

  • Dual-core design leads to significant stuttering in modern AAA games
  • Frequent 1% and 0.1% low FPS issues in CPU-intensive titles
  • Limited multitasking capability for heavy production or CAD work
  • Poor value comparison to the Core i3-12100F, which offers much better performance for a small price increase
  • Can bottleneck modern mid-range and high-end graphics cards
  • No turbo boost feature, limiting peak clock speeds under heavy load

Verdict

The Intel Pentium Gold G7400 is an entry-level desktop processor from the 12th Gen 'Alder Lake' family, featuring 2 Performance-cores, 4 threads, and a fixed base frequency of 3.7 GHz. Built on the Intel 7 lithography for the LGA 1700 socket, it includes 6 MB of Intel Smart Cache, a low 46W base power, and integrated Intel UHD Graphics 710. Its main advantages are high single-core performance for its class, support for both DDR4 (up to 3200 MT/s) and DDR5 (up to 4800 MT/s) memory, and compatibility with PCIe 5.0, making it an excellent, power-efficient choice for basic office tasks and light media consumption. However, its primary drawbacks include the lack of a Turbo Boost feature and limited multi-threaded performance, which can lead to inconsistent frame times and stuttering in modern, CPU-intensive AAA games.

Compare Intel Pentium Gold G7400 with other processors

1Product to compare no. 1
VS
2Product to compare no. 2
VS
3Product to compare no. 3 (optional)

Graphic comparison of Intel Pentium Gold G7400 and other processors

No results found