Scored using Motherboards Methodology v3.0
Motherboards Methodology v3.0
Mathematical & Unbiased Scoring
Products in this category are scored under Frontum Motherboards Methodology v3.0: the technical score from the specifications is the base, and independent expert and video reviews (up to ±0.5 points), owner opinions (up to ±0.3) and best-of lists (up to +0.3) move it up or down.
Explore Motherboards Methodology v3.0

BIOSTAR TB360-BTC Pro review: 109 specs compared

Avg. price:~£120CPU socket:?Chipset:Intel B360Form factor:ATX

BIOSTAR TB360-BTC Pro Review: Compare 109 technical specifications and 2 expert and video reviews to see how this product ranks in the Motherboards category and whether it is worth buying.
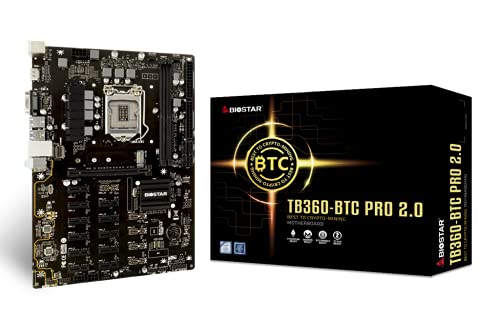
BIOSTAR TB360-BTC Pro
6.2/10

Overall score

Score
6.2/ 10
✕
What it is
Our main score for this model, 1–10. It combines specs, expert reviews, best-of lists, owners and ratings from across the web.
How we count it
Parts: Technical score 40%, Reviews score 20%, List score 20%, Sentiment score 10%, User score 10%
Marks: Each part gets a mark out of 10. For reviews, lists and owners, a typical model in this category gets about 8 and the best one gets 10.
No data yet: A part with no data shows "?". It counts as the mark of a weaker model in this category (4 in 5 models with data score higher). This way, models with reviews, lists and owners usually come out ahead.
Score distribution
â–¼
<55-66-77-88-99-10
Score components

40%

5.0

Technical score

20%

5.0

Reviews score

20%

?

List scoreNot enough data yet, so we use 7.5, the mark of a weaker model in this category

10%

8.3

Sentiment score

10%

8.5

User score

â–¼Worse than 80% of motherboards
7.3

Value for money

Value for money
7.3/ 10
✕
What it is
An indicator that combines the motherboard's overall rating with its cost.
When it matters
When you are looking for a motherboard that offers a strong balance of features, performance, and price.
Score distribution
â–¼
<55-66-77-88-99-10
Score components

70%

6.2

Overall score

30%

9.9

Price

â–¼Worse than 79%
5.0

Technical score

Technical score
5.0/ 10
✕
What it is
How good the specs are compared with the other models in this category, 1–10.
How we count it
Areas: We rate the specs in each area against the other models in this category.
Weighting: The areas that matter most to buyers count more. The shares are shown under Score components.
Share: The technical score is 40% of the overall score.
Score distribution
â–¼
<55-66-77-88-99-10
Score components

19%

3.6

Memory

16%

6.6

Platform

16%

6.2

Storage

15%

3.4

Network

13%

4.1

Ports

8%

3.1

Expansion

8%

7.0

Power & Cooling

5%

7.7

Audio

â–¼Worse than 75%
5.0

Reviews score

Reviews score
5.0/ 10
✕
What it is
Average grade from independent test sites, magazines and video reviewers, 1–10.
How we count it
Grades: Each review's own score is converted to 1–10; without one, we grade the review ourselves. Big test sites count more, short reviews half as much as full tests. A video review counts half.
Score: The average grade is 80% of the review mark; the number of reviews is the other 20% (1 review = 5, the typical number in this category = 8, the most-reviewed model = 10).
Enough data: With few reviews, the average grade is pulled toward the typical grade of this category. No reviews yet: 7.8 for now.
Share: Reviews count 20% of the overall score.
Score distribution
â–¼
<55-66-77-88-99-10

5.0

Mark 8.1 is below the typical mark 8.3 of this category, so it cannot lift the score above the technical score

80%

8.4

Average grade

20%

6.9

Popularity

Grades by review (2)
2 video reviews, each counting half as much as a written test. Reviews count 20% of the overall score.
Ratings from across the web count in the User score, not in this score.
â–¼Worse than 87%
8.5

User score

User score
8.5/ 10
✕
What it is
How happy buyers are with this model, based on ratings from across the web.
How we count it
Enough data: A model needs at least 1 rating from across the web. Without one, it counts as 7.9, the mark of a weaker rated model in this category.
Share: User score counts 10% of the overall score.
Score distribution
â–¼
<55-66-77-88-99-10

70%

7.9

Rating

30%

9.8

Popularity

â–²Better than 55%
?

List score

List score
7.5/ 10
✕
What it is
How often independent test sites, magazines and video reviewers put this model in their best-of lists for this category.
How we count it
Points: The model in the most lists of this category gets 10; the others get 8 to 10 in proportion. In no list yet: 7.5. Lists count 20% of the overall score.
Enough data: Every list counts, even a single one. With fewer than 5 best-of lists in the category, this part is left out.
Lists with this model (0)
Not in any best-of list yet, so this part counts as 7.5. Models in a list get 8 to 10.
Not in any best-of list yet
  • biostar-tb360-btc-pro
  • biostar-tb360-btc-pro
  • biostar-tb360-btc-pro
  • biostar-tb360-btc-pro
biostar-tb360-btc-pro
Where to buy
*As an Amazon Associate, we earn from qualifying purchases.
Best rankings
Available: ranking among products currently available (including other versions of this product).All: ranking among all products in the database.
Loading...
Loading category ranking...

Technical Specifications of motherboard BIOSTAR TB360-BTC Pro

Technical score
Technical score
5.0/ 10
✕
What it is
How good the specs are compared with the other models in this category, 1–10.
How we count it
Areas: We rate the specs in each area against the other models in this category.
Weighting: The areas that matter most to buyers count more. The shares are shown under Score components.
Share: The technical score is 40% of the overall score.
Score distribution
â–¼
<55-66-77-88-99-10
Score components:

19%

3.6

Memory

16%

6.6

Platform

16%

6.2

Storage

15%

3.4

Network

13%

4.1

Ports

8%

3.1

Expansion

8%

7.0

Power & Cooling

5%

7.7

Audio

5.0
Reviews score
5.0
User score
8.5
List score
?
Value for money
Value for money
7.3/ 10
✕
What it is
An indicator that combines the motherboard's overall rating with its cost.
When it matters
When you are looking for a motherboard that offers a strong balance of features, performance, and price.
Score distribution
â–¼
<55-66-77-88-99-10
Score components:

70%

6.2

Overall score

30%

9.9

Price

7.3
CPU socket
?
CPU platform
Intel
Chipset
Intel B360
This motherboard uses Intel B360, which is less capable than 87.7% of Motherboards and as capable as 1.3% of Motherboards.
Form factor
ATX
Integrated graphics support
yes
This motherboard supports integrated graphics. 10.2% of motherboards support this feature.
Show more
DDR memory version
DDR4
This motherboard uses DDR4, which is more modern than 13.4% of Motherboards and the same as 50.4% of Motherboards.
Memory slots
2
This motherboard has 2 Memory slots, which is fewer than 78.1% of motherboards and equal to 21.8% of motherboards.
Maximum memory capacity
32 GB
This motherboard supports up to 32 GB of memory, which is less than 87% of motherboards and equal to 11.1% of motherboards.
Memory channels
?
Maximum RAM speed
2,666 MT/s
This motherboard supports memory speeds up to 2,666 MT/s, which is lower than that of 79.2% of motherboards and equal to that of 4.6% of motherboards.
Show more
N. of M.2 sockets
?
M.2 slot interface per slot
?
N. of SATA 3 connectors
4
This motherboard has 4 SATA 3 connectors, which is more than 6.1% of motherboards and equal to 46.8% of motherboards.
Supported RAID levels
?
NVMe RAID support
no
This motherboard does not support NVMe RAID. 59.9% of motherboards support this feature.
Show more
N. of PCIe 5.0 x16 slots
0
This motherboard has 0 PCIe 5.0x16 slots, which is fewer than 31.6% of motherboards and equal to 68.4% of motherboards.
N. of PCIe 4.0 x16 slots
0
This motherboard has 0 PCIe 4.0x16 slots, which is fewer than 44.8% of motherboards and equal to 55.2% of motherboards.
N. of PCIe 3.0 x16 slots
?
PCIe slot electrical configuration
?
PCIe bifurcation support
no
This motherboard does not support PCIe bifurcation. 59.8% of motherboards support this feature.
Show more
Total USB ports (rear I/O)
?
Total USB ports (including headers)
?
Total USB-C ports (rear I/O)
0
This motherboard has 0 USB-C ports (rear I/O), which is fewer than 64.2% of motherboards and equal to 35.8% of motherboards.
Total USB-C ports (including headers)
?
N. of USB 3.2 Gen2x2 ports (USB-C)
0
This motherboard has 0 USB 3.2 Gen2x2 ports (USB-C), which is fewer than 18% of motherboards and equal to 82% of motherboards.
Show more
LAN speed
1 Gbps
This motherboard supports LAN speeds up to 1 Gbps, which is lower than that of 51.1% of motherboards and equal to that of 48.9% of motherboards.
LAN controller
?
N. of RJ45 ports
1
This motherboard has 1 RJ45 ports, which is fewer than 14.4% of motherboards and equal to 85.6% of motherboards.
Wi-Fi connectivity
no
This motherboard does not support Wi-Fi connectivity. 50.1% of motherboards support this feature.
Wi-Fi version
N/A
Show more
Audio codec
Realtek ALC887
This motherboard uses Realtek ALC887, which is lower-end than 89.1% of Motherboards and the same as 7.8% of Motherboards.
Audio channels
7.1
This motherboard offers 7.1 audio channels, which is more than 4.7% of motherboards and equal to 95.3% of motherboards.
Audio SNR
?
Headphone amp support
yes
This motherboard supports a headphone amp. 41.2% of motherboards support this feature.
N. of 3.5mm audio jacks
3
This motherboard has 3 3.5mm audio jacks, which is more than 11.3% of motherboards and equal to 39.3% of motherboards.
Show more
VRM phases
?
N. of CPU power connectors
1
This motherboard has 1 CPU power connectors, which is fewer than 45.2% of motherboards and equal to 54.9% of motherboards.
N. of fan headers
?
Pump header
no
This motherboard does not have a pump header. 77.9% of motherboards include this feature.
Pump header max current
?
Show more

BIOSTAR TB360-BTC Pro vs the average motherboard

246810TotalPlatformMemoryStorageExpansionPortsNetworkAudioPower & Cooling
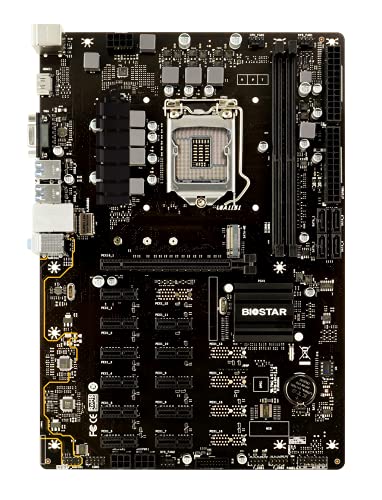
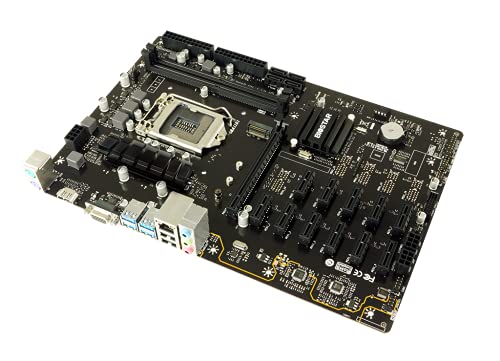
  • 10 more PCIe x1 slots
    This motherboard has more PCIe x1 slots than the average motherboard (11 vs 1). The average motherboard has 1 PCIe x1 slot/s.
    11 vs 1
  • 14.9% higher user score
    User score
    8.5/ 10
    ✕
    What it is
    How happy buyers are with this model, based on ratings from across the web.
    How we count it
    Enough data: A model needs at least 1 rating from across the web. Without one, it counts as 7.9, the mark of a weaker rated model in this category.
    Share: User score counts 10% of the overall score.
    Score distribution
    â–¼
    <55-66-77-88-99-10

    70%

    7.9

    Rating

    30%

    9.8

    Popularity

    8.5 vs 7.4
  • 14.9% higher user score
    User score
    8.5/ 10
    ✕
    What it is
    How happy buyers are with this model, based on ratings from across the web.
    How we count it
    Enough data: A model needs at least 1 rating from across the web. Without one, it counts as 7.9, the mark of a weaker rated model in this category.
    Share: User score counts 10% of the overall score.
    Score distribution
    â–¼
    <55-66-77-88-99-10

    70%

    7.9

    Rating

    30%

    9.8

    Popularity

    8.5 vs 7.4
  • 10 more PCIe x1 slots
    This motherboard has more PCIe x1 slots than the average motherboard (11 vs 1). The average motherboard has 1 PCIe x1 slot/s.
    11 vs 1
  • More basic chipset
    This motherboard uses a more basic chipset than the average motherboard (Intel B360 vs Intel B860).
    Intel B360 vs Intel B860
  • 60% lower LAN speed
    This motherboard has a lower LAN speed than the average motherboard (1 Gbps vs 2.5 Gbps). The average motherboard offers LAN speed of 2.5 Gbps.
    1 Gbps vs 2.5 Gbps
  • 75% less maximum memory capacity
    This motherboard has fewer maximum memory capacity than the average motherboard (32 GB vs 128 GB). The average motherboard supports 128 GB of memory.
    32 GB vs 128 GB
  • 2 fewer memory slots
    This motherboard has fewer memory slots than the average motherboard (2 vs 4). The average motherboard has 4 memory slot/s.
    2 vs 4
  • No NVMe RAID support
    This motherboard does not support NVMe RAID, while the average motherboard does. 59.9% of motherboards support NVMe RAID.
  • 31.5% lower review score
    Reviews score
    5.0/ 10
    ✕
    What it is
    Average grade from independent test sites, magazines and video reviewers, 1–10.
    How we count it
    Grades: Each review's own score is converted to 1–10; without one, we grade the review ourselves. Big test sites count more, short reviews half as much as full tests. A video review counts half.
    Score: The average grade is 80% of the review mark; the number of reviews is the other 20% (1 review = 5, the typical number in this category = 8, the most-reviewed model = 10).
    Enough data: With few reviews, the average grade is pulled toward the typical grade of this category. No reviews yet: 7.8 for now.
    Share: Reviews count 20% of the overall score.
    Score distribution
    â–¼
    <55-66-77-88-99-10

    5.0

    Mark 8.1 is below the typical mark 8.3 of this category, so it cannot lift the score above the technical score

    80%

    8.4

    Average grade

    20%

    6.9

    Popularity

    Grades by review (2)
    2 video reviews, each counting half as much as a written test. Reviews count 20% of the overall score.
    Ratings from across the web count in the User score, not in this score.
    5.0 vs 7.3
  • No Wi-Fi connectivity
    This motherboard does not support Wi-Fi connectivity, while the average motherboard does. 50.1% of motherboards support Wi-Fi connectivity.
  • No BIOS flashback support
    This motherboard does not support BIOS flashback, while the average motherboard does. 51.3% of motherboards support BIOS flashback.
  • 31.5% lower review score
    Reviews score
    5.0/ 10
    ✕
    What it is
    Average grade from independent test sites, magazines and video reviewers, 1–10.
    How we count it
    Grades: Each review's own score is converted to 1–10; without one, we grade the review ourselves. Big test sites count more, short reviews half as much as full tests. A video review counts half.
    Score: The average grade is 80% of the review mark; the number of reviews is the other 20% (1 review = 5, the typical number in this category = 8, the most-reviewed model = 10).
    Enough data: With few reviews, the average grade is pulled toward the typical grade of this category. No reviews yet: 7.8 for now.
    Share: Reviews count 20% of the overall score.
    Score distribution
    â–¼
    <55-66-77-88-99-10

    5.0

    Mark 8.1 is below the typical mark 8.3 of this category, so it cannot lift the score above the technical score

    80%

    8.4

    Average grade

    20%

    6.9

    Popularity

    Grades by review (2)
    2 video reviews, each counting half as much as a written test. Reviews count 20% of the overall score.
    Ratings from across the web count in the User score, not in this score.
    5.0 vs 7.3
  • 5.7% worse value for money
    BIOSTAR TB360-BTC Pro has worse value for money than the average motherboard (7.28 vs 7.7).
    7.28 vs 7.7
  • More basic chipset
    This motherboard uses a more basic chipset than the average motherboard (Intel B360 vs Intel B860).
    Intel B360 vs Intel B860
  • No BIOS flashback support
    This motherboard does not support BIOS flashback, while the average motherboard does. 51.3% of motherboards support BIOS flashback.
  • No debug LED indicators
    This motherboard does not have debug LED indicators, while the average motherboard does. 78.7% of motherboards include debug LED indicators.
  • No automatic overclocking
    This motherboard does not support automatic overclocking, while the average motherboard does. 74.1% of motherboards support automatic overclocking.
  • 75% less maximum memory capacity
    This motherboard has fewer maximum memory capacity than the average motherboard (32 GB vs 128 GB). The average motherboard supports 128 GB of memory.
    32 GB vs 128 GB
  • 2 fewer memory slots
    This motherboard has fewer memory slots than the average motherboard (2 vs 4). The average motherboard has 4 memory slot/s.
    2 vs 4
  • 43.3% lower maximum RAM speed
    This motherboard has a lower maximum RAM speed than the average motherboard (2,666 MT/s vs 4,699.5 MT/s). The average motherboard supports RAM speed of 4,699.5 MT/s.
    2,666 MT/s vs 4,699.5 MT/s
  • No NVMe RAID support
    This motherboard does not support NVMe RAID, while the average motherboard does. 59.9% of motherboards support NVMe RAID.
  • No PCIe bifurcation support
    This motherboard does not support PCIe bifurcation, while the average motherboard does. 59.7% of motherboards support PCIe bifurcation.
  • No multi-GPU support
    This motherboard does not support multi-GPU, while the average motherboard does. 53.9% of motherboards support multi-GPU.
  • 1 fewer rear USB-C ports
    This motherboard has fewer rear USB-C ports than the average motherboard (0 vs 1). The average motherboard has 1 rear USB-C port/s.
    0 vs 1
  • 1 fewer USB 3.2 Gen2 ports
    This motherboard has fewer USB 3.2 Gen2 ports than the average motherboard (0 vs 1). The average motherboard has 1 USB 3.2 Gen2 port/s.
    0 vs 1
  • 1 fewer DisplayPort outputs
    This motherboard has fewer DisplayPort outputs than the average motherboard (0 vs 1). The average motherboard has 1 DisplayPort outputs.
    0 vs 1
  • 60% lower LAN speed
    This motherboard has a lower LAN speed than the average motherboard (1 Gbps vs 2.5 Gbps). The average motherboard offers LAN speed of 2.5 Gbps.
    1 Gbps vs 2.5 Gbps
  • No Wi-Fi connectivity
    This motherboard does not support Wi-Fi connectivity, while the average motherboard does. 50.1% of motherboards support Wi-Fi connectivity.
  • No Wi-Fi antenna included
    This motherboard does not include a Wi-Fi antenna, while the average motherboard does. 51.1% of motherboards include a Wi-Fi antenna.
  • Less capable onboard audio
    This motherboard has a lower-end audio codec than the average motherboard (Realtek ALC887 vs Realtek ALC897).
    Realtek ALC887 vs Realtek ALC897
  • No optical S/PDIF out
    This motherboard does not have optical S/PDIF out, while the average motherboard does. 55.4% of motherboards include optical S/PDIF out.
  • No pump header
    This motherboard does not have a pump header, while the average motherboard does. 77.9% of motherboards include a pump header.

Video reviews

Hands-on testing, unboxing, and real-world video evaluations

8.0
Tiempo Tech
≈ estimated
06/08/2021
Long-term use review · several months of mining
Verdict
The BIOSTAR TB360-BTC Pro is recommended with caveats: mixing AMD and NVIDIA GPUs can cause problems, and the M.2 slot likely won't work.
9.0
TecnoRed
≈ estimated
06/06/2021
Unboxing and review · setup and 10-GPU mining test
Verdict
The BIOSTAR TB360-BTC Pro is an excellent mining board overall, though some GPUs may need PCIe set to older versions.
Hands-on video, no verdict

Third-party reviews

What customers like about BIOSTAR TB360-BTC Pro

  • Eleven PCIe x1 slots take many add-in cards.
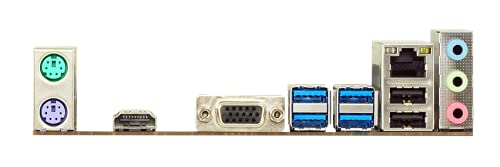
  • Two PS/2 ports suit older keyboards and mice.
  • The VGA connector works with an older monitor.
  • Integrated graphics support lets a basic PC run without a graphics card.
  • The Intel B360 chipset works with DDR4 memory.
  • Four USB 3.2 Gen1 ports cover the basics.

What customers don't like about BIOSTAR TB360-BTC Pro

  • Two memory slots and a 32 GB maximum limit upgrades.
  • RAM runs at 2666 MT/s at most.
  • The 1 Gbps LAN is slow for large file transfers.
  • No Wi-Fi, no USB-C and no BIOS flashback.
  • No pump header, debug LEDs or automatic overclocking.

Verdict

Eleven PCIe x1 slots make the BIOSTAR TB360-BTC Pro an unusual board, built for a buyer who needs room for many add-in cards. It runs on the Intel B360 chipset with DDR4 memory, and two PS/2 ports and a VGA connector are handy for older keyboards and screens. Four USB 3.2 Gen1 ports cover the basics, and integrated graphics support means a simple setup needs no graphics card. The limits are real, though. Two memory slots take at most 32 GB, and the RAM tops out at 2666 MT/s. The 1 Gbps LAN is fine for browsing but slow for big transfers, and there is no Wi-Fi, no USB-C port and no BIOS flashback. It suits someone with a specific job in mind, not a general-purpose PC.

Compare BIOSTAR TB360-BTC Pro with other products in the Motherboards category

1Product to compare no. 1
VS
2Product to compare no. 2
VS
3Product to compare no. 3 (optional)

Graphic comparison of BIOSTAR TB360-BTC Pro and other products in the Motherboards category

No results found