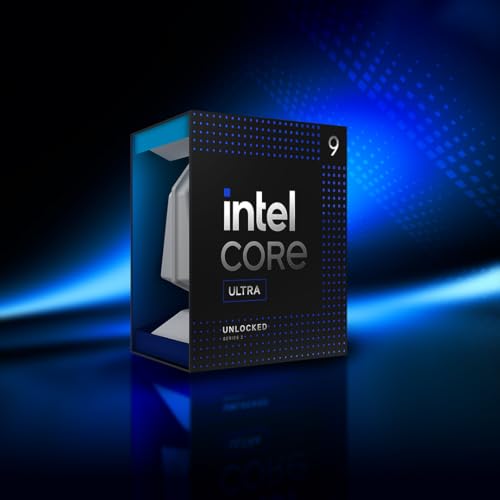
Intel Core Ultra 9 285K Review | 78 Data compared

double-arrow
  • Avg. price in UK: ~£440
  • Avg. price in US: ~$590
  • PassMark benchmark result: 67329
  • N. of physical cores: 24
  • CPU boost clock speed: 5.7 GHz

Intel Core Ultra 9 285K review. Compare 78 technical specifications and user reviews to see how it ranks among processors and if it is worth buying.

8.9

Overall score

What it is: An overall evaluation of the processor's quality, based on technical analyses and user reviews.

When it matters: When you need a quick reference to identify the best processors on the market.

Score components:

90.0%

8.8

Technical Score

10.0%

9.6

User score

Excellent
8.8

Technical Score

What it is: An assessment of the processor's technical performance, covering key areas such as processing performance, core configuration, efficiency, platform support, integrated features, and thermal behavior.

When it matters: When you want to compare processors based on technical performance and available features.

Score components:

60.0%

9.4

Performance

18.0%

9.0

Cache & Architecture

10.0%

9.4

Memory & PCIe

7.0%

2.0

Power & Thermal

4.0%

9.7

Platform

1.0%

7.7

Integrated Graphics

Excellent
9.6

User score

What it is: A rating that combines user reviews and the total number of reviews received by the processor.

When it matters: When you want to know how a processor performs in real workloads and how reliable it is for gaming, productivity, and efficiency according to user feedback.

Score components:

70.0%

9.4

User reviews

30.0%

10

Popularity

User score:
United Kingdom
amazon
4.7
(652)

(Reviews last updated: May 2026)

Exceptional
  • 9.1
    Gaming

    Score components:

    30.0%

    10

    PassMark single-core benchmark score

    25.0%

    9.4

    Geekbench 6 single-core benchmark score

    20.0%

    9.7

    CPU boost clock speed

    17.0%

    6.1

    L3 cache

    8.0%

    10

    N. of physical cores

  • 8.9
    Video editing

    Score components:

    45.0%

    9.9

    Geekbench 6 multi-core benchmark score

    20.0%

    10

    N. of physical cores

    20.0%

    7.6

    CPU threads

    15.0%

    6.1

    L3 cache

  • intel-core-ultra-9-285k
  • intel-core-ultra-9-285k
  • intel-core-ultra-9-285k
  • intel-core-ultra-9-285k
  • intel-core-ultra-9-285k
intel-core-ultra-9-285k

Best prices in UK

Best rankings

?

Available: ranking among products currently available (including other versions of this product).
All: ranking among all products in the database.

Verdict

The Intel Core Ultra 9 285K is a flagship Arrow Lake-S desktop processor featuring a 24-core, 24-thread configuration (8 Performance cores and 16 Efficiency cores) without Hyper-Threading support. Built on a 3nm process, it reaches a maximum turbo frequency of 5.7 GHz with a 3.7 GHz base clock, while offering 40 MB of L2 cache and 36 MB of L3 cache. Its main advantages include significantly improved energy efficiency, a dedicated 13 TOPS NPU for AI workloads, and support for high-speed DDR5-6400 memory and 20 PCIe 5.0 lanes on the LGA 1851 socket. However, its drawbacks include subpar gaming performance compared to previous generations, the lack of Hyper-Threading, and the requirement for a new Z890 motherboard, which increases total platform costs.

Technical Specifications of processor Intel Core Ultra 9 285K

Technical Score

What it is: An assessment of the processor's technical performance, covering key areas such as processing performance, core configuration, efficiency, platform support, integrated features, and thermal behavior.

When it matters: When you want to compare processors based on technical performance and available features.

Score components:

60.0%

9.4

Performance

18.0%

9.0

Cache & Architecture

10.0%

9.4

Memory & PCIe

7.0%

2.0

Power & Thermal

4.0%

9.7

Platform

1.0%

7.7

Integrated Graphics

8.8
Intel Core Ultra 9 285K has a technical score of 8.81 points, which is higher than that of 99.5% of products in this category.
User score

What it is: A rating that combines user reviews and the total number of reviews received by the processor.

When it matters: When you want to know how a processor performs in real workloads and how reliable it is for gaming, productivity, and efficiency according to user feedback.

Score components:

70.0%

9.4

User reviews

30.0%

10

Popularity

User score:
United Kingdom
amazon
4.7
(652)

(Reviews last updated: May 2026)

9.6
Intel Core Ultra 9 285K has a user score of 9.58 points, which is higher than that of 96.7% of products in this category.
Popularity
What it is: An indicator based on the number of reviews received by the processor.
When it matters: When you prefer to choose a processor reviewed and selected by many other buyers.
10
Intel Core Ultra 9 285K has a popularity of 10 points, which is higher than 88.3% of products in this category.
Ratio quality/price

What it is: An indicator that combines the processor's overall rating with its cost.

When it matters: When you are looking for a processor with a good balance between performance, efficiency, and price.

Score components:

60.0%

8.9

Overall score

40.0%

8.2

Price

8.7
Intel Core Ultra 9 285K has a quality-to-price ratio of 8.7 points, which is higher than 100% of products in this category.
Brand name
What it is: The manufacturer or brand of the product.
When it matters: When you prefer a specific ecosystem, support network, or design philosophy.

Importance: MEDIUM

Intel
Processor type
What it is: The kind of system the processor is built for, such as desktop PCs, laptops, workstations, or servers.
When it matters: When you want a processor meant for the kind of machine you are actually building or buying, rather than a chip aimed at a different class of system.

Importance: HIGH

desktop
Intel Core Ultra 9 285K belongs to the desktop processor class, which is more advanced than that of 56% of processors and equal to that of 37.9% of processors.
CPU socket
What it is: The physical socket the processor fits into on the motherboard.
When it matters: When you need to make sure the CPU can actually be installed on a specific motherboard.

Importance: HIGH

LGA1851
Intel Core Ultra 9 285K uses the LGA1,851 CPU socket, which is newer than that of 98.5% of processors and equal to that of 1.5% of processors.
Chipset
What it is: The motherboard chipset families officially meant to work with the processor.
When it matters: When you are checking whether a CPU will work with the motherboard features and platform you plan to use.

Importance: HIGH

Z890, B860, H810, Q870, W880
Intel Core Ultra 9 285K supports Z890, B860, H810, Q870, W880 chipsets, which is broader compatibility than 90.3% of processors and equal to that of 1% of processors.
CPU architecture
What it is: The processor family or design generation behind the chip, such as Zen 4 or Raptor Lake.
When it matters: When you are comparing CPUs across generations and want a clearer sense of their design age, feature level, and expected performance class.

Importance: HIGH

x86-64
Intel Core Ultra 9 285K uses the x86-64 architecture, which is more advanced than that of 1.7% of processors and equal to that of 98.3% of processors.
Show more
N. of physical cores
What it is: The number of physical CPU cores on the processor.
When it matters: When you run workloads that benefit from more real cores.

Importance: HIGH

Good value: 8+

24
Intel Core Ultra 9 285K has 24 CPU cores, which is more than 96.6% of processors and equal to 2.1% of processors.
CPU threads
What it is: The total number of processing threads the CPU can handle at once.
When it matters: When you run heavily threaded workloads or multitask a lot.

Importance: HIGH

Good value: 16+

24
Intel Core Ultra 9 285K offers 24 CPU threads, which is more than 90.3% of processors and equal to 4% of processors.
Threads per core
What it is: The number of threads each physical core can handle at once.
When it matters: When you want to understand how much thread-level parallelism each core can provide in multitasking or heavily threaded work.

Importance: MEDIUM

Good value: 2

1
Intel Core Ultra 9 285K offers 1 threads per core, which is fewer than 69.7% of processors and equal to 30.3% of processors.
CPU boost clock speed
What it is: The highest clock speed the processor can reach under boost conditions.
When it matters: When you care about peak speed in short bursts.

Importance: HIGH

Good value: >4.7 GHz

5.7 GHz
Intel Core Ultra 9 285K reaches a boost clock of 5.7 GHz which is higher than that of 99.1% of processors and equal to that of 0.3% of processors.
CPU base clock speed
What it is: The processor's normal all-core starting frequency before boost behavior raises clocks temporarily.
When it matters: When you care about steadier performance in longer workloads rather than short burst speed alone.

Importance: MEDIUM

8 x 3.7 GHz & 16 x 3.2 GHz
Intel Core Ultra 9 285K has a base clock of 8x3.7 GHz & 16x3.2 GHz which is equal to that of 100% of processors.
Show more
Semiconductor size
What it is: The manufacturing process node used to produce the processor, usually expressed in nanometers.
When it matters: When efficiency, heat, and the relative modernity of the chip-making process matter to your comparison.

Importance: HIGH

Good value: <10 nm

3 nm
Intel Core Ultra 9 285K uses a 3 nm process node, which is more advanced than that of 96% of processors and equal to that of 4% of processors.
Foundry
What it is: The semiconductor manufacturer that physically fabricates the processor chip.
When it matters: When process source, manufacturing generation, or foundry differences matter to your comparison more than day-to-day performance alone.

Importance: MEDIUM

TSMC 3 nm
Intel Core Ultra 9 285K is built on the TSMC 3 nm foundry process, which is more advanced than that of 96.2% of processors and equal to that of 3.8% of processors.
L3 cache
What it is: The total amount of L3 cache available on the processor.
When it matters: When you want better performance in cache-sensitive workloads and games.

Importance: MEDIUM

Good value: >=16 MB

36 MB
Intel Core Ultra 9 285K has an L3 cache of 36 MB which is larger than that of 92.7% of processors and equal to that of 1.8% of processors.
L2 cache
What it is: The total amount of L2 cache available across the processor.
When it matters: When you want to compare CPU design efficiency and how much fast intermediate cache the cores have available.

Importance: MEDIUM

Good value: >=6 MB

40 MB
Intel Core Ultra 9 285K has an L2 cache of 40 MB which is larger than that of 99% of processors and equal to that of 0.3% of processors.
L1 cache
What it is: The total amount of L1 cache built into the processor, which sits closest to the cores.
When it matters: When you are comparing low-level CPU design details rather than the broader performance picture buyers usually notice first.

Importance: MEDIUM

Good value: >=512 KB

?
Show more
DDR memory version
What it is: The RAM generation the processor is designed to support, such as DDR4 or DDR5.
When it matters: When you need the CPU to match the kind of memory platform you want to buy or reuse.

Importance: MEDIUM

Good value: DDR5

DDR5
Intel Core Ultra 9 285K supports DDR DDR5, which is newer than that of 66.4% of processors and equal to that of 12.6% of processors.
Maximum memory speed
What it is: The highest official memory speed supported by the processor.
When it matters: When you choose RAM and want to know the supported speed ceiling.

Importance: HIGH

Good value: >=4800 MHz

6,400 MHz
Intel Core Ultra 9 285K supports memory speeds up to 6,400 MHz, which is higher than that of 83.9% of processors and equal to 8.1% of processors.
Max memory speed (JEDEC)
What it is: The highest official RAM speed the processor supports under standard JEDEC settings, before any memory overclocking profiles are applied.
When it matters: When officially supported stock RAM speed matters more than XMP, EXPO, or manual memory tuning.

Importance: MEDIUM

Good value: >=5600 MHz

DDR5-6400 MHz
Intel Core Ultra 9 285K supports JEDEC memory speeds up to DDR5-6400 MHz, which is higher than that of 88.5% of processors and equal to 2.4% of processors.
Max memory speed (XMP / EXPO)
What it is: The highest memory speed supported through XMP or EXPO profiles.
When it matters: When you want faster RAM through memory profiles.

Importance: MEDIUM

Good value: >=5200 MHz

?
Maximum memory capacity
What it is: The largest total amount of memory officially supported by the processor.
When it matters: When you plan a system with very large RAM capacity.

Importance: HIGH

Good value: >=128 GB

192 GB
Intel Core Ultra 9 285K supports up to 192 GB of memory, which is more than 83.3% of processors and equal to 6% of processors.
Show more
Integrated graphics
What it is: Includes built-in graphics, so the system can output video without a separate graphics card.
When it matters: When you want the PC to work without a dedicated GPU, or you are building an office, media, compact, or troubleshooting-friendly system.

Importance: HIGH

yes
Intel Core Ultra 9 285K includes integrated graphics. 87.6% of processors include integrated graphics.
Integrated GPU model
What it is: The model name of the integrated graphics processor, if present.
When it matters: When you plan to use the CPU's built-in graphics.

Importance: MEDIUM

Intel Arc Xe-LPG Graphics 64EU
Intel Core Ultra 9 285K uses the Intel Arc Xe-LPG Graphics 64EU integrated GPU, which is more advanced than that in 84.8% of processors and equal to that in 1.3% of processors.
Integrated GPU execution units
What it is: The number of execution units available in the integrated graphics part of the processor.
When it matters: When you plan to rely on built-in graphics and want a better sense of its light gaming, display, or media capability.

Importance: MEDIUM

Good value: >=24

4
Intel Core Ultra 9 285K has 4 GPU execution units, which is fewer than 90.3% of processors and equal to 2.6% of processors.
Integrated GPU base frequency
What it is: The base operating frequency of the integrated GPU.
When it matters: When integrated graphics performance matters to you.

Importance: MEDIUM

Good value: >=350 MHz

300 MHz
Intel Core Ultra 9 285K has an integrated GPU clock of 300 MHz which is lower than that of 57% of processors and equal to that of 38.7% of processors.
Integrated media encoders/decoders
What it is: The hardware media formats the processor can encode or decode directly.
When it matters: When you stream, edit video, or rely on hardware media acceleration.

Importance: LOW

H.264 (HW decode/encode), H.265 (HW decode/encode), VP9 (HW decode/encode), AV1 (HW decode/encode)
Intel Core Ultra 9 285K supports H.264 (HW decode/encode), H.265 (HW decode/encode), VP9 (HW decode/encode), AV1 (HW decode/encode) media codecs, which is broader support than 94.6% of processors and equal to 1.9% of processors.
Show more
TDP (Thermal design power)
What it is: The rated thermal design power, which gives a general idea of cooling and power needs.
When it matters: When you choose a cooler or build in a tighter case.

Importance: HIGH

Good value: <30 W

125 W
Intel Core Ultra 9 285K has a TDP of 125 W which is higher than that of 92.9% of processors and equal to that of 1.4% of processors.
Base power (PL1)
What it is: The sustained power target used for longer CPU loads.
When it matters: When you choose cooling and power delivery for sustained workloads.

Importance: MEDIUM

Good value: <30 W

125 W
Intel Core Ultra 9 285K has a base power of 125 W which is higher than that of 92.9% of processors and equal to that of 1.5% of processors.
Boost power (PL2)
What it is: The short-term boost power limit the processor may draw under heavier turbo loads.
When it matters: When you size cooling and power delivery for peak turbo behavior.

Importance: MEDIUM

Good value: <50 W

250 W
Intel Core Ultra 9 285K has a boost power of 250 W which is higher than that of 96.1% of processors and equal to that of 0.8% of processors.
Tau (power duration limit)
What it is: The time limit the CPU can stay at higher boost power before dropping toward sustained power.
When it matters: When you want to understand turbo behavior under longer loads.

Importance: MEDIUM

Good value: <=28 s

56 seconds
Intel Core Ultra 9 285K has a turbo duration of 56 seconds which is shorter than that of 96.7% of processors and equal to that of 3.3% of processors.
Configurable TDP
What it is: Allows the processor to run in alternate power modes instead of being fixed to one default TDP target.
When it matters: When you want more control over heat, noise, and power draw in compact systems, quieter builds, or thermally limited machines.

Importance: LOW

no
Intel Core Ultra 9 285K does not support configurable TDP. 52.9% of processors support configurable TDP.
Show more

Intel Core Ultra 9 285K vs the average processor

  • 6.39x higher PassMark score
    Intel Core Ultra 9 285K has a higher PassMark benchmark score than the average processor (67,329 vs 10,532.5). The average processor scores 10,532.5 in PassMark benchmark.
    What it is: A benchmark score that gives a broad idea of overall processor performance.
    When it matters: When you want a quick overall performance comparison.

    Importance: HIGH

    Good value: >19000

    Intel Core Ultra 9 285K has a higher PassMark benchmark score than the average processor (67,329 vs 10,532.5). The average processor scores 10,532.5 in PassMark benchmark.67,329 vs 10,532.5
  • 4.74x higher multi-core score
    Intel Core Ultra 9 285K has a higher Geekbench 6 multi-core score than the average processor (22,722 vs 4,793). The average processor scores 4,793 in Geekbench 6 multi-core.
    What it is: A Geekbench 6 score that reflects multi-core CPU performance in mixed modern workloads.
    When it matters: When you want a quick picture of multi-core speed in everyday mixed workloads, multitasking, and broadly optimized software.

    Importance: HIGH

    Good value: >8500

    Intel Core Ultra 9 285K has a higher Geekbench 6 multi-core score than the average processor (22,722 vs 4,793). The average processor scores 4,793 in Geekbench 6 multi-core.22,722 vs 4,793
  • 2.05x better single-core performance
    Intel Core Ultra 9 285K has a higher PassMark single-core score than the average processor (5,090 vs 2,483). The average processor scores 2,483 in PassMark single-core.
    What it is: A benchmark score that reflects single-core CPU performance.
    When it matters: When you care about responsiveness in lighter or older software.

    Importance: HIGH

    Good value: >3200

    Intel Core Ultra 9 285K has a higher PassMark single-core score than the average processor (5,090 vs 2,483). The average processor scores 2,483 in PassMark single-core.5,090 vs 2,483
  • 18 more CPU cores
    Intel Core Ultra 9 285K has more CPU cores than the average processor (24 vs 6). The average processor has 6 CPU cores.
    What it is: The number of physical CPU cores on the processor.
    When it matters: When you run workloads that benefit from more real cores.

    Importance: HIGH

    Good value: 8+

    Intel Core Ultra 9 285K has more CPU cores than the average processor (24 vs 6). The average processor has 6 CPU cores.24 vs 6
  • 2.17x higher single-core score
    Intel Core Ultra 9 285K has a higher Geekbench 6 single-core score than the average processor (3,199 vs 1,471). The average processor scores 1,471 in Geekbench 6 single-core.
    What it is: A Geekbench 6 score that reflects single-core CPU performance in mixed modern workloads.
    When it matters: When you care about snappy everyday performance in lighter apps, browsing, office work, or tasks that do not scale well across many cores.

    Importance: HIGH

    Good value: >2000

    Intel Core Ultra 9 285K has a higher Geekbench 6 single-core score than the average processor (3,199 vs 1,471). The average processor scores 1,471 in Geekbench 6 single-core.3,199 vs 1,471
  • 32.6% higher boost clock
    Intel Core Ultra 9 285K has a higher boost clock speed than the average processor (5.7 GHz vs 4.3 GHz). The average processor reaches boost clock speed of 4.3 GHz.
    What it is: The highest clock speed the processor can reach under boost conditions.
    When it matters: When you care about peak speed in short bursts.

    Importance: HIGH

    Good value: >4.7 GHz

    Intel Core Ultra 9 285K has a higher boost clock speed than the average processor (5.7 GHz vs 4.3 GHz). The average processor reaches boost clock speed of 4.3 GHz.5.7 GHz vs 4.3 GHz
  • 16x larger L2 cache
    Intel Core Ultra 9 285K has a higher L2 cache than the average processor (40 MB vs 2.5 MB). The average processor has L2 cache of 2.5 MB.
    What it is: The total amount of L2 cache available across the processor.
    When it matters: When you want to compare CPU design efficiency and how much fast intermediate cache the cores have available.

    Importance: MEDIUM

    Good value: >=6 MB

    Intel Core Ultra 9 285K has a higher L2 cache than the average processor (40 MB vs 2.5 MB). The average processor has L2 cache of 2.5 MB.40 MB vs 2.5 MB
  • 16 more CPU threads
    Intel Core Ultra 9 285K has more CPU threads than the average processor (24 vs 8). The average processor has 8 CPU threads.
    What it is: The total number of processing threads the CPU can handle at once.
    When it matters: When you run heavily threaded workloads or multitask a lot.

    Importance: HIGH

    Good value: 16+

    Intel Core Ultra 9 285K has more CPU threads than the average processor (24 vs 8). The average processor has 8 CPU threads.24 vs 8
  • Advanced security extensions
    Intel Core Ultra 9 285K provides more advanced security extensions than the average processor (AES-NI, NX bit, Secure Key, TXT, OS Guard, Boot Guard, CET, MBEC, TDT, TME, TME-MK vs AES-NI, NX bit, Secure Processor).
  • Modern CPU socket
    Intel Core Ultra 9 285K uses a more modern CPU socket than the average processor (LGA1,851 vs FP2).
  • Broader instruction support
    Intel Core Ultra 9 285K supports a broader instruction set than the average processor (MMX, SSE, SSE2, SSE3, SSSE3, SSE4.1, SSE4.2, AVX, AVX2, AVX-VNNI, F16C, FMA3, AES, SHA, CLMUL, BMI1, BMI2, ABM, ADX vs MMX, SSE, SSE2, SSE3, SSSE3, SSE4A, SSE4.1, SSE4.2, AVX, AVX2, F16C, FMA3, AES, SHA).
  • 4 year/s newer release date
    Intel Core Ultra 9 285K has a newer release date than the average processor (2024 vs 2020).
  • Includes crypto acceleration
    Intel Core Ultra 9 285K includes crypto acceleration, the average processor does not.
  • Supports HMP
    Intel Core Ultra 9 285K supports HMP, the average processor does not.
  • 6.39x higher PassMark score
    Intel Core Ultra 9 285K has a higher PassMark benchmark score than the average processor (67,329 vs 10,532.5). The average processor scores 10,532.5 in PassMark benchmark.
  • 4.74x higher multi-core score
    Intel Core Ultra 9 285K has a higher Geekbench 6 multi-core score than the average processor (22,722 vs 4,793). The average processor scores 4,793 in Geekbench 6 multi-core.
  • 2.05x better single-core performance
    Intel Core Ultra 9 285K has a higher PassMark single-core score than the average processor (5,090 vs 2,483). The average processor scores 2,483 in PassMark single-core.
  • 18 more CPU cores
    Intel Core Ultra 9 285K has more CPU cores than the average processor (24 vs 6). The average processor has 6 CPU cores.
  • 2.17x higher single-core score
    Intel Core Ultra 9 285K has a higher Geekbench 6 single-core score than the average processor (3,199 vs 1,471). The average processor scores 1,471 in Geekbench 6 single-core.
  • 32.6% higher boost clock
    Intel Core Ultra 9 285K has a higher boost clock speed than the average processor (5.7 GHz vs 4.3 GHz). The average processor reaches boost clock speed of 4.3 GHz.
  • 16 more CPU threads
    Intel Core Ultra 9 285K has more CPU threads than the average processor (24 vs 8). The average processor has 8 CPU threads.
  • Unlocked for overclocking
    Intel Core Ultra 9 285K has an unlocked multiplier, the average processor does not.
  • 16x larger L2 cache
    Intel Core Ultra 9 285K has a higher L2 cache than the average processor (40 MB vs 2.5 MB). The average processor has L2 cache of 2.5 MB.
  • More advanced microarchitecture
    Intel Core Ultra 9 285K uses a more advanced microarchitecture than the average processor (Arrow Lake vs Kaby Lake).
  • 6x more L2 per core
    Intel Core Ultra 9 285K has more L2 cache per core than the average processor (3 MB/core vs 0.5 MB/core). The average processor provides 0.5 MB/core of L2 cache per core.
  • 4.5x larger L3 cache
    Intel Core Ultra 9 285K has a higher L3 cache than the average processor (36 MB vs 8 MB). The average processor has L3 cache of 8 MB.
  • 75% smaller process node
    Intel Core Ultra 9 285K has a lower process node than the average processor (3 nm vs 12 nm). The average processor uses a process node of 12 nm.
  • Uses big.LITTLE design
    Intel Core Ultra 9 285K uses a big.LITTLE design, the average processor does not.
  • More advanced foundry
    Intel Core Ultra 9 285K uses a more advanced foundry process than the average processor (TSMC 3 nm vs Intel 14 nm).
  • 3.6x more transistors
    Intel Core Ultra 9 285K has more transistors than the average processor (17.8 billion vs 4.95 billion). The average processor has 4.95 billion transistors.
  • Newer PCIe version
    Intel Core Ultra 9 285K supports a newer PCIe version than the average processor (5 vs 3.0).
  • 8 more PCIe lanes
    Intel Core Ultra 9 285K has more PCIe lanes than the average processor (24 vs 16). The average processor offers 16 PCIe lanes.
  • 2.24x higher memory bandwidth
    Intel Core Ultra 9 285K has a higher memory bandwidth than the average processor (102.4 GB/s vs 45.8 GB/s). The average processor offers memory bandwidth of 45.8 GB/s.
  • 3x more memory capacity
    Intel Core Ultra 9 285K has more maximum memory capacity than the average processor (192 GB vs 64 GB). The average processor supports 64 GB of memory.
  • 2.18x higher memory speed
    Intel Core Ultra 9 285K has a higher maximum memory speed than the average processor (6,400 MHz vs 2,933 MHz). The average processor supports memory speed of 2,933 MHz.
  • Supports memory overclocking
    Intel Core Ultra 9 285K supports memory overclocking, the average processor does not.
  • Newer DDR support
    Intel Core Ultra 9 285K supports a newer DDR generation than the average processor (DDR5 vs DDR4).
  • Supports ECC memory
    Intel Core Ultra 9 285K supports ECC memory, the average processor does not.
  • Higher JEDEC memory speed
    Intel Core Ultra 9 285K has a higher JEDEC memory speed than the average processor (DDR5-6400 MHz vs DDR4-3200 MHz). The average processor supports JEDEC memory speed of DDR4-3200 MHz.
  • Better integrated GPU
    Intel Core Ultra 9 285K uses a better integrated GPU than the average processor (Intel Arc Xe-LPG Graphics 64EU vs Intel UHD Graphics 630).
  • 1 more supported displays
    Intel Core Ultra 9 285K has more supported displays than the average processor (4 vs 3). The average processor supports 3 displays.
  • 5 °C higher TJ Max
    Intel Core Ultra 9 285K has a higher TJ Max than the average processor (105 °C vs 100 °C). The average processor has a TJ Max of 100 °C.
  • No multithreading support
    Intel Core Ultra 9 285K does not support multithreading, the average processor does.
  • 1 fewer threads per core
    Intel Core Ultra 9 285K has fewer threads per core than the average processor (1 vs 2). The average processor offers 2 threads per core.
  • 12.5% less L3 per core
    Intel Core Ultra 9 285K has less L3 cache per core than the average processor (1.5 MB/core vs 1.714 MB/core). The average processor provides 1.714 MB/core of L3 cache per core.
  • 83.3% fewer GPU execution units
    Intel Core Ultra 9 285K has fewer GPU execution units than the average processor (4 vs 24). The average processor has 24 GPU execution units.
  • 3.91x higher boost power
    Intel Core Ultra 9 285K has a higher boost power draw than the average processor (250 W vs 64 W). The average processor has a boost power draw of 64 W.
  • 2.78x higher base power
    Intel Core Ultra 9 285K has a higher base power draw than the average processor (125 W vs 45 W). The average processor has a base power draw of 45 W.
  • 2.78x higher TDP
    Intel Core Ultra 9 285K has a higher TDP than the average processor (125 W vs 45 W). The average processor has a TDP of 45 W.
  • No configurable TDP
    Intel Core Ultra 9 285K does not support configurable TDP, the average processor does.
  • 5 °C higher CPU temperature
    Intel Core Ultra 9 285K has a higher CPU temperature than the average processor (105 °C vs 100 °C). The average processor runs at a CPU temperature of 100 °C.
  • 28 seconds shorter turbo duration
    Intel Core Ultra 9 285K has a lower turbo duration limit than the average processor (56 seconds vs 28 seconds). The average processor maintains turbo for 28 seconds.
  • 3.91x higher boost power
    Intel Core Ultra 9 285K has a higher boost power draw than the average processor (250 W vs 64 W). The average processor has a boost power draw of 64 W.
    What it is: The short-term boost power limit the processor may draw under heavier turbo loads.
    When it matters: When you size cooling and power delivery for peak turbo behavior.

    Importance: MEDIUM

    Good value: <50 W

    Intel Core Ultra 9 285K has a higher boost power draw than the average processor (250 W vs 64 W). The average processor has a boost power draw of 64 W.250 W vs 64 W
  • 2.78x higher base power
    Intel Core Ultra 9 285K has a higher base power draw than the average processor (125 W vs 45 W). The average processor has a base power draw of 45 W.
    What it is: The sustained power target used for longer CPU loads.
    When it matters: When you choose cooling and power delivery for sustained workloads.

    Importance: MEDIUM

    Good value: <30 W

    Intel Core Ultra 9 285K has a higher base power draw than the average processor (125 W vs 45 W). The average processor has a base power draw of 45 W.125 W vs 45 W
  • No multithreading support
    Intel Core Ultra 9 285K does not support multithreading, the average processor does.
    What it is: Lets each physical core run more than one thread at the same time, such as with Hyper-Threading or SMT.
    When it matters: When multitasking, rendering, compiling, virtualization, or other thread-heavy work benefits from more total processing threads.

    Importance: HIGH

    Intel Core Ultra 9 285K does not support multithreading, the average processor does.
  • 2.78x higher TDP
    Intel Core Ultra 9 285K has a higher TDP than the average processor (125 W vs 45 W). The average processor has a TDP of 45 W.
    What it is: The rated thermal design power, which gives a general idea of cooling and power needs.
    When it matters: When you choose a cooler or build in a tighter case.

    Importance: HIGH

    Good value: <30 W

    Intel Core Ultra 9 285K has a higher TDP than the average processor (125 W vs 45 W). The average processor has a TDP of 45 W.125 W vs 45 W
  • No configurable TDP
    Intel Core Ultra 9 285K does not support configurable TDP, the average processor does.
    What it is: Allows the processor to run in alternate power modes instead of being fixed to one default TDP target.
    When it matters: When you want more control over heat, noise, and power draw in compact systems, quieter builds, or thermally limited machines.

    Importance: LOW

    Intel Core Ultra 9 285K does not support configurable TDP, the average processor does.
  • 12.5% less L3 per core
    Intel Core Ultra 9 285K has less L3 cache per core than the average processor (1.5 MB/core vs 1.714 MB/core). The average processor provides 1.714 MB/core of L3 cache per core.
    What it is: The amount of L3 cache effectively available per CPU core.
    When it matters: When you are comparing how much shared cache each core can draw on in deeper technical analysis.

    Importance: MEDIUM

    Good value: >=2 MB/core

    Intel Core Ultra 9 285K has less L3 cache per core than the average processor (1.5 MB/core vs 1.714 MB/core). The average processor provides 1.714 MB/core of L3 cache per core.1.5 MB/core vs 1.714 MB/core
  • 5 °C higher CPU temperature
    Intel Core Ultra 9 285K has a higher CPU temperature than the average processor (105 °C vs 100 °C). The average processor runs at a CPU temperature of 100 °C.
    What it is: The reported operating temperature of the processor.
    When it matters: When you monitor thermals, cooling, or system stability.

    Importance: LOW

    Good value: <100 °C

    Intel Core Ultra 9 285K has a higher CPU temperature than the average processor (105 °C vs 100 °C). The average processor runs at a CPU temperature of 100 °C.105 °C vs 100 °C
  • 76% more expensive
    Intel Core Ultra 9 285K is more expensive than the average processor (£440 vs £250).
    Intel Core Ultra 9 285K is more expensive than the average processor (£440 vs £250).£440 vs £250

Graphic comparison of Intel Core Ultra 9 285K and other processors

Attribute category
Attribute
No results found

Third-party reviews

United Kingdom

(Reviews last updated: May 2026)

What customers like about Intel Core Ultra 9 285K?

  • Significantly improved power efficiency with lower overall power consumption compared to the Core i9-14900K.
  • Runs much cooler under load, often not requiring high-end delidding or extreme cooling solutions to maintain stable temperatures.
  • Strong multi-threaded performance in productivity and creative workloads like video editing and 3D rendering.
  • Substantial 100% or greater generational gains in integrated graphics (iGPU) performance.
  • Includes a dedicated NPU for AI-based background tasks and software acceleration.
  • Support for high-speed DDR5 memory (CUDIMMs) exceeding 8000+ MHz.

What customers dislike about Intel Core Ultra 9 285K?

  • Underwhelming and inconsistent gaming performance, often trailing behind previous-gen Intel chips and AMD's X3D series.
  • High total cost of entry due to the requirement for new LGA 1851 motherboards and expensive Z890 chipsets.
  • Removal of Hyper-Threading can lead to performance regressions in specific legacy or latency-sensitive applications.
  • Higher memory latency compared to the previous Raptor Lake architecture.
  • Performance swings in early testing suggest a need for further software and BIOS optimization.
  • NPU performance (13 TOPS) falls short of the 40 TOPS required for certain flagship AI certifications like Microsoft Copilot+.

Expert reviews

P
pcworld.com
24/10/2024
Summary of the review
C
club386.com
24/10/2024
Summary of the review
H
hwbusters.com
24/10/2024
Summary of the review
T
techspot.com
24/10/2024
Summary of the review
I
ign.com
24/10/2024
Summary of the review
P
pcmag.com
24/10/2024
Summary of the review
W
wepc.com
18/12/2024
Summary of the review
H
hwcooling.net
29/11/2024
Summary of the review
W
windowscentral.com
31/10/2024
Summary of the review
G
gamersnexus.net
29/10/2024
Summary of the review
T
tweaktown.com
25/10/2024
Summary of the review
I
itc.ua
12/12/2024
Summary of the review
C
cgmagonline.com
24/10/2024
Summary of the review
D
digitalfoundry.net
24/10/2024
Summary of the review
T
techradar.com
24/10/2024
Summary of the review
P
pcgamer.com
24/10/2024
Summary of the review
T
tomshardware.com
24/10/2024
Summary of the review
V
vividrepairs.co.uk
28/01/2026
Summary of the review
P
pcmasters.de
24/10/2024
Summary of the review
L
lemondeinformatique.fr
28/10/2024
Summary of the review
G
ginjfo.com
24/10/2024
Summary of the review
H
hardwarecooking.fr
24/10/2024
Summary of the review
L
lesnumeriques.com
24/10/2024
Summary of the review
R
rue-montgallet.com
29/09/2025
Summary of the review
C
clubic.com
05/11/2024
Summary of the review
A
as.com
26/12/2024
Summary of the review
G
gameit.es
13 de noviembre de 2024
Summary of the review
H
hardzone.es
24/10/2024
Summary of the review
P
profesionalreview.com
24/10/2024
Summary of the review
N
noticias3d.com
24/10/2024
Summary of the review
T
tuttotech.net
25/03/2025
Summary of the review
T
tomshw.it
24/10/2024
Summary of the review
T
tweakers.net
24/10/2024
Summary of the review

Video reviews

Compare Intel Core Ultra 9 285K with other processors

VS
VS

Compare