Scored using Processors Methodology v3.0
Processors Methodology v3.0
Mathematical & Unbiased Scoring
Products in this category are scored under Frontum Processors Methodology v3.0: the technical score from the specifications is the base, and independent expert and video reviews (up to ±0.5 points), owner opinions (up to ±0.3) and best-of lists (up to +0.3) move it up or down.
Explore Processors Methodology v3.0

AMD Ryzen 9 3950X review: 74 specs compared

Avg. price:~£330PassMark multi-core score:38448N. of physical cores:16CPU boost clock speed:4.7 GHzCPU socket:AM4TDP (Thermal design power):105 W

AMD Ryzen 9 3950X Review: Compare 74 technical specifications, 56 expert and video reviews and 1 best-of list to see how this product ranks in the Processors category and whether it is worth buying.
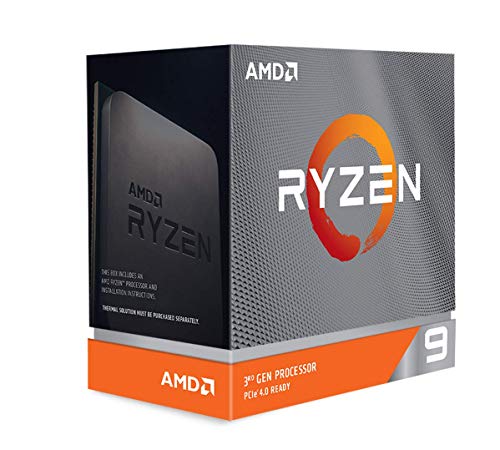
AMD Ryzen 9 3950X
8.1/10

Overall score

Score
8.1/ 10
✕
What it is
Our main score for this model, 1–10. It combines specs, expert reviews, best-of lists and owners.
How we count it
Parts: Technical score 40%, Reviews score 25%, List score 25%, Sentiment score 10%
Marks: Each part gets a mark out of 10. For reviews, lists and owners, a typical model in this category gets about 8 and the best one gets 10.
No data yet: A part with no data shows "?". It counts as the mark of a weaker model in this category (4 in 5 models with data score higher). This way, models with reviews, lists and owners usually come out ahead.
Score distribution
▼
<55-66-77-88-99-10
Score components

40%

7.7

Technical score

25%

9.0

Reviews score

25%

7.7

List score

10%

8.8

Sentiment score

★Better than 96% of processors
8.3

Value for money

Value for money
8.3/ 10
✕
What it is
An indicator that combines the processor's overall rating with its cost.
When it matters
When you are looking for a processor with a good balance between performance, efficiency, and price.
Score distribution
▼
<55-66-77-88-99-10
Score components

70%

8.1

Overall score

30%

8.8

Price

★Better than 95%
7.7

Technical score

Technical score
7.7/ 10
✕
What it is
How good the specs are compared with the other models in this category, 1–10.
How we count it
Areas: We rate the specs in each area against the other models in this category.
Weighting: The areas that matter most to buyers count more. The shares are shown under Score components.
Share: The technical score is 40% of the overall score.
Score distribution
▼
<55-66-77-88-99-10
Score components

60%

8.1

Performance

18%

7.2

Architecture

10%

7.3

Memory & PCIe

7%

6.1

Power & Thermal

4%

8.6

Platform

1%

4.0

Integrated graphics

▲Better than 81%
9.0

Reviews score

Reviews score
9.0/ 10
✕
What it is
Average grade from independent test sites, magazines and video reviewers, 1–10.
How we count it
Grades: Each review's own score is converted to 1–10; without one, we grade the review ourselves. Big test sites count more, short reviews half as much as full tests. A video review counts half.
Score: The average grade is 80% of the review mark; the number of reviews is the other 20% (1 review = 5, the typical number in this category = 8, the most-reviewed model = 10).
Enough data: With few reviews, the average grade is pulled toward the typical grade of this category. No reviews yet: 7.2 for now.
Share: Reviews count 25% of the overall score.
Score distribution
▼
<55-66-77-88-99-10

80%

8.8

Average grade

20%

9.9

Popularity

Grades by review (56)
28 reviews: 10 with a printed score, 18 estimated from the review. 28 video reviews, each counting half as much as a written test. Reviews count 25% of the overall score.
User ratings collected online are not part of this score.
★Better than 100%
7.7

List score

List score
7.7/ 10
✕
What it is
How often independent test sites, magazines and video reviewers put this model in their best-of lists for this category.
How we count it
Points: The model in the most lists of this category gets 10; the others get 8 to 10 in proportion. In no list yet: 7.5. Lists count 25% of the overall score.
Enough data: Every list counts, even a single one. With fewer than 5 best-of lists in the category, this part is left out.
Lists with this model (1)
List score: in 1 of 87 lists (1%)
▲Better than 89%
  • amd-ryzen-9-3950x
  • amd-ryzen-9-3950x
  • amd-ryzen-9-3950x
  • amd-ryzen-9-3950x
amd-ryzen-9-3950x
amd-ryzen-9-3950x
amd-ryzen-9-3950x
amd-ryzen-9-3950x
Where to buy
*As an Amazon Associate, we earn from qualifying purchases.
Best rankings
Available: ranking among products currently available (including other versions of this product).All: ranking among all products in the database.

What reviewers say about the AMD Ryzen 9 3950X

Based on 10 · 29

Reviewers agree its multi-core performance is outstanding, but gaming results disappoint and overclocking headroom is limited.
Praised
Mixed views
Criticised
Pick a topic to see who said what

What owners say about the AMD Ryzen 9 3950X

Based on 181 owners sharing their experience in online comments

62%positive23%mixed15%negative

Owners value its exceptional work speed and multitasking, while heat, tuning limits, and gaming performance draw the clearest complaints.

What owners dislike

  • Owners find overclocks need trial and error, with chips often stable only at 4.3 GHz or lower, and some failing Prime95 at 4.4 GHz.20
  • Several owners say gaming fps trails Intel rivals by a few to around 20 fps, and fast shooters can feel AMD latency.13
  • Without strong cooling, owners see temperatures near 80 to 90 °C under load, and some overclocks shut the system down from heat.11
  • Owners report auto settings on some boards push core voltage to about 1.4 to 1.45 V, and many worry this shortens chip life.10
  • Some owners hit BIOS trouble: a bad update bricked a board until it was reflashed, and some boards needed an update to see all RAM.7
  • Some owners find only certain memory kits stay stable at their rated speed on some boards, while other brands cause blue screens or reboots.7
  • Some owners get random blue screens, especially with virtualization on, and some report choppy use or a unit that died after about a year.6
  • Overclocked loads can draw about 215 to 285 W for the CPU alone, and idle power at the wall can run higher than Intel systems.3

Points mentioned by at least 3 owners, most mentioned first.

Loading...
Loading category ranking...

Technical Specifications of processor AMD Ryzen 9 3950X

Technical score
Technical score
7.7/ 10
✕
What it is
How good the specs are compared with the other models in this category, 1–10.
How we count it
Areas: We rate the specs in each area against the other models in this category.
Weighting: The areas that matter most to buyers count more. The shares are shown under Score components.
Share: The technical score is 40% of the overall score.
Score distribution
▼
<55-66-77-88-99-10
Score components:

60%

8.1

Performance

18%

7.2

Architecture

10%

7.3

Memory & PCIe

7%

6.1

Power & Thermal

4%

8.6

Platform

1%

4.0

Integrated graphics

7.7
Reviews score
9.0
List score
7.7
Value for money
Value for money
8.3/ 10
✕
What it is
An indicator that combines the processor's overall rating with its cost.
When it matters
When you are looking for a processor with a good balance between performance, efficiency, and price.
Score distribution
▼
<55-66-77-88-99-10
Score components:

70%

8.1

Overall score

30%

8.8

Price

8.3
Processor type
desktop
This processor belongs to the desktop processor class, which is more advanced than that of 54.7% of processors and equal to that of 39.5% of processors.
CPU socket
AM4
This processor uses the AM4 CPU socket, which is newer than that of 75.1% of processors and equal to that of 9.4% of processors.
Chipset
X570, B550, X470, B450, X370, B350, A320
This processor supports X570, B550, X470, B450, X370, B350, A320 chipsets, which is broader compatibility than 71.4% of processors and equal to that of 0.6% of processors.
CPU architecture
x86-64
This processor uses the x86-64 architecture, which is more advanced than that of 1.8% of processors and equal to that of 98.2% of processors.
Instruction sets
MMX, SSE, SSE2, SSE3, SSSE3, SSE4A, SSE4.1, SSE4.2, AVX, AVX2, FMA3, AES, SHA, AMD-V
This processor supports MMX, SSE, SSE2, SSE3, SSSE3, SSE4A, SSE4.1, SSE4.2, AVX, AVX2, FMA3, AES, SHA, AMD-V instruction sets, which is broader support than 54.5% of processors and equal to that of 3.5% of processors.
Show more
N. of physical cores
16
This processor has 16 CPU cores, which is more than 90% of processors and equal to 4.6% of processors.
CPU threads
32
This processor offers 32 CPU threads, which is more than 94.9% of processors and equal to 3.2% of processors.
CPU boost clock speed
4.7 GHz
This processor reaches a boost clock of 4.7 GHz which is higher than that of 64.8% of processors and equal to that of 4% of processors.
CPU base clock speed
16x 3.5 GHz
This processor has a base clock of 16x3.5 GHz which is higher than that of 96.1% of processors and equal to that of 0.1% of processors.
PassMark multi-core score
38,448
This processor scores 38,448 in PassMark, which is higher than 91.5% of processors.
Show more
What reviewers say
Semiconductor size
7 nm
This processor uses a 7 nm process node, which is more advanced than that of 70.4% of processors and equal to that of 10.5% of processors.
Foundry
TSMC 7 nm
This processor is built on the TSMC 7 nm foundry process, which is more advanced than that of 55.6% of processors and equal to that of 9.2% of processors.
L3 cache
64 MB
This processor has an L3 cache of 64 MB which is larger than that of 94.5% of processors and equal to that of 2.8% of processors.
L2 cache
8 MB
This processor has an L2 cache of 8 MB which is larger than that of 72% of processors and equal to that of 4.4% of processors.
L1 cache
1,024 KB
This processor has an L1 cache of 1,024 KB which is larger than that of 85.7% of processors and equal to that of 1.5% of processors.
Show more
DDR memory version
DDR4
This processor supports DDR DDR4, which is newer than that of 25.2% of processors and equal to that of 31.1% of processors.
Maximum memory speed
3,200 MHz
This processor supports memory speeds up to 3,200 MHz, which is higher than that of 49.8% of processors and equal to 8.5% of processors.
Max memory speed (JEDEC)
DDR4-3200 MHz
This processor supports JEDEC memory speeds up to DDR4-3200 MHz, which is higher than that of 46.1% of processors and equal to 9.4% of processors.
Max memory speed (XMP / EXPO)
3,600 MHz
This processor supports XMP/EXPO memory speeds up to 3,600 MHz, which is higher than that of 92.8% of processors and equal to 0.4% of processors.
Maximum memory capacity
128 GB
This processor supports up to 128 GB of memory, which is more than 59.3% of processors and equal to 22.8% of processors.
Show more
What reviewers say
Integrated graphics
no
This processor does not include integrated graphics. 85.4% of processors offer this.
Integrated GPU model
N/A
Integrated GPU execution units
N/A
Integrated GPU base frequency
N/A
Integrated media encoders/decoders
N/A
Show more
TDP (Thermal design power)
105 W
This processor has a TDP of 105 W which is higher than that of 89.7% of processors and equal to that of 1% of processors.
Base power (PL1)
105 W
This processor has a base power of 105 W which is higher than that of 89.9% of processors and equal to that of 1% of processors.
Boost power (PL2)
?
Tau (power duration limit)
N/A
Configurable TDP
yes
This processor supports configurable TDP. 46.4% of processors offer this.
cTDP: 65 W
Show more
What reviewers say

AMD Ryzen 9 3950X vs the average processor

246810TotalPlatformPerformanceArchitectureMemory & PCIeIntegrated graphicsPower & Thermal
  • 3.35x higher PassMark score
    This processor has a higher PassMark benchmark score than the average processor (38,448 vs 11,469). The average processor scores 11,469 in PassMark benchmark.
    38,448 vs 11,469
  • 10 more CPU cores
    This processor has more CPU cores than the average processor (16 vs 6). The average processor has 6 CPU cores.
    16 vs 6
  • 3.26x better multi-core performance
    This processor has a higher multi-core performance than the average processor (9,148 vs 2,804.5). The average processor scores 2,804.5 in Cinebench R20 multi-core.
    9,148 vs 2,804.5
  • 12 more performance cores
    This processor has more performance cores than the average processor (16 vs 4). The average processor has 4 performance cores.
    16 vs 4
  • 24 more CPU threads
    This processor has more CPU threads than the average processor (32 vs 8). The average processor has 8 CPU threads.
    32 vs 8
  • 2.07x higher multi-core score
    This processor has a higher Geekbench 6 multi-core score than the average processor (10,762 vs 5,209). The average processor scores 5,209 in Geekbench 6 multi-core.
    10,762 vs 5,209
  • Higher base clock
    This processor has a higher base clock than the average processor (16x3.5 GHz vs 4x3.4 GHz).
    16x3.5 GHz vs 4x3.4 GHz
  • 7.11x larger L3 cache
    This processor has a higher L3 cache than the average processor (64 MB vs 9 MB). The average processor has L3 cache of 9 MB.
    64 MB vs 9 MB
  • 34.3% higher review score
    Reviews score
    9.0/ 10
    ✕
    What it is
    Average grade from independent test sites, magazines and video reviewers, 1–10.
    How we count it
    Grades: Each review's own score is converted to 1–10; without one, we grade the review ourselves. Big test sites count more, short reviews half as much as full tests. A video review counts half.
    Score: The average grade is 80% of the review mark; the number of reviews is the other 20% (1 review = 5, the typical number in this category = 8, the most-reviewed model = 10).
    Enough data: With few reviews, the average grade is pulled toward the typical grade of this category. No reviews yet: 7.2 for now.
    Share: Reviews count 25% of the overall score.
    Score distribution
    ▼
    <55-66-77-88-99-10

    80%

    8.8

    Average grade

    20%

    9.9

    Popularity

    Grades by review (56)
    28 reviews: 10 with a printed score, 18 estimated from the review. 28 video reviews, each counting half as much as a written test. Reviews count 25% of the overall score.
    User ratings collected online are not part of this score.
    9.0 vs 6.7
  • 22.2% higher sentiment score
    8.8 vs 7.2
  • 14.5% better value for money
    AMD Ryzen 9 3950X has better value for money than the average processor (8.34 vs 7.3).
    8.34 vs 7.29
  • Modern CPU socket
    This processor uses a more modern CPU socket than the average processor (AM4 vs FP5).
    AM4 vs FP5
  • More extensive crypto acceleration
    This processor offers more extensive crypto acceleration than the average processor (AES, SHA, PCLMULQDQ vs AES, SHA).
    AES, SHA, PCLMULQDQ vs AES, SHA
  • 3.35x higher PassMark score
    This processor has a higher PassMark benchmark score than the average processor (38,448 vs 11,469). The average processor scores 11,469 in PassMark benchmark.
    38,448 vs 11,469
  • 10 more CPU cores
    This processor has more CPU cores than the average processor (16 vs 6). The average processor has 6 CPU cores.
    16 vs 6
  • 3.26x better multi-core performance
    This processor has a higher multi-core performance than the average processor (9,148 vs 2,804.5). The average processor scores 2,804.5 in Cinebench R20 multi-core.
    9,148 vs 2,804.5
  • 12 more performance cores
    This processor has more performance cores than the average processor (16 vs 4). The average processor has 4 performance cores.
    16 vs 4
  • 24 more CPU threads
    This processor has more CPU threads than the average processor (32 vs 8). The average processor has 8 CPU threads.
    32 vs 8
  • 2.07x higher multi-core score
    This processor has a higher Geekbench 6 multi-core score than the average processor (10,762 vs 5,209). The average processor scores 5,209 in Geekbench 6 multi-core.
    10,762 vs 5,209
  • Higher base clock
    This processor has a higher base clock than the average processor (16x3.5 GHz vs 4x3.4 GHz).
    16x3.5 GHz vs 4x3.4 GHz
  • Unlocked for overclocking
    This processor has an unlocked multiplier, while the average processor does not. 22.6% of processors offer this.
  • 6.8% higher boost clock
    This processor has a higher boost clock speed than the average processor (4.7 GHz vs 4.4 GHz). The average processor reaches boost clock speed of 4.4 GHz.
    4.7 GHz vs 4.4 GHz
  • 12.2% higher single-core score
    This processor has a higher Geekbench 6 single-core score than the average processor (1,722 vs 1,535). The average processor scores 1,535 in Geekbench 6 single-core.
    1,722 vs 1,535
  • 2x higher bus transfer rate
    This processor has a higher bus transfer rate than the average processor (16 GT/s vs 8 GT/s). The average processor offers bus transfer rate of 8 GT/s.
    16 GT/s vs 8 GT/s
  • 5.6% better single-core performance
    This processor has a higher PassMark single-core score than the average processor (2,700 vs 2,558). The average processor scores 2,558 in PassMark single-core.
    2,700 vs 2,558
  • 7.11x larger L3 cache
    This processor has a higher L3 cache than the average processor (64 MB vs 9 MB). The average processor has L3 cache of 9 MB.
    64 MB vs 9 MB
  • 2.16x more L3 per core
    This processor has more L3 cache per core than the average processor (4 MB/core vs 1.85 MB/core). The average processor provides 1.85 MB/core of L3 cache per core.
    4 MB/core vs 1.85 MB/core
  • 2.67x larger L2 cache
    This processor has a higher L2 cache than the average processor (8 MB vs 3 MB). The average processor has L2 cache of 3 MB.
    8 MB vs 3 MB
  • 2.67x larger L1 cache
    This processor has a higher L1 cache than the average processor (1,024 KB vs 384 KB). The average processor has L1 cache of 384 KB.
    1,024 KB vs 384 KB
  • 58.2% smaller die size
    This processor has a lower die size than the average processor (74 mm² vs 177 mm²). The average processor has a die size of 177 mm².
    74 mm² vs 177 mm²
  • 41.7% smaller process node
    This processor has a lower process node than the average processor (7 nm vs 12 nm). The average processor uses a process node of 12 nm.
    7 nm vs 12 nm
  • More advanced microarchitecture
    This processor uses a more advanced microarchitecture than the average processor (Matisse vs Kaby Lake).
    Matisse vs Kaby Lake
  • More advanced foundry
    This processor uses a more advanced foundry process than the average processor (TSMC 7 nm vs Intel 14 nm).
    TSMC 7 nm vs Intel 14 nm
  • 8 more PCIe lanes
    This processor has more PCIe lanes than the average processor (24 vs 16). The average processor offers 16 PCIe lanes.
    20 usable lanes
    24 vs 16
  • Newer PCIe version
    This processor supports a newer PCIe version than the average processor (4 vs 3).
    4 vs 3
  • Supports memory overclocking
    This processor supports memory overclocking, while the average processor does not. 43.9% of processors support memory overclocking.
  • 2x more memory capacity
    This processor has more maximum memory capacity than the average processor (128 GB vs 64 GB). The average processor supports 64 GB of memory.
    128 GB vs 64 GB
  • Supports ECC memory
    This processor supports ECC memory, while the average processor does not. 32% of processors support it.
  • 5 °C lower CPU temperature
    This processor has a lower CPU temperature than the average processor (95 °C vs 100 °C). The average processor runs at a CPU temperature of 100 °C.
    95 °C vs 100 °C
  • 2.33x higher base power
    This processor has a higher base power draw than the average processor (105 W vs 45 W). The average processor has a base power draw of 45 W.
    105 W vs 45 W
  • 2.33x higher TDP
    This processor has a higher TDP than the average processor (105 W vs 45 W). The average processor has a TDP of 45 W.
    105 W vs 45 W
  • 5 °C lower temperature limit
    This processor has a lower temperature limit than the average processor (95 °C vs 100 °C). The average processor can run up to 100 °C.
    95 °C vs 100 °C
  • No integrated graphics
    This processor does not include integrated graphics, while the average processor does. 85.4% of processors include integrated graphics.
  • Limited PCIe bifurcation
    This processor supports less flexible PCIe bifurcation than the average processor (x16, x8/x8, x8/x4/x4 vs x16, x8/x8, x4/x4/x4/x4).
    x16, x8/x8, x8/x4/x4 vs x16, x8/x8, x4/x4/x4/x4
  • Narrower instruction support
    This processor supports a narrower instruction set than the average processor (MMX, SSE, SSE2, SSE3, SSSE3, SSE4A, SSE4.1, SSE4.2, AVX, AVX2, FMA3, AES, SHA, AMD-V vs MMX, SSE, SSE2, SSE3, SSSE3, SSE4A, SSE4.1, SSE4.2, AVX, AVX2, F16C, FMA3, AES, SHA, AMD-V).
    MMX, SSE, SSE2, SSE3, SSSE3, SSE4A, SSE4.1, SSE4.2, AVX, AVX2, FMA3, AES, SHA, AMD-V vs MMX, SSE, SSE2, SSE3, SSSE3, SSE4A, SSE4.1, SSE4.2, AVX, AVX2, F16C, FMA3, AES, SHA, AMD-V
  • Older TPM support
    This processor supports an older TPM version than the average processor (fTPM 2 vs PTT 2).
    fTPM 2.0 vs PTT 2.0
  • 32% more expensive
    AMD Ryzen 9 3950X is more expensive than the average processor (£330 vs £250).
    £330 vs £250
  • 32% more expensive
    AMD Ryzen 9 3950X is more expensive than the average processor (£330 vs £250).
    £330 vs £250
  • Narrower instruction support
    This processor supports a narrower instruction set than the average processor (MMX, SSE, SSE2, SSE3, SSSE3, SSE4A, SSE4.1, SSE4.2, AVX, AVX2, FMA3, AES, SHA, AMD-V vs MMX, SSE, SSE2, SSE3, SSSE3, SSE4A, SSE4.1, SSE4.2, AVX, AVX2, F16C, FMA3, AES, SHA, AMD-V).
    MMX, SSE, SSE2, SSE3, SSSE3, SSE4A, SSE4.1, SSE4.2, AVX, AVX2, FMA3, AES, SHA, AMD-V vs MMX, SSE, SSE2, SSE3, SSSE3, SSE4A, SSE4.1, SSE4.2, AVX, AVX2, F16C, FMA3, AES, SHA, AMD-V
  • Older TPM support
    This processor supports an older TPM version than the average processor (fTPM 2 vs PTT 2).
    fTPM 2.0 vs PTT 2.0
  • Limited PCIe bifurcation
    This processor supports less flexible PCIe bifurcation than the average processor (x16, x8/x8, x8/x4/x4 vs x16, x8/x8, x4/x4/x4/x4).
    x16, x8/x8, x8/x4/x4 vs x16, x8/x8, x4/x4/x4/x4
  • No integrated graphics
    This processor does not include integrated graphics, while the average processor does. 85.4% of processors include integrated graphics.
  • 2.33x higher base power
    This processor has a higher base power draw than the average processor (105 W vs 45 W). The average processor has a base power draw of 45 W.
    105 W vs 45 W
  • 2.33x higher TDP
    This processor has a higher TDP than the average processor (105 W vs 45 W). The average processor has a TDP of 45 W.
    105 W vs 45 W
  • 5 °C lower temperature limit
    This processor has a lower temperature limit than the average processor (95 °C vs 100 °C). The average processor can run up to 100 °C.
    95 °C vs 100 °C

Video reviews

Hands-on testing, unboxing, and real-world video evaluations

9.0
Tech YES City
≈ estimated
02/08/2020
Hands-on review · Premiere Pro editing workflow
Verdict
AMD Ryzen 9 3950X is strong for video editing and good value, though a final verdict needs longer testing.
9.0
TechBlock
≈ estimated
03/07/2020
Upgrade review · BIOS troubleshooting and performance tests
Verdict
AMD Ryzen 9 3950X is a great deal for what it offers, with a clear speed jump over the 2700X.
9.0
TechteamGB
≈ estimated
12/06/2020
Review · performance, workload fit and value
Verdict
AMD Ryzen 9 3950X is still the strongest option for productivity workloads, though gaming is not its focus.
8.0
MainstreamPC
≈ estimated
05/03/2020
Long-term review · 3 months of daily workstation use
Verdict
AMD Ryzen 9 3950X is worth it for heavy multi-core workloads, but not a good choice for gaming.
9.0
Major Hardware
≈ estimated
18/02/2020
Upgrade experience · benchmarks and setup problems
Verdict
AMD Ryzen 9 3950X had a rough setup, but after updating the chipset driver, the upgrade was worth it for rendering.
9.5
Applicable Tech
≈ estimated
16/02/2020
Build and benchmarks · overclocking and gaming tests
Verdict
AMD Ryzen 9 3950X is a monster CPU with huge benchmark scores, even with a light overclock.
7.0
ECPU
≈ estimated
01/02/2020
Overclock test · benchmarks and temperatures
Verdict
AMD Ryzen 9 3950X gains about 10% in multi-core speed when overclocked, single-core dips slightly, and cooling stays manageable at 4.4 GHz.
9.5
Nicolas11x12 English
≈ estimated
25/01/2020
Hands-on review · temperature, power and gaming tests
Verdict
AMD Ryzen 9 3950X is the best mainstream processor available, but only worth it for heavy multi-core work, not gaming.
8.0
Bits inside by René Rebe
≈ estimated
24/12/2019
Mini ITX build · Linux kernel compile benchmark
Verdict
AMD Ryzen 9 3950X is roughly twice as fast as the old chip, but it needs better cooling in a mini ITX build.
9.0
ECPU
≈ estimated
20/12/2019
Build switch · benchmarks and quick tests
Verdict
AMD Ryzen 9 3950X brings big multi-core gains for content creation, though it trails the 9900K in some games.
9.0
Bench House
≈ estimated
25/11/2019
Hands-on review · workstation tests and overclocking
Verdict
AMD Ryzen 9 3950X is not a gaming chip, but it is a clear buy for professionals who need heavy multi-core performance.
9.0
Gamers Nexus
≈ estimated
16/11/2019
Overclocking recap · cooler temperature and frequency tests
Verdict
AMD Ryzen 9 3950X has great silicon that passed 5 GHz, though results vary from chip to chip and cooling matters.
More graded video reviews (6)
creator’s own scoreestimated by us

Expert reviews

In-depth analysis and verdict from leading tech publications

9.0
techradar.com
✓ explicit
25/12/2019
Lab test · Launch review
Verdict
The Ryzen 9 3950X is the chip to pick for heavily threaded work, and it needs a serious cooler, while smaller Ryzen chips game just as well.
9.0
techspot.com
✓ explicit
14/11/2019
Benchmark review · Multi-core testing
Verdict
The AMD Ryzen 9 3950X is a multi-core chip that runs efficiently, though Intel's higher-clocked chips still win many lightly threaded game and app tests.
9.0
uk.pcmag.com
✓ explicit
14/11/2019
Lab test · High-core desktop
Verdict
The AMD Ryzen 9 3950X is a 16-core chip for video conversion and 3D rendering that also games at top frame rates.
9.5
hardwarecanucks.com
≈ estimated
14/11/2019
Video review · Real-world benchmarks
Verdict
The AMD Ryzen 9 3950X is a fast 16-core chip for content creators, matching the Core i9-9980XE in Blender and running well on a good air cooler.
9.0
pcmag.com
✓ explicit
14/11/2019
Lab test · Overclocking and gaming
Verdict
The AMD Ryzen 9 3950X is a 16-core chip for heavy multi-core work, but overclocking adds only a few percent since it already runs near its limit.
9.0
pugetsystems.com
≈ estimated
14/11/2019
Rendering test · V-Ray benchmark
Verdict
The Ryzen 9 3950X is a strong V-Ray renderer that trails the Intel Core i9-9960X by about 4% in CPU mode, but faster Core X and Threadripper chips exist.
9.0
notebookcheck.net
≈ estimated
18/05/2020
Lab review · Benchmark results
Verdict
The AMD Ryzen 9 3950X is a 16-core chip with strong multi-core results, beating its predecessor in rendering and encryption, though Intel's i9-9900KS keeps the single-core lead.
9.0
pcgameshardware.de
✓ explicit
15/11/2019
Full review · Eco-Mode and content creation
Verdict
The Ryzen 9 3950X is AMD's fastest chip for video and content creation, but its 16 cores go unused in most games.
8.0
igorslab.de
≈ estimated
19/11/2019
Workstation test · Real-world apps
Verdict
The AMD Ryzen 9 3950X is a workstation chip for CAD and rendering, with a 65-watt Eco Mode that works as expected, though gaming is not its strength.
9.0
hardwareluxx.de
≈ estimated
29/11/2019
Lab test · 16-core desktop CPU
Verdict
The AMD Ryzen 9 3950X is a 16-core chip that should outpace the 3900X in multi-threaded work, though stock is short.
9.0
notebookcheck.com
≈ estimated
18/05/2020
Benchmark review · 16-core desktop CPU
Verdict
The AMD Ryzen 9 3950X renders and compresses large jobs faster than the 3900X, though single-core speed is unchanged.
9.0
igorslab.de
≈ estimated
04/12/2019
Power measurement · Efficiency test
Verdict
The AMD Ryzen 9 3950X beats Intel's Core i9-9960X on both speed and efficiency in these power tests, but temperature and cooling tests were dropped.
9.0
computerbase.de
≈ estimated
14/11/2019
Launch review · Efficiency and gaming
Verdict
The AMD Ryzen 9 3950X more than doubles Ryzen 2000 speed on the same AM4 socket, with only a slight rise in power use and no gaming penalty.
10
chip.de
✓ explicit
23/08/2020
Lab test · Desktop CPU
Verdict
The AMD Ryzen 9 3950X beats Intel's 18-core i9-9980XE in most benchmarks, but it needs a separate cooler and graphics card.
9.0
notebookcheck.biz
≈ estimated
17/06/2020
Benchmark tables · Multi-core tests
Verdict
The AMD Ryzen 9 3950X leads on multi-core workloads like 7-Zip and Geekbench, but single-core speed is close to the Ryzen 7 3700X.
9.0
hwupgrade.it
≈ estimated
14/11/2019
Performance test · Multi-core rendering
Verdict
The AMD Ryzen 9 3950X is the fastest chip tested on average and excels at multi-core work, though it is not ideal for a gaming-only PC.
9.0
tomshw.it
≈ estimated
29/11/2019
Lab test · Productivity and gaming
Verdict
The AMD Ryzen 9 3950X handles heavy productivity and streaming well, though it needs a liquid cooler to perform at its best.
9.0
global.techradar.com
✓ explicit
30/12/2019
Lab test · 16-core desktop CPU
Verdict
The AMD Ryzen 9 3950X beats Intel's 18-core Core i9-10980XE in Cinebench R20 for multi-core work, but in games it only matches a Ryzen 5 3600.
6.0
digitec.ch
≈ estimated
05/12/2019
Retest · Overclocking and cooling
Verdict
The AMD Ryzen 9 3950X ran 3-3.5% slower at stock in these overnight retests, and only an automatic overclock with a liquid cooler beat its first results.

Third-party reviews

What customers like about AMD Ryzen 9 3950X

  • Industry-leading multi-threaded performance for a mainstream socket
  • Excellent power efficiency compared to high-end Intel competitors
  • Compatible with the widely available and affordable AM4 motherboard platform
  • Superior value for content creation tasks like 3D rendering and video encoding
  • Supports PCIe 4.0 for faster storage throughput on X570 motherboards
  • Impressive 'Eco Mode' allows for significant power savings with modest performance impact

What customers don't like about AMD Ryzen 9 3950X

  • Significant price premium compared to the 12-core Ryzen 9 3900X
  • Does not include a bundled CPU cooler; high-end liquid cooling is strongly recommended
  • Overkill for users who primarily focus on gaming
  • Single-core performance trails slightly behind some of Intel's enthusiast offerings
  • Limited overclocking headroom due to being pushed near its limits out of the box
  • Can experience high operating temperatures under heavy multi-core loads

Verdict

The AMD Ryzen 9 3950X is a flagship 16-core, 32-thread desktop processor built on the 7nm Zen 2 architecture for the AM4 socket. It features a 3.5GHz base clock, up to a 4.7GHz boost clock, a massive 72MB of total L2+L3 cache, and a 105W TDP with support for PCIe 4.0. Its main pros include elite multi-threaded performance for content creation, exceptional power efficiency for its core count, and broad compatibility with existing AM4 motherboards. However, cons include the lack of an included stock cooler, the high thermal output requiring premium liquid cooling for optimal performance, and single-core gaming speeds that can be matched by significantly cheaper CPUs.

Compare AMD Ryzen 9 3950X with other processors

1Product to compare no. 1
VS
2Product to compare no. 2
VS
3Product to compare no. 3 (optional)

Graphic comparison of AMD Ryzen 9 3950X and other processors

No results found